Holmgren, J. M., & Werner, M. J. (2021). Raspberry Shake instruments provide initial ground motion assessment of the induced seismicity at the ...
←
→
Page content transcription
If your browser does not render page correctly, please read the page content below
Holmgren, J. M., & Werner, M. J. (2021). Raspberry Shake
instruments provide initial ground motion assessment of the induced
seismicity at the United Downs Deep Geothermal Power project in
Cornwall, UK. Seismic Record, 1(1), 27-34.
https://doi.org/10.1785/0320210010

Publisher's PDF, also known as Version of record
License (if available):
CC BY
Link to published version (if available):
10.1785/0320210010

Link to publication record in Explore Bristol Research
PDF-document

This is the final published version of the article (version of record). It first appeared online via GeoScienceWorld
at https://pubs.geoscienceworld.org/ssa/tsr/article/1/1/27/598705/Raspberry-Shake-Instruments-Provide-Initial-
Ground . Please refer to any applicable terms of use of the publisher.

University of Bristol - Explore Bristol Research
General rights

This document is made available in accordance with publisher policies. Please cite only the
published version using the reference above. Full terms of use are available:
http://www.bristol.ac.uk/red/research-policy/pure/user-guides/ebr-terms/
Raspberry Shake Instruments Provide Initial Ground-
                Motion Assessment of the Induced Seismicity at the
                United Downs Deep Geothermal Power Project in
                Cornwall, United Kingdom
                Joanna M. Holmgren*1                    and Maximilian J. Werner1

                       Abstract
                       Raspberry Shake (RS) seismographs offer the potential for affordable and citizen-led seis-
                       mic monitoring in areas with few publicly available seismometers, especially in previously
                       quiescent regions experiencing induced seismicity. However, their scientific and regula-
                       tory potential remains largely untested. We examine the ground motions recorded by 11
                       RS and one broadband station within 15 km of the United Downs Deep Geothermal
                       Power (UDDGP) project in Cornwall, United Kingdom, to evaluate the RS network’s suit-
                       ability to provide an initial ground-motion assessment of the region. To date, the British
                       Geological Survey (BGS) has reported 232 induced events originating at UDDGP since flow
                       testing began in summer 2020, with two events exceeding local magnitude (ML ) 1.5.
                       Although the RS accelerometers are too noisy for UDDGP’s microseismic events, the ver-
                       tical geophones are useful. Peak ground velocity observations are consistent with relevant
                                                                                                                                                            Cite this article as Holmgren, J. M. and
                       ground-motion models, whereas peak ground acceleration (PGA) values are greater than
                                                                                                                                                            Werner, M. J. (2021). Raspberry Shake
                       predicted. Regional trends in the PGA levels are likely caused by path effects. Finally, RS                                          Instruments Provide Initial Ground-Motion
                       estimates of ML are similar to those reported by the BGS. For sparse national seismic net-                                           Assessment of the Induced Seismicity at the
                       works, RS stations can enable a preliminary evaluation of seismic events and their ground                                            United Downs Deep Geothermal Power
                       motions.                                                                                                                             Project in Cornwall, United Kingdom. The
                                                                                                                                                            Seismic Record. 1, 27–34, doi: 10.1785/
                                                                                                                                                            0320210010.

                Introduction                                                                           observed ground motions. In 2018, development of the
                With its low carbon footprint, geothermal energy is a prom-                            United Downs Deep Geothermal Power (UDDGP) project
                ising alternative resource to hydrocarbons, but its development                        started in Cornwall, southwest England (Ledingham et al.,
                has been hampered by induced seismic risks. Although small                             2019). UDDGP targets a fault zone in the Carnmenellis
                microseismic events can be a natural and common occurrence                             granitic pluton, utilizing the natural fracture permeability and
                at geothermal sites, a few recent cases of larger earthquakes                          gravity to circulate water between two wells drilled to 2.5 and
                have alarmed the public, caused damage, and paused or halted                           4.5 km depths (Paulillo et al., 2020). Since flow testing began in
                energy development, such as in Pohang, South Korea (Kim                                summer 2020, 232 induced microseismic events in the previ-
                et al., 2018) and Basel, Switzerland (Deichmann and                                    ously quiescent region have been recorded by the British
                Giardini, 2009). Knowledge of a region’s expected ground
                motions is key to understanding the seismic hazards associated                         1. School of Earth Sciences, University of Bristol, Bristol, United Kingdom, https://orcid.org/0000-
                with geothermal energy production. Thus, early microseismic                            0002-3371-8217 (JMH);         https://orcid.org/0000-0002-2430-2631 (MJW)
                                                                                                       *Corresponding author: joanna.holmgren@bristol.ac.uk
                events can provide an initial determination of the appropriate-
                                                                                                       © 2021 The Author(s). This is an open access article distributed under the terms of the CC-BY
                ness of the ground-motion models (GMMs) used for the site’s                            license, which permits unrestricted use, distribution, and reproduction in any medium, provided the
                planning and also reveal any unexpected regional trends in                             original work is properly cited.

                https://www.seismosoc.org/publications/the-seismic-record/ • DOI: 10.1785/0320210010                                                                  The Seismic Record               27

Downloaded from http://pubs.geoscienceworld.org/ssa/tsr/article-pdf/1/1/27/5306550/tsr-2021010.1.pdf
by guest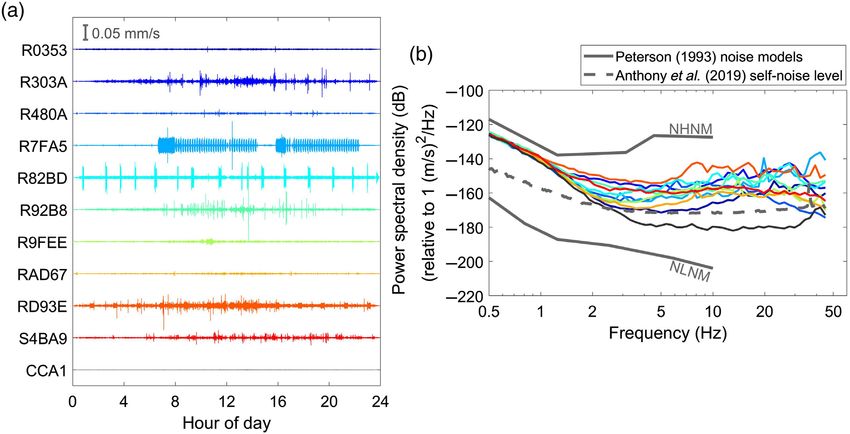
Geological Survey (BGS) (as of March 2021) (see Fig. 1).                               Figure 1. (a) Seismicity in Cornwall since 1990 in local magnitude (ML ). The
                Although no ground motions have exceeded the site’s                                    seismicity linked to United Downs Deep Geothermal Project (UDDGP) is
                                                                                                       shaded blue. (b) Overview map of the United Kingdom and zoom-in of
                “caution” peak ground velocity (PGV) level of 0:5 mm=s
                                                                                                       the Cornish region, with UDDGP (x), Raspberry stations (triangles), British
                (UDDGP information sheet, see Data and Resources), two                                 Geological Survey (BGS) broadband (square), and seismicity (circles)
                events have exceeded local magnitude (M L ) 1.5, providing suf-                        indicated. Color coding denotes geology. MDEV and UDEV refer to
                ficient data to conduct an initial review of the region’s ground                       Middle and Upper Devonian, respectively. (c) Zoom-in of the UDDGP
                                                                                                       seismicity timeline. The geological map is obtained from BGS (see Data
                motions and to evaluate the suitability of relevant GMMs.                              and Resources). The earthquake clusters occurring 1990–1994 and in
                    At present, there is only one public station from the national                     2001 in panel (a) and located near R303A in panel (b) belong to the
                seismic network within 90 km of the UDDGP site, limiting the                           natural Constantine swarm (Walker and Browitt, 1994).
                amount of available data to analyze the seismic hazard.
                Although both the BGS and the UDDGP operators,
                Geothermal Engineering Ltd. (GEL), have deployed local net-                            distributing RS instruments to schools and educating the local
                works to monitor the induced seismicity, at the time of writing,                       population about earthquake preparedness. During the first six
                the waveforms are not yet publicly available. However, GEL has                         months of installation in 2019, the RS network successfully
                provided near-by schools with seven Raspberry Shake (RS) sta-                          recorded local earthquakes between M L 4.0 and 5.2, and an
                tions in an effort to involve the surrounding communities in the                       RS scale relating PGV to M L was developed. RSs have also suc-
                geothermal project (H. Farndale, GEL, personal comm., 2021).                           cessfully been used in combination with broadband sensors
                Along with five RS deployed by hobbyists, 12 publicly available                        throughout the world to examine global seismic noise quieting
                seismic stations are within 15 km of the site (Fig. 1). RSs are an                     due to COVID-19 lockdown measures (Lecocq et al., 2020). In
                affordable alternative to the more established and expensive seis-                     Cornwall, two different types of RS instruments are deployed:
                mic instruments available today (e.g., Anthony et al., 2019), but                      RS1D containing one vertical geophone, and RS4D containing
                their suitability for seismic hazard assessment of induced seis-                       one vertical geophone and three orthogonal accelerometers.
                micity for scientific and regulatory purposes has not yet been                         Anthony et al. (2019) tested three RS4D in the laboratory to
                examined. In western Nepal, Subedi et al. (2020) initiated a                           investigate the instrument response. They found that although
                project to raise awareness of the region’s seismic hazard by                           the RS performed acceptably in terms of timing errors, the

                https://www.seismosoc.org/publications/the-seismic-record/ • DOI: 10.1785/0320210010                                                   The Seismic Record        28

Downloaded from http://pubs.geoscienceworld.org/ssa/tsr/article-pdf/1/1/27/5306550/tsr-2021010.1.pdf
by guest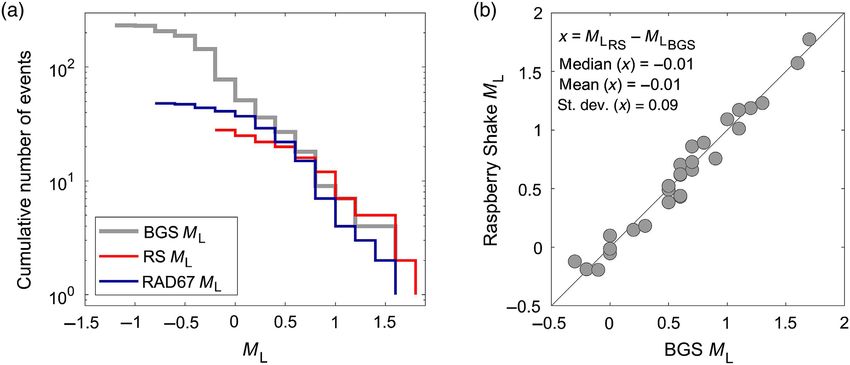
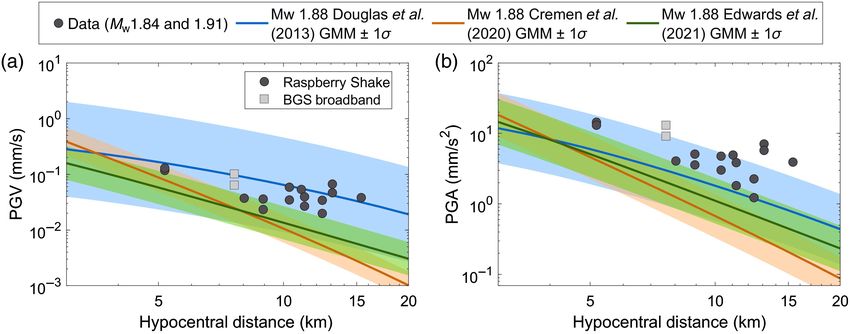
largest limitation was the sensors’ high self-noise levels,                            Figure 2. Noise analysis of a quiescent 24 hr day (14 November 2020).
                especially those of the accelerometers. They determined that the                       (a) Vertical ground velocity time series for the Raspberry Shake (RS,
                                                                                                       colored traces) and BGS broadband station (CCA1, black trace). All traces
                strong-motion instruments are more suitable for recording large
                                                                                                       are high-pass filtered (1 Hz) and scaled equally in amplitude for com-
                (magnitude > 6) local earthquakes.                                                     parability. (b) Averaged velocity power spectral density (PSD) for each
                   Here, we investigate the ground motions recorded by the                             station using 50% overlapping 1 hr time windows of the waveforms in
                Cornwall RS network to assess its suitability in the (present)                         panel (a) and color coded as in panel (a). The Peterson (1993) new high-
                                                                                                       noise model (NHNM) and new low-noise model (NLNM) are shown as a
                absence of data from a traditional seismic network. To assess
                                                                                                       reference, along with the RS4D geophone self-noise curve from Anthony
                the network’s usability and limitations, we investigate noise                          et al. (2019).
                levels, calculate observed PGV and peak ground acceleration
                (PGA), evaluate GMMs, and finally estimate M L to find the
                magnitude of completeness and compare to the BGS M L .                                 closest RS station (RAD67) is 1.4 km away (epicentral distance)
                                                                                                       from the site, and the BGS broadband (CCA1) is 6.6 km away.
                UDDGP Induced Seismicity and Publicly                                                  The combination of high noise levels and the events’ low mag-
                Available Stations                                                                     nitudes made the accelerometers unusable, limiting the study to
                Since August 2020, the BGS has reported 232 induced earth-                             only the vertical geophones. The geophones contain a single-
                quakes originating at the UDDGP site, spanning local magni-                            component 4.5 Hz sensor with an electronic extension allowing
                tudes (M L ) between −1.3 and 1.7 and depths between 4.1 and                           usable frequencies down to ∼1 Hz, with a 100 Hz sampling fre-
                5.2 km (see Data and Resources). The locations and magnitudes                          quency. The broadband seismometer is a 100 Hz Nanometrics
                are estimated by the BGS, using triggered event data provided by                       Trillium (240 s natural period).
                GEL’s monitoring network. At present, there are 12 publicly                               As an initial evaluation of the stations, we pick a quiescent
                available stations within 15 km of the site: two RS1Ds, nine                           24 hr period when most of the instruments were active to analyze
                RS4Ds, and one broadband seismometer from the BGS national                             the noise levels (Fig. 2). The availability of the RS varied from
                seismic network (Fig. 1b). Most of the RS stations are located on                      station to station, most experiencing periods when they were
                sedimentary rocks originating from the Devonian period,                                temporarily turned off. RB30C was only active until the begin-
                whereas the broadband and one of the RS stations are located                           ning of October 2020 and is not included in Figure 2. We first
                on the granitic intrusion (BGS, see Data and Resources). The                           assess temporal trends of the stations’ time series by instrument

                https://www.seismosoc.org/publications/the-seismic-record/ • DOI: 10.1785/0320210010                                                  The Seismic Record      29

Downloaded from http://pubs.geoscienceworld.org/ssa/tsr/article-pdf/1/1/27/5306550/tsr-2021010.1.pdf
by guest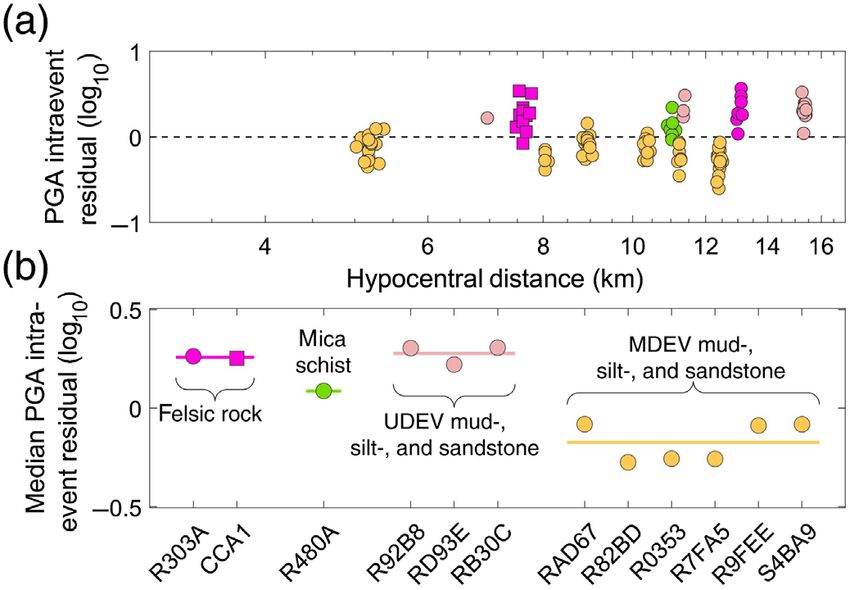
correcting and scaling them to make their amplitudes compa- the Butcher et al. (2020) conversion developed for small
rable (Fig. 2a). We also evaluate each station’s power spectral earthquakes in New Ollerton, United Kingdom:
density (PSD) function by splitting the instrument-corrected
traces into 50% overlapping 1 hr segments, computing the EQ-TARGET;temp:intralink-;df1;314;680 M w 0:69M L 0:74: 1
PSD using multitaper (Prieto et al., 2009), and finding the aver-
age over the 24 hr period (Fig. 2b). As reference, we include the This leads to M w between 0.0 and 1.9.
Peterson (1993) new high- and low-noise models , and the RS4D Figure 3 shows the observed PGV and PGA values plotted
geophone self-noise curve from Anthony et al. (2019). As against hypocentral distance. The average event depth is 4.8 km.
expected, the BGS broadband station (CCA1, black line) has As a reference, PGV thresholds have been included for the
the lowest noise level, seen both by the low relative amplitude UDDGP cautious state at 0:5 mm=s, when humans can detect
in its time series and the PSD. The RS stations, on the other hand, motion at 2:0 mm=s, and when UDDGP takes action at
experience various types of noise over the duration of the day. 8:5 mm=s (GEL information sheet, see Data and Resources).
We observe similar trends for each station in all 24 hr segments We also examine the two largest events (M L 1.6 and 1.7, or
that we investigated. The higher noise levels in the RS instru- equivalently M w 1.84 and 1.91, shaded dark-gray circles and
ments are likely due to a combination of deployment in subop- squares in Fig. 3) and compare their PGA and PGV observations
timal locations near anthropogenic noise, such as machinery in to three relevant GMMs. Douglas et al. (2013; hereafter, D13)
buildings or train tracks, and the high self-noise levels (Anthony developed a GMM for geothermally induced seismicity from
et al., 2019). Europe and United States, uncorrected for site, and targeting
M w ≥ 1 and hypocentral distances (Rhypo ) < 30 km. Cremen
Ground-Motion Analysis et al. (2020; hereafter, C20) adjusted the Douglas GMM to create
We estimate PGV and PGA of the vertical components for all a model for M L ≥ 0 and Rhypo ≤ 10 km, using induced events
earthquakes using the RS and broadband instruments to evaluate from a shale gas site (Preston New Road) and a coal mining site
their suitability as an alternative to more established seismic net- in the United Kingdom. Finally, Edwards et al. (2021; hereafter,
works. First, we analyze the signal-to-noise ratio (SNR) of the E21) adjusted the Atkinson (2015) induced seismicity GMM
events in the frequency domain by selecting 6 s time windows using the Preston New Road dataset to target M L ≥ 0:25 and
encompassing the P, S, and coda waves and pre-P-wave noise Rhypo < 25 km. We note that all three GMMs are developed
windows of equal length. We remove any events with SNR below for horizontal ground motions. Preferably, the vertical RS
2. The instrument-corrected time series are then filtered around ground motions should be converted to their horizontal counter-
the good SNR bandwidth using a two-pole, two-pass part or the GMMs to their vertical counterpart. However,
Butterworth filter and differentiated to retrieve acceleration time because this conversion factor is unknown for the RS and
series. To ensure sufficient frequency coverage for usable PGV GMMs, we assume that the vertical and horizontal are equal.
and PGA measurements, we denote f 1 and f 2 as the minimum As can be seen in Figure 3a, the PGV observations of the
and maximum acceptable SNR frequencies, respectively, and two largest events are adequately predicted by the D13 GMM,
evaluate their coverage. PGV is generally related to the moderate although higher than expected by the C20 and E21 models.
frequencies, whereas PGA reflects the higher frequencies (Booth, Interestingly, the PGA observations are higher than predicted
2007). Here, we require f 2 =f 1 ≥ 2 and 2f 1 ≤ 10 Hz to compute by all three models (Fig. 3b). The discrepancies could be due to
PGV (Edwards et al., 2021), and f 2 ≥ 35 Hz for a usable PGA several reasons. One reason could be that the region simply
measurement. To remove any records due to noise peaks, we experiences more high-frequency content than other regions,
only keep events recorded on either the broadband station caused by higher earthquake stress drops or alternatively less
(CCA1) or the closest and relatively quiet RS station (RAD67). path and site attenuation. This would imply that the UDDGP
Any extreme outliers were manually examined to see if they were site should not rely on these three GMMs for their seismic haz-
noise or earthquake and removed accordingly. This resulted in ard assessments, and that they need a GMM adjusted specifi-
225 PGV observations for 85 events and 198 PGA observations cally for Cornwall to predict the ground-motion levels
for 83 events, spanning M L between −1.1 and 1.7. adequately. Another reason for the discrepancies could be
In ground-motion analysis, moment magnitude (M w ) is the linked to our (necessary) usage of the vertical component,
preferred magnitude scale. Because BGS reports in M L , we use whereas the GMMs model horizontal ground motions. In
https://www.seismosoc.org/publications/the-seismic-record/ • DOI: 10.1785/0320210010 The Seismic Record 30
Downloaded from http://pubs.geoscienceworld.org/ssa/tsr/article-pdf/1/1/27/5306550/tsr-2021010.1.pdf
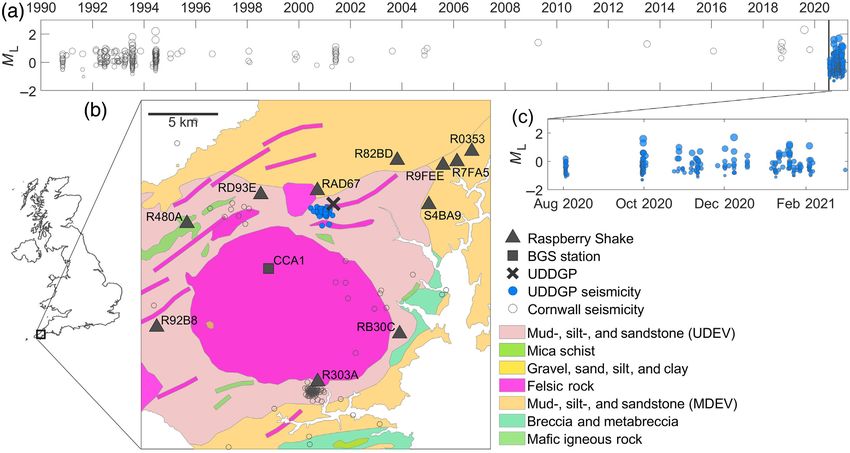
by guestgeneral, the horizontal component includes more site charac- Figure 3. (a) Peak ground velocity (PGV) and (b) peak ground acceleration
teristics than the vertical (Lermo and Chávez-García, 1993). (PGA) observations of the UDDGP seismicity. The average event depth is
4.8 km. RS observations are shown as circles and BGS broadband as
The D13 GMM does not include site effects, plausibly explain-
squares. The two largest induced events from UDDGP (Mw 1.84 and 1.91)
ing the better match with PGV values, whereas both the C20 are shaded dark gray. Three ground-motion models (GMMs) for an
and E21 GMMs are adjusted to the shale gas environments Mw 1.88 event are shown as solid lines, with the shaded areas repre-
they were developed for. Finally, the events’ M w are not esti- senting 1σ. PGV thresholds at 0:5 mm=s when UDDGP enters “cau-
tious” state, 2:0 mm=s when humans can detect ground motion, and
mated from the data directly, but instead estimated using an
8:5 mm=s when UDDGP takes action have been included as a reference
empirical scale developed for a coal mine environment (equa- in panel (a).
tion 1, Butcher et al., 2020). Thus, there will be differences in
the path and site effects compared to a geothermal site target-
ing a granite, which could result in M w and GMM-level
discrepancies.
To further evaluate the RS ground motions, we estimate sta-
tion terms using the PGA observations. We choose PGA
because it reflects the high-frequency content of earthquakes
and site parameters, such as κ and f max , primarily affect the
higher frequencies. Using the E21 GMM, we compute PGA
intraevent residuals for all M L ≥ 0:25 earthquakes. E21 was
developed for similar earthquake sizes and distances to the
UDDGP dataset, while having a smaller sigma (σ) than D13.
Intraevent residuals reflect the record-to-record variability
caused by site and path effects not encompassed by the GMM
(Atik et al., 2010). Figure 4a shows the intraevent residuals
against distance, highlighted in the corresponding geological
color. Each station’s median intraevent residual is shown in
Figure 4b, grouped according to lithology. Both the smallest
and largest residuals, indicating lower and higher observed Figure 4. PGA intraevent residuals compared to geological setting, using
the Edwards et al. (2021) GMM and ML ≥ 0:25. (a) Intraevent residuals
PGA than expected, respectively, correspond to mud-, silt-,
plotted against hypocentral distance, color coded according to station
and sandstone stations. Thus, site effects are less likely the geology (see Fig. 1). (b) Median station intraevent residuals grouped
cause behind the station trends. One plausible explanation based on geology.
https://www.seismosoc.org/publications/the-seismic-record/ • DOI: 10.1785/0320210010 The Seismic Record 31
Downloaded from http://pubs.geoscienceworld.org/ssa/tsr/article-pdf/1/1/27/5306550/tsr-2021010.1.pdf
by guestcould be linked to the travel paths of the seismic waves. The Figure 5. (a) Local magnitude (ML ) distribution using the BGS catalog, RS
network, and closest RS station (RAD67, Rhypo 5 km). (b) Comparison
UDDGP site is situated on the northeastern side of the
of ML estimated by the BGS and by the RS instruments.
Carnmenellis granitic pluton, which is on average 3–4 km deep
and extends down to 23 km in the center (Taylor, 2007). The
travel path between the UDDGP seismicity and the north- kilometers. The term −1:16e−0:2Rhypo accounts for observations
northeastern Middle Devonian mud-, silt-, and sandstone sta- at close distances (0 < Rhypo < 20 km). We convert all instru-
tions is mostly through sedimentary rocks (Fig. 1). In contrast, ment-corrected traces to Wood–Anderson seismographs,
the seismic waves must travel through the granitic pluton for assuming that the response of a 1.25 Hz Wood–Anderson
longer to reach the remaining stations. Because of granite’s instrument with 0.8 damping can be approximated by a
lower-attenuation properties, the ground motions at the 2 Hz high-pass filter (Havskov and Ottemoller, 2010).
remaining stations are less attenuated, resulting in larger Using a 6 s time window and removing records with SNR < 2,
amplitudes. Furthermore, the lithological alteration caused we compute the M L for all RS stations. We then estimate each
by the Carnmenellis pluton baking and stiffening its surround- event M L as the median of its stations’ M L , requiring a mini-
ing host rock could also lead to harder rock and lower-attenu- mum of three station M L per event, and obtain 28 event M L
ation properties. ranging between −0.2 and 1.8. The reported BGS M L were
computed via equation (2) using horizontal data from the local
Local Magnitude Analysis GEL network (B. Baptie, BGS, personal comm., 2021).
Traffic light systems commonly use PGV or M L to monitor Figure 5a compares the M L distributions from the BGS cata-
induced seismicity. As a final assessment of the RS stations, log and RS stations. Unsurprisingly, the BGS M L has the lowest
we estimate the M L of the UDDGP events, excluding the magnitude of completeness (M c ) at ∼ − 0:4. A larger M c of
BGS broadband seismometer. We use the M L scale developed ∼0:8 is obtained from the RS network caused by high noise
for the United Kingdom by Luckett et al. (2019) and currently levels masking the smaller events. We also include the M L dis-
used by the BGS: tribution estimated by the closest RS station (RAD67,
Rhypo 5 km), located at similar distance as the GEL stations.
M L log10 A 1:11 log10 Rhypo 0:00189Rhypo
EQ-TARGET;temp:intralink-;df2;47;133
Although RAD67’s M c (∼0:2) is still larger than the BGS M c
− 1:16e−0:2Rhypo − 2:09; 2 and estimated using only one station, it demonstrates that
in which A is the largest zero-to-peak displacement amplitude deploying more RS at closer distances could lower the M c .
in nanometers, and Rhypo is the hypocentral distance in A lower M c can, for example, improve the b-value estimate
https://www.seismosoc.org/publications/the-seismic-record/ • DOI: 10.1785/0320210010 The Seismic Record 32
Downloaded from http://pubs.geoscienceworld.org/ssa/tsr/article-pdf/1/1/27/5306550/tsr-2021010.1.pdf
by guestand provide more useful events for developing and testing seismic networks rely on the quality and availability of their
forecast models. stations and are regularly maintained by technicians. The same
Finally, we compare the RS M L to the M L reported by the level of technical support may not be available to private RS
BGS (see Fig. 5b). Interestingly, the vertical RS geophones were owners. The availability of the RS in Cornwall varied from sta-
able to predict similar M L to the BGS, with a median difference tion to station, but most stations had periods when they were
of −0.01. Theoretically, the BGS M L should be larger because turned off. To ensure a resilient network capable of continuous
the horizontal component is amplified at the site, unless the monitoring when individual stations are offline, RS networks
site is hard rock in which case the vertical and horizontal thus need sufficiently many sensors.
amplitudes are comparable (Alsaker et al., 1991). Anthony et al. Another limitation of the RS stations in this study was that
(2019) found that the higher self-noise of RS can lead to larger only the vertical geophones were usable; because of their high
M L for small events. To investigate this, we compared our RS noise levels, we had to discard all accelerometer data and
M L to the vertical broadband (CCA1) M L and did not find RS instead assume that horizontal and vertical motions are equal.
M L relatively larger than CCA1 M L with decreasing magni- Generally, buildings are more vulnerable to horizontal
tude. Another plausible explanation could be the distance cor- motions, and thus the horizontal component is preferred
rection factor in equation (2); considering the close proximity for GMMs and M L analysis. Nonetheless, the RS instruments
of the GEL network, these stations will have been more provide a useful preliminary assessment of the ground motions
strongly corrected than the average RS station. Using the M L associated with the induced seismicity at the UDDGP site. We
equation without the additional near-field correction might were able to evaluate the suitability of different GMMs for the
have resulted in higher M L for BGS. region, examine regional trends in the observed ground-
motion levels likely due to a combination of site and path
Discussion and Conclusion effects, and estimate M L comparable to the BGS network.
We have evaluated the performance of a network of private We conclude that an RS network is a suitable alternative for
citizen-operated and affordable RS stations to record ground preliminary (but not definitive) seismic hazard analysis in
motions of induced microseismicity associated with flow test- regions lacking publicly available data from established seismic
ing at the UDDGP site. Notwithstanding data-quality chal- networks.
lenges, the RS network can provide an initial determination
of the applicability of GMMs and thus has significant potential Data and Resources
for wider monitoring usage, seismic hazard assessment, and The British Geological Survey (BGS) earthquake catalog for the
citizen–scientist involvement. Local magnitudes determined United Downs Deep Geothermal Power (UDDGP) events is
with the RS network also matched BGS magnitudes very available through their database search at http://www
closely. Another component to seismic monitoring is deter- .earthquakes.bgs.ac.uk/earthquakes/dataSearch.html (last
mining locations, which can be challenging without a accessed March 2021). The BGS geological map of Cornwall
detailed velocity model. In this study, we used the locations is obtained from https://ngdc.nerc.ac.uk/products/digitalmaps/
reported by the BGS. However, geothermal-induced seismicity dataInfo.html (last accessed February 2021). The Raspberry
tends to occur near the production well opening (e.g., Kwiatek Shake data are available through the Raspberry Shake
et al., 2019), providing an acceptable proxy location for International Federation of Digital Seismograph Networks
an initial earthquake assessment if locations were not (FDSN) server (http://www.fdsn.org/networks/detail/AM/, last
available. accessed March 2021). The BGS data are available from the
Limitations of the RS sensors are, however, important to BGS FDSN server (https://eida.bgs.ac.uk/, last accessed March
characterize. RS noise levels are high compared to the publicly 2021). All waveforms were downloaded and instrument cor-
available broadband in the region. In addition to the high self- rected using Obspy (Beyreuther et al., 2010). Processing was car-
noise of RS instruments (Anthony et al., 2019), several of the ried out in MATLAB (www.mathworks.com/products/matlab,
stations were also exposed to high external noise levels, likely last accessed March 2021). The Geothermal Engineering Ltd.
caused by the environments they were installed in. High noise (GEL) UDDGP information sheet can be found at https://
levels are especially limiting when events are small and easily geothermalengineering.co.uk/wp-content/uploads/2020/08/Seis
masked by interfering signals. Furthermore, permanent micity-Information-Sheet.pdf (last accessed February 2021).
https://www.seismosoc.org/publications/the-seismic-record/ • DOI: 10.1785/0320210010 The Seismic Record 33
Downloaded from http://pubs.geoscienceworld.org/ssa/tsr/article-pdf/1/1/27/5306550/tsr-2021010.1.pdf
by guestDeclaration of Competing Interests Edwards, B., H. Crowley, R. Pinho, and J. J. Bommer (2021). Seismic
The authors declare no competing interests. hazard and risk due to induced earthquakes at a shale gas site, Bull.
Seismol. Soc. Am. 111, no. 2, 875–897, doi: 10.1785/0120200234.
Havskov, J., and L. Ottemoller (2010). Routine Data Processing in
Acknowledgments Earthquake Seismology: With Sample Data, Exercises and
The authors thank Reviewers Robert Anthony and John Software, Springer Science & Business Media, New York, New
Douglas and Editor Keith Koper for their useful comments, York, 347 pp.
which have helped improve this article. In addition, Brian Kim, K. H., J. H. Ree, Y. Kim, S. Kim, S. Y. Kang, and W. Seo (2018).
Baptie, Anthony Butcher, Gemma Cremen, Jessica Irving, Assessing whether the 2017 M w 5.4 Pohang earthquake in South
and Robert Myhill are thanked for their valuable help and dis- Korea was an induced event, Science 360, no. 6392, 1007–1009.
Kwiatek, G., T. Saarno, T. Ader, F. Bluemle, M. Bohnhoff, M.
cussion. Maximilian J. Werner would like to acknowledge
Chendorain, G. Dresen, P. Heikkinen, I. Kullonen, P. Leary, et al.
Mark Vanstone’s great Twitter feed (@wmvanstone) about (2019). Controlling fluid-induced seismicity during a 6.1-km-deep
seismology enabled by Raspberry Shakes. This research was geothermal stimulation in Finland, Sci. Adv. 5, no. 5, eaav7224,
supported by Natural Environment Research Council doi: 10.1126/sciadv.aav7224.
(NERC) (NE/R017956/1, “EQUIPT4RISK”) and the Bristol Lecocq, T., S. P. Hicks, K. Van Noten, K. Van Wijk, P. Koelemeijer, R.
University Microseismic ProjectS (“BUMPS”). S. De Plaen, F. Massin, G. Hillers, R. E. Anthony, M. T. Apoloner,
et al. (2020). Global quieting of high-frequency seismic noise due
to COVID-19 pandemic lockdown measures, Science 369,
References
no. 6509, 1338–1343.
Alsaker, A., L. B. Kvamme, R. A. Hansen, A. Dahle, and H. Bungum
Ledingham, P., L. Cotton, and R. Law (2019). The United Downs
(1991). The M L scale in Norway, Bull. Seismol. Soc. Am. 81,
Deep Geothermal Power project, Proc. 44th Workshop on
no. 2, 379–398.
Geothermal Reservoir Engineering, 1–11.
Anthony, R. E., A. T. Ringler, D. C. Wilson, and E. Wolin (2019). Do
Lermo, J., and F. J. Chávez-García (1993). Site effect evaluation using
low-cost seismographs perform well enough for your network? An
spectral ratios with only one station, Bull. Seismol. Soc. Am. 83,
overview of laboratory tests and field observations of the OSOP
no. 5, 1574–1594.
Raspberry Shake 4D, Seismol. Res. Lett. 90, no. 1, 219–228.
Luckett, R., L. Ottemöller, A. Butcher, and B. Baptie. (2019).
Atik, L. A., N. Abrahamson, J. J. Bommer, F. Scherbaum, F. Cotton,
Extending local magnitude M L to short distances, Geophys. J.
and N. Kuehn (2010). The variability of ground-motion prediction
Int. 216, no. 2, 1145–1156.
models and its components, Seismol. Res. Lett. 81, no. 5, 794–801.
Paulillo, A., L. Cotton, R. Law, A. Striolo, and P. Lettieri (2020).
Atkinson, G. M. (2015). Ground-motion prediction equation for small-
Geothermal energy in the UK: The life-cycle environmental
to-moderate events at short hypocentral distances, with application
impacts of electricity production from the United Downs Deep
to induced-seismicity hazards, Bull. Seismol. Soc. Am. 105, no. 2A,
Geothermal Power project, J. Clean. Prod. 249, 119,410, doi:
981–992.
10.1016/j.jclepro.2019.119410.
Beyreuther, M., R. Barsch, L. Krischer, T. Megies, Y. Behr, and J.
Peterson, J. R. (1993). Observations and modeling of seismic back-
Wassermann (2010). ObsPy: A Python toolbox for seismology,
ground noise, U.S. Geol. Surv. Open-File Rept. 93-322, 95 pp.
Seismol. Res. Lett. 81, no. 3, 530–533.
Prieto, G. A., R. L. Parker, and I. F. L. Vernon (2009). A Fortran 90
Booth, E. (2007). The estimation of peak ground-motion parameters
library for multitaper spectrum analysis, Comput. Geosci. 35, no. 8,
from spectral ordinates, J. Earthq. Eng. 11, no. 1, 13–32.
1701–1710.
Butcher, A., R. Luckett, M. J. Kendall, and B. Baptie (2020). Seismic
Subedi, S., G. Hetényi, P. Denton, and A. Sauron (2020). Seismology at
magnitudes, corner frequencies, and microseismicity: Using ambi-
school in Nepal: A program for educational and citizen seismology
ent noise to correct for high-frequency attenuation, Bull. Seismol.
through a low-cost seismic network, Front. Earth Sci. 8, 73.
Soc. Am. 110, no. 3, 1260–1275.
Taylor, G. K. (2007). Pluton shapes in the Cornubian Batholith: New
Cremen, G., M. J. Werner, and B. Baptie (2020). A new procedure for
perspectives from gravity modelling, J. Geol. Soc. 164, no. 3, 525–528.
evaluating ground-motion models, with application to hydraulic-
Walker, A. B., and C. W. A. Browitt (1994). BGS seismic monitoring
fracture-induced seismicity in the United Kingdom, Bull. Seismol.
and information service fifth annual report, British Geol. Surv.
Soc. Am. 110, no. 5, 2380–2397.
Tech. Rept. WL/94/10, available at https://earthquakes.bgs.ac.uk/
Deichmann, N., and D. Giardini (2009). Earthquakes induced by the
publications/annual_reports/1994_5th_annual_report.pdf (last
stimulation of an enhanced geothermal system below Basel
accessed May 2021).
(Switzerland), Seismol. Res. Lett. 80, no. 5, 784–798.
Douglas, J., B. Edwards, V. Convertito, N. Sharma, A. Tramelli, D.
Kraaijpoel, B. M. Cabrera, N. Maercklin, and C. Troise (2013).
Predicting ground motion from induced earthquakes in geother- Manuscript received 31 March 2021
mal areas, Bull. Seismol. Soc. Am. 103, no. 3, 1875–1897. Published online 13 May 2021
https://www.seismosoc.org/publications/the-seismic-record/ • DOI: 10.1785/0320210010 The Seismic Record 34
Downloaded from http://pubs.geoscienceworld.org/ssa/tsr/article-pdf/1/1/27/5306550/tsr-2021010.1.pdf
by guestYou can also read