Evaluation of an experimental induced ignition engine under different gasoline Evaluación experimental de un motor de encendido provocado bajo ...
←
→
Page content transcription
If your browser does not render page correctly, please read the page content below
Scientific Paper / Artículo Científico
                                                                                    https://doi.org/10.17163/ings.n26.2021.02
                                                                                     pISSN: 1390-650X / eISSN: 1390-860X

       Evaluation of an experimental induced
      ignition engine under different gasoline
       Evaluación experimental de un motor
      de encendido provocado bajo diferentes
                      gasolinas
              Víctor Alfonso Taipe-Defaz1            , Edilberto Antonio Llanes-Cedeño1∗                  ,
            César Fabricio Morales-Bayetero1,2              , Ana Elizabeth Checa-Ramírez1

       Received: 09-07-2020, Received after review: 04-12-2020, Accepted: 03-02-2021, Published: 01-07-2021

 Abstract                                                     Resumen
 The internal combustion engine with provoked ig- El motor de combustión interna de encendido provo-
 nition is a thermal machine that enables obtaining cado es una máquina térmica que permite obtener una
 mechanical power from the chemical energy of a fuel. potencia mecánica a partir de la energía química de un
 The objective of this work was to evaluate the perfor- combustible. El presente trabajo tuvo como objetivo
 mance of an internal combustion engine through the evaluar el desempeño de un motor de combustión in-
 balance of energy and exergy, under the individual use terna mediante el balance de energía y exergía, bajo el
 of the three types of gasoline sold in Ecuador (Super, uso individual de las tres gasolinas comercializadas en
 Extra and Ecopais). The experimental methodology el Ecuador (Súper, Extra y Ecopaís). La metodología
 consisted of starting the engine with the individual experimental consistió en la puesta en marcha bajo
 use of gasoline until reaching its maximum power el uso individual de las gasolinas hasta alcanzar su
 at engine speed, and taking measurements of tem- máxima potencia a una velocidad de giro del mo-
 perature, specific fuel consumption and air-fuel ratio tor, donde se tomaron mediciones de temperatura,
 during 3 minutes. Results show an energy efficiency of consumo específico del combustible y la relación aire
 11.31% for the Super gasoline, 10.75% for the Extra combustible para un tiempo de tres minutos. Los re-
 gasoline and 10.39% for the Ecopais gasoline. Regard- sultados muestran una eficiencia energética de 11,31
 ing exergy efficiency, 58.81% was established for the % para gasolina Súper, 10,75 % para gasolina Extra
 Super gasoline, 58.89% for the Extra gasoline and y 10,39 % para gasolina Ecopaís. En lo relacionado a
 59.19% for the Ecopais gasoline. Results enable us la eficiencia exergética se estableció un 58,81 % para
 to conclude that there is an exergy potential for im- la gasolina Súper, 58,89 % para la gasolina Extra y
 provement that may be an opportunity to increase un 59,19 % para la gasolina Ecopaís. Los resultados
 energy efficiency.                                     permiten concluir que existe un potencial exergético
                                                        de mejoramiento que puede ser una oportunidad para
                                                        aumentar la eficiencia energética.

 Keywords: energy balance, exergy, energy consump-            Palabras clave: balance de energía, exergía, con-
 tion, ignition motor induced.                                sumo energético, motor de encendido provocado.

1,∗
   Grupo de Investigación Eficiencia, Impacto Ambiental e Innovación en la Industria y el Transporte, Facultad de
   Ingeniería y Ciencias Aplicadas, Carrera de Mecánica, Universidad Internacional SEK, Quito - Ecuador. Autor para
   correspondencia ): antonio.llanes@uisek.edu.ec.
2
  Universidad Técnica del Norte, Ibarra - Ecuador.
Suggested citation: Taipe-Defaz, V. A.; Llanes-Cedeño, E. A.; Morales-Bayetero, C. F. and Checa-Ramírez, A. E. (2021).
«Evaluation of an experimental induced ignition engine under different gasoline». Ingenius. N.◦ 26, (july-december).
pp. 17-29. doi: https://doi.org/10.17163/ings.n26.2021.02.

                                                         17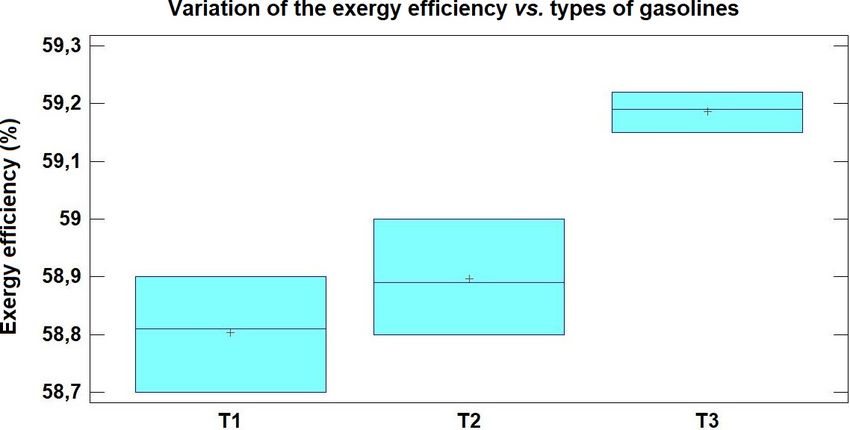
18 INGENIUS N.◦ 26, july-december of 2021
1. Introduction contains a mixture of 95 % of premixed naphtha and
5 % of ethanol [12].
Internal combustion engines (ICE) have great applica- The development of the automotive industry has
tions in energy generation and cogeneration systems, an impact on the energy shortage [13], however, the
and in the automotive industry. Therefore, testing and increasing demand of biofuels as an alternative to miti-
studying the performance of these engines is very im- gate the emission of gases and reduce the consumption
portant to contribute to a larger growth of its scope of oil-based fuels is only a part of the solution [14],
of application and operation quality [1, 2]. therefore, it is necessary to evaluate the performance
In general, ICEs have a larger delivery and activity of the engine through energy and exergy analyses.
in the transportation sector, in which the use of fuels The energy analysis is based on the first law of ther-
and the increase of emissions are related with indus- modynamics, as an efficient way to know the energy
trial processes that drive a strong economic activity of distribution characteristics reflected in the conversion,
marketing and insurance of goods and supplies [3, 4]. transfer, usage and energy loss of the fuel in terms of
In Ecuador, the transport sector represents 49 % of the quantity. With this characteristic as a guide, specific
total energy consumption, where 98.3 % comes from measures may be used to reduce energy loss. However,
diesel and gasolines, representing 25 % of the emission the energy analysis does not reflect the difference in
of greenhouse gases due to the combustion of gasolines energy quality, term which is indeed considered for the
[5]. exergy analysis; the latter is based on the second law
The ICE is the most efficient and reliable energy of thermodynamics, the exergy study may evaluate
plant in the transport (gasoline and diesel engines) and the energy quality to achieve a total reusability of the
heavy machinery (diesel engine) sector. It is expected energy lost [15].
that ICEs are present until: (i) fuel shortage becomes With respect to the energy analysis of the ICEs, up
a serious problem; (ii) less polluting and more efficient to 55 % of the input energy is yielded to the environ-
new technologies are developed as replacement; or (iii) ment through exhaust gases and various heat exchange
emissions regulations, established by environmental processes between the engine configuration of the en-
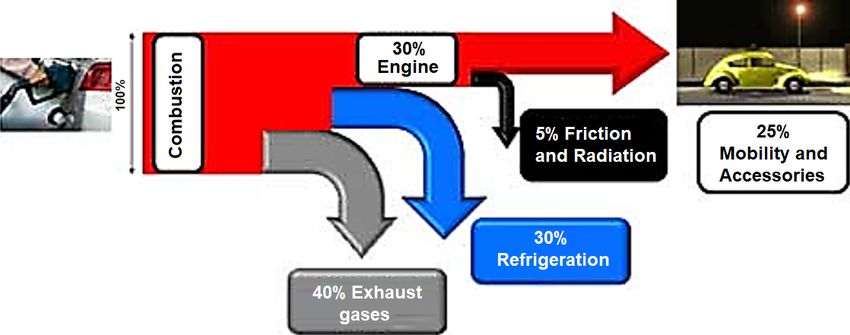
agencies to improve quality of air, become unreachable gine, the refrigerant and the lube oil [16]. Figure 1
for engine and vehicle manufacturers [6]. indicates the performance percentages of an ICE.
Since the last century, the automotive industry has
been analyzing the design of engines with the purpose
of reducing emissions of greenhouse gases –carbon diox-
ide (CO2 ), nitrogen oxides (NOx ), carbon monoxide
(CO)– and particulate matter (PM), main responsible
for the degradation of the environment [7, 8]. In addi-
tion, ICEs are designed to guarantee a specific output
power combined with the greatest possible efficiency
[9]. The improvements have also increased through the
use of fuels with better properties; one of the impor- Figure 1. Sankey Diagram in ICE [17]
tant factors that determine the quality of gasolines
is the so-called octane rating [10]. It is defined as a The ICE is a thermal engine that transforms chem-
quantification of the quality and antiknocking capa- ical energy into mechanical energy, generally available
bility of gasolines; its main feature is identifying thein a turning output shaft. The chemical energy of the
combustion process within the engine: a high-octane fuel is first transformed into thermal energy through
rating represents a better antiknocking capability. the combustion or oxidation with the air within the
For example, in South America the gasolines with engine, and after the combustion the reactants are
higher octane rating are Argentina and Peru with 98, transformed in products such as carbon dioxide (CO2 ),
followed by Brazil with 95 and Colombia with 92 [11]. water (H2 O) and carbon monoxide (CO). The thermal
Three types of gasolines are sold in Ecuador, which energy increases the pressure and temperature of the
come from domestic refineries. According to the INEN gases within the engine, the high-pressure gas expands
935 REGULATION, these are classified based on their against the mechanical mechanisms of the engine [18].
octane-rating in two types: With the objective of reinforcing the knowledge and
skills of the students of Automotive Engineering, the
• Super Gasoline, with a minimum octane rating
SEK International University acquired an experimental
of 92.
bench for ICEs, specifically engines with provoked ig-
• Extra Gasoline and Ecopais, with a minimum nition (EPI). It is unknown the energy performance of
octane rating of 87. such engine when using the gasolines sold in Ecuador.
Based on the above, the general objective of this
The Ecopais gasoline is defined as a biofuel which research study is to evaluate the performance of an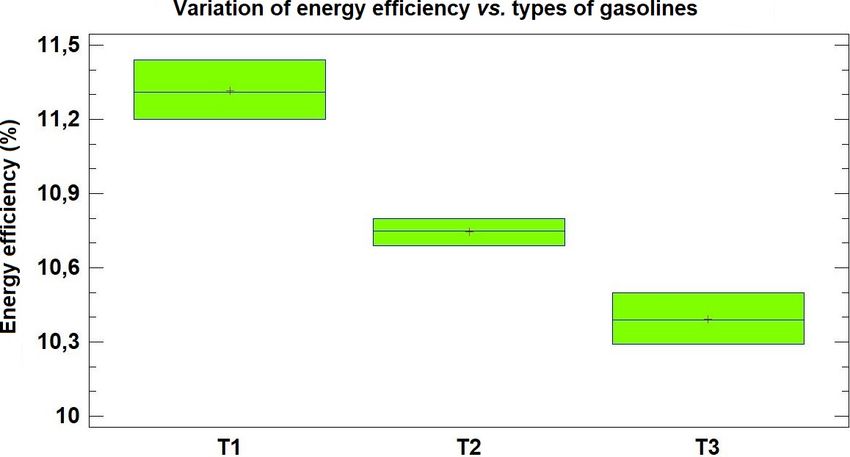
Taipe-Defaz et al. / Evaluation of an experimental induced ignition engine under different gasoline           19

experimental engine with provoked ignition, by means          Regarding the scope, the present study is exper-
of the energy and exergy balance, with the individual imental, because it is based on the management of
use of the three gasolines sold in Ecuador, for assessing parameters that measure the performance of the en-
and evaluating its performance.                           gine, such as torque, rotational speed, engine power,
                                                          volumetric flow and specific consumption of fuel under
2. Materials and methods                                  strictly controlled circumstances, with the objective
                                                          of explaining how or why a particular situation or
Figure 2 indicates that the walls of the combustion circumstance arises [22].
chamber constitute the boundaries of the system.              The engine under study is a 1 cylinder four-stroke
When using the first law of thermodynamics it is ob- CT 150 air-cooled EPI, with carburetor. With an ap-
tained the decomposition of the system energy, equa- proximate weight of 15 kg, dimensions L × W × H (420
tion 1, which is equivalent to saying that «the change × 300 × 320 mm), approximate power of 2.2 kW, oil
in the system energy (Esys), assuming that there are volume 0.6 L, magnetic ignition voltage, compression
no energy losses in deformations of the control volume, ratio 7:1, thermal probe for measuring the temperature
reduces to the change in the internal energy of the of exhaust gases from 0 to 1000 °C, driven by a pulley
system (U)» [19].                                         of diameter 125 mm, and SPA 1250 v-belt (see Figure
                                                          3).

                                                                        Figure 3. CT 150 engine

 1. Energy of the system (Esis)                          The following instruments and materials (inte-
 2. Energy supplied to the system by the fuel (Qcomb) grated in the experimental bench as illustrated in
 3. Inlet load (madm*hadm)                            Figure 4) were used for conducting the research:
 4. Mechanical work (W )
 5. Heat dissipated through the refrigerant (Qref )
 6. Heat of the exhaust gases (mesc*hesc)
 7. Equivalent heat of the chamber gases that es-
 cape through the interstices between the segments
 (mfug*hfug)

  Figure 2. Thermodynamic model of an ICE [20, 21]

     dEsis    dU     dQcomb     dQref r    dW
           =      =          +           +      +
      dt      dt        dt         dt        dt      (1)
       dmadm           dmesc          dmf ug
     +         hadm +        hesc +          hf ug
          dt             dt             dt
    For the practical purposes of calculating the energy Figure 4. Experimental bench. Air-cooled gasoline engine
balance of the engine, Equation (1) may be rewritten with 1 cylinder, and HM 365 universal drive and brake unit
as shown in equation (2) [21]:

                                         dU                 • Air-cooled gasoline engine with one cylinder.
       Qcomb + madm hadm = W + Qref r        +
                                          dt        (2)
                       +mesc hesc + mf ug hf ug             • HM 365 universal drive and brake unit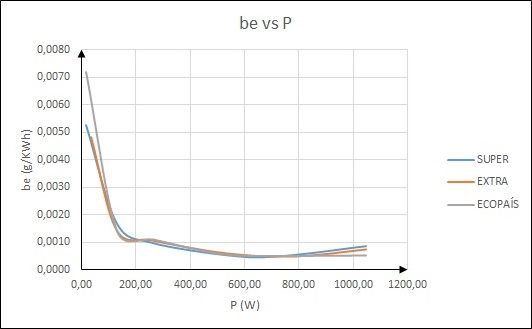
20                                                                 INGENIUS N.◦ 26, july-december of 2021

     • Asynchronous motor with frequency converter         • Repeat the procedure for a second reading to be
                                                             able to calculate the average.
          – power: 2200 W
                                                           • Apply Equation (3) for obtaining the power:
          – maximum speed: 3000 min−1 approx.
          – maxumum torque: 12 Nm approx.                                         2πnM
                                                                            P =        (W )                  (3)
     • Operation with v-belt                                                        60
                                                           • Plot power (y axis) vs. rpm (x axis).
          – v-belt length: 1157 mm, 1180 mm, 1250 mm
                                                            The following steps were implemented to obtain
          – type of v-belt: SPA
                                                         the consumption curve:
          – diameter of the v-belt pulley: 125 mm
                                                           • The engine is adjusted to operate at constant
     • Resistive load: 72 Ω, 2400 W                          revolutions (2500 rpm), and it is measured the
                                                             time at which 5.1 cm3 are consumed (which cor-
     • Measurement ranges                                    responds to a descent of 1 cm in the scale of the
          – torque: ± 15 Nm                                  measuring tube, thus determining the volumetric
                                                             flow Q) for a fixed torque in the equipment.
          – speed: 0. . . 5000 min−1
                                                           • Values are recorded for different engine torques
     • 400 V, 50 Hz, 3 phases                                (always maintaining the engine at 2500 rpm), the
                                                             results are recorded in a table.
     • 400 V, 60 Hz, 3 phases
                                                           • Make a table that records the power, the mass
     • 230 V, 60 Hz, 3 phases                                flow ṁ = Qρf luid (where Q is the volumetric
                                                             flow and ρf luid is the density of the fuel) and the
     • Super, Extra and Ecopais Gasolines (see Table
                                                             specific consumption (be ) obtained by means of
       1, fundamental features)
                                                             Equation (4):

              Table 1. Properties of the fuels                                           ṁ
                                                                                  be =                       (4)
                                                                                         P
      Parameters        Super     Extra      Ecopais       • Plot be (y axis) and P (x axis).
     Octane
                          92        87            87
     Rating (OR)                                         2.1. Calculation of the thermal balance
     Sulphur
                         0,065    0,065          0,065
                                                  The energy balance of the ICEs is basically a study of
     content (%)
     Gum content                                  the first law of thermodynamics, which is also called
                        4        3         3      energy balance, heat balance or thermal balance [20].
     (mg/100 ml)
     Aromatic                                     The analysis of the thermal balance is an efficient way
                        35       30        30     to know the energy flow, enables the designer to evalu-
     content (% vol.)
     Olefin                                       ate the variation of internal energy as a function of the
                        18       18        18
     content (% vol.)                             energy transfers as heat or work through the bound-
     Final point of                               aries, and the enthalpies associated with the mass flow
                       220      220       220
     evaporation (°C)                             that crosses these boundaries, and then presenting a
     Density (kg/m3 )  722      723       749     highly potential method which reduces fuel consump-
     LCV (kJ/kg)      48345    45124     44739    tion in the engines [24]. The thermal balance enables
   Note: Taken from the study conducted by Rocha- carrying out the following equality: Energy that enters
   Hoyos, et al. [23]                             the system = Energy that exits the system.
                                                      From another point of view, Equation (5) is fulfilled
   The following steps were implemented to obtain for a process with flow and steady state.
the power curve:                                              X        X            X
                                                                 Q=        Hinput −     Houtput         (5)
   • Start the engine at full load.
                                                  Where:
     • Adjust the torque potentiometer (M) to progres-      P
       sively brake the engine (n) (reducing the rpm).          Q: sum of heat evacuated to the environment
                                                            P
     • Record the torque (M) and the number of revo-            Houtput : sum of enthalpies that exit the system
       lutions (n) in a table (9 readings).
Taipe-Defaz et al. / Evaluation of an experimental induced ignition engine under different gasoline 21
P
Hinput : sum of enthalpies that enter the system Pmax = Maximum power of the engine
In the light of the above, the sum of heats that Q̇c = heat released by the fuel
cross the system is equal to the difference between the
sum of enthalpies that enter the system and the sum of
enthalpies that exit the system [19]. On the other hand, 2.2. Exergy balance
the change of enthalpy is a measure of the amount of
The exergy is established as the analysis of the per-
energy absorbed or delivered in a thermodynamic sys-
formance of the system based on the second law of
tem, i.e., is the change produced by a transformation in
thermodynamics. The exergy is the amount of «energy
which it is possible to receive or provide energy (such
available» in the system. The exergy analysis is used
as in the present case study, mechanical energy), and
to define the type, location and extent of the energy
thus the enthalpy may be considered as numerically
losses in different parts of an ICE [25]. The exergy
equal to the heat exchanged with the environment.
is defined as the maximum amount of useful theo-
In order to solve the thermal balance, the following
general calculations are taken into account. retical work, which may be obtained when a system
reaches thermodynamic equilibrium with the environ-
ment. The destruction of exergy or the irreversibilities
2.1.1. Mass flow of fuel (Equation 6)
are accompanied by the generation of entropy. The
v
ṁc = ρ (6) main objective of an exergy analysis is to conceptualize
∆t the optimal design for a system, the design parameters
Where: and operation have considerable effects in the exergy
balance during the operation of engine [26].
ṁc = mass flow of fuel (kg/s) Three main sources of destruction of exergy may
be identified: irreversibilities in the cylinder, mechan-
ρ = fuel specific density (kg/m3 ) ical irreversibilities and other forms of irreversibility.
The effects of the heat transfer of the gases to the
V = fuel volume (m3 ) cylinder wall, the combustion and the viscosity are
explained in the cylinder. Mechanical irreversibilities
∆t = flow time (180 s) are caused by friction, which may be calculated by the
difference between the indicated braking power. Other
irreversibilities explain the sum of various irreversible
2.1.2. Heat released by the fuel (Equation (7)) processes, such as the pumping losses, the mixing pro-
cess of air and fuel, the choking and the heat transfer
Q̇c = ṁc · P CI (7) from the wall to the cooling system [27].
Where: The exergy balance is determined according to the
following methodology:
Q̇c = Heat released by the fuel (kW) Exergy associated to the fuel heat (Equation (10)):
P CI = lower calorific value of the fuel (kJ/kg) Eχc = ṁc LCV (10)
Where:
2.1.3. Flow of exhaust gases (Equation (8)) Eχc = Exergy of the fuel (kW)
ṁg = ṁair + ṁf uel (8)
LCV = lower calorific value of the fuel (kJ/kg)
Where:
Another very fundamental section of the exergy
ṁair = flow of air (kg/s) balance is the flow of exhaust gases from the engine.
The specific heat used is determined based on a mean
ṁf uel = mass flow of fuel (kg/s) of the specific heat values, at the corresponding in-
put and output operating temperatures of the engine
The energy efficiency of the system is determined (Equation 11):
according to Equation (9).
Pmax T T
ηenergy = (9) Ėχg = ṁg C T
P 0 − 1 − ln (11)
Q̇c T0 T0
Where: Where:22 INGENIUS N.◦ 26, july-december of 2021
Ėχg = Exergy associated to the flow of gas (kW) 2.3. Experimental design
ṁg = Flow of gas (kg/s) The software Statgraphics Centurion XVI is used for
the analysis and comparison of results, performing a
CP = Specific heat at constant pressure (kJ/kg K) simple ANOVA for the different treatments (combi-
nations) shown in Table 2. Three repetitions of each
T0 = Reference temperature (K) treatment were carried out, as established by the NTE
INEN 2205 [28] regulation in its section 6 about test-
T = Temperature of the exhaust gases (K) ing methods, where item 6.1.5.4 states «Record and
average a minimum of three readings in each test».
The exergy efficiency is determined from Equation The fuel with three levels (Extra, Super and Ecopais)
(12): is the independent variable, while energy and exergy
efficiency are the dependent variables.
P P An ANOVA analysis was used to determine if
Einputf lows − Eoutputf lows
ηexergy = P (12) there is a significant difference among the experimen-
Einputf lows tal groups, applying tests of multiple comparison of
The specific heat of air at a temperature T (K), is means, for this case the Least Significant Difference
given by Equation (13): (LSD) in a 95 % of confidence [29, 30].
Table 2. Treatments for the analysis of significant
cpar,T = C0 + C1 T + C2 T 2 + C3 T 3 + C4 T 4 (J/kgK)
(13)
Number of
For a temperature between 200 and 800 K. Engine Fuels
treatments
Where: T1 Motor CT 150 Super
T2 Motor CT 150 Extra
T3 Motor CT 150 Ecopais
c0 = 1, 0189 × 103
c1 = −1, 3784 × 10−1
c2 = 1, 9843 × 10−4
c3 = 4, 2399 × 10−7 3. Results and discussion
c4 = −3, 7632 × 10−10
Table 3 shows the results of the nine measurements of
The specific heat of the combustion gases at con- revolutions and torque, variables required for calculat-
stant pressure is given by Equation (14): ing power and for plotting P vs. n.
Figure 5 indicates the power as a function of the
f turning speed of the engine, it is observed that as the
cp g,T = cpar,T + θCp,T (J/kgK) (14) turning speed increases, the power generated also in-
1+f
creases, but only up to reaching its maximum power.
Where: The maximum power generated with the use of the
ṁcomb Super gasoline is 1174.17 W, which corresponds to
f= (15) an engine turning speed of 3199 rpm. The maximum
ṁar
power generated with the use of the Extra gasoline is
1142.46 W, which corresponds to an engine turning
θCp,T = CP0 T + CP1 T 2 + CP3 T 3 + CP4 T 4 + CP5 T 5 speed of 3121.5 rpm.
(16) At last, the maximum power generated with the
For a temperature between 200 and 800 K. use of the Ecopais gasoline is 1183.35 W, which cor-
responds to an engine turning speed of 3224 rpm. In
summary, it is obtained that for speeds under 3000
cpo = −3, 5949 × 102 rpm there are no differences in the behavior of the
cp1 = 4, 5164 × 100 power, as opposed to speeds between 3000 and 3600
cp2 = 2, 8116 × 10−3 rpm where the Super and Ecopais gasolines show the
−5 best results. These results are compatible with the
cp3 = −2, 1709 × 10
works [31] and [32], where power tests with the Extra
cp4 = 2, 8689 × 10−8 and Super gasolines were carried out, obtaining the
cp5 = −1, 2226 × 10−11 same behavior trend as in the present study.Taipe-Defaz et al. / Evaluation of an experimental induced ignition engine under different gasoline 23
Figure 5. Curves of power vs. rpm
Figure 6. Curves of specific consumption vs. power
Table 3. Values of revolutions, torque and power
Super Extra Ecopais
n (rpm) M (Nm) P(W) n (rpm) M (Nm) P(W) n (rpm) M (Nm) P(W)
3753 0,5 196,51 3808,5 0,495 197,42 3815 0,5 199,75
3671 1,03 395,96 3724 1,005 391,93 3743 1,005 393,93
3624 1,5 569,26 3650,5 1,505 575,33 3671,5 1,5 576,72
3579,5 1,995 747,81 3609 2,005 757,76 3623 2,01 762,59
3528 2,505 925,48 3559,5 2,5 931,87 3621 2,5 947,98
3501,5 3 1100,03 3342 3 1049,92 3554 3,005 1118,38
3199 3,505 1174,17 3121,5 3,495 1142,46 3224 3,505 1183,35
2474,5 4,005 1037,81 2412,5 4,005 1011,81 2340 4,01 982,63
2333 4,5 1099,4 2169 4,5 1022,12 2067,5 4,505 975,37
Table 4 shows the results of the six power and mass by Quimbita and Guallichico [32], where it is observed
flow measurements, parameters required for calculat- a fuel specific consumption of 47.44 g/kWh for the
ing specific consumption (be ). Super gasoline, 43.17 g/kWh for the Extra gasoline
Figure 6 indicates the fuel specific consumption as and 49.96 g/kWh for the Ecopais gasoline.
a function of the power generated; as power increases
the fuel specific consumption reduces to approximately Table 5 shows the results of the measurements re-
600 W, and then a slight increase starts to occur from quired for calculating the thermal balance of the ICE
this value with the greatest consumptions occurring at at maximum power, carried for the Super, Extra and
low revolutions. This result is compatible with the one Ecopais gasolines; and Table 6 indicates the variables
obtained by Alzate and Agudelo [3], where tests were obtained when applying the methodology described
carried out in the operating regime from 1100 rpm to in the section of the method.As indicated in Table 4,
3600 rpm; from 1100 rpm to 2000 rpm the fuel spe- the energy efficiency for the Super gasoline is 11.31
cific consumption diminished progressively down to its %, and the exergy efficiency is 58.81 %, for the Extra
minimum value, a from then on it successively grew as gasoline 10.75 % and 58.89 %, and for the Ecopais
a function of the increase in the engine turning speed. gasoline 10.39 % and 59.19 %, respectively; this is due
In summary, it may be concluded that the behavior of to the fact that there is an amount of exergy being
the specific consumption for the three gasolines is not destroyed in the exhaust gases that can be used to
significant, similar to the results obtained in the study generate work.24 INGENIUS N.◦ 26, july-december of 2021
Table 4. Tabulated values of power, mass flow and specific consumption for the different gasolines tested
Super Extra Ecopais
P(W) m(kg/h) be (g/kwh) P(W) m(kg/h) be (g/kwh) P(W) m(kg/h) be (g/kwh)
18,33 0,096 0,0053 36,652 0,1777 0,0048 15,708 0,1132 0,0072
130,9 0,22 0,0017 130,9 0,1891 0,0014 130,8997 0,1817 0,0014
261,8 0,254 0,001 264,417 0,2824 0,0011 264,4174 0,2938 0,0011
562,87 0,277 0,0005 534,071 0,3222 0,0006 526,2168 0,3003 0,0006
748,75 0,373 0,0005 785,398 0,3836 0,0005 785,3982 0,4045 0,0005
1047,2 0,89 0,0008 1047,198 0,7808 0,0007 1047,1976 0,5567 0,0005
Table 5. Tabulated average values for calculating energy and exergy efficiency at maximum power
Mmax Pmax Consumption Q Pc ṁc ṁaire ṁgas T̄e T̄s PCI
(Nm) (W) (m3 ) (m3 /s) (kg/m3 ) (kg/s) (kg/s) (kg/s) (°C) (°C) (kJ/kg)
Gasolina Super
3,505 1174,17 53,55 2,97 E-07 722 0,0002148 0,002071 0,002286 22,77 543 48345,66
Gasolina Extra
3,495 1142,46 58,65 3,26 E-07 723 0,0002356 0,002046 0,002282 23,72 543,5 45124,76
Gasolina Ecopais
3,505 1183,35 61,2 3,40 E-07 749 0,0002547 0,00206 0,002315 23,77 541,5 44739,17
Note: The values of LCV were taken from the study by Rocha-Hoyos et al. [23]
Table 6. Average results of energy and exergy efficiency calculated at maximum power
Pmax Q̇c ηener Eχg Eχc Eχk ηener
(W) (kW) % (kW) (kW) (kW) %
Gasolina Super
1174,17 10,38 11,31 0,64 10,38 3,63 58,81
Gasolina Extra
1142,46 10,63 10,75 0,65 10,63 3,72 58,89
Gasolina Ecopais
1183,35 11,39 10,39 0,66 11,39 3,99 59,19
Note: The exergy due to the conduction and convection
heat transfers has been denoted as Eχk , estimated as 35
% of Eχc according to Li et al. [7].
Having an exergy efficiency greater than an energy 79 % were obtained at the beginning of the study, and
efficiency, implies that there is an exergy potential later a reduced exergy efficiency of 56 % was achieved
for improvement through which it is possible to take due to the use of the exhaust gases that escape from
advantage of part of that exergy being destroyed and the turbine to generate vapor (cogeneration), thus
transform it into work, thus achieving an increase in enabling an increase of 67 % in the energy efficiency.
the thermal efficiency [33].
The results obtained are compatible with the work
by Gonzalez et al., [33], where it was obtained an ex-
ergy efficiency of 14.77 % which is greater than the
energy efficiency of 12.79 %, concluding that this dif- Table 7 and Figure 7 represent the multiple range
ference is due to the increase of 43.19 % in the engine test and the box and whisker plot for the energy ef-
turning speeds. ficiency as dependent variable. It is concluded that
On the other hand, according to Llerena [34], an there is a significant difference between the gasolines,
energy efficiency of 39 % and an exergy efficiency of and the Super gives the best result.Taipe-Defaz et al. / Evaluation of an experimental induced ignition engine under different gasoline 25
Table 7. Analysis of significant differences for the energy For a better visualization of the results of the en-
efficiency ergy part, values of energy flow are presented in Table
9, as well as Figures 9, 10 and 11, which represent the
Homogeneous Sankey diagrams for the three types of gasoline used.
Fuel Cases Mean
Groups These diagrams represent the quantitative distribution
T3 (Ecopais) 3 10,39 X of the energy flows that enter and exit the system, as
T2 (Extra) 3 10,75 X well as the losses due to heat transfer and emission of
T1 (Super) 3 11,31 X exhaust gases.
Note: Method: 95.0 percentage of LSD
Table 9. Values of energy flow
Energy flow (kW)
Gasoline Super Extra Ecopais
Fuel 10,38 10,63 11,39
Exhaust Gases 5,58 5,77 6,22
Losses due to convection 3,63 3,72 3,99
Shaft power 1,17 1,14 1,18
With the results obtained it may be concluded that
the amount of energy loss in the engine under study
when using the Super gasoline is 9.21 kW (88.73 %) as
indicated in Figure 9, whereby it was determined that
the engine has an energy efficiency of 11.31 % and an
Figure 7. Comparative graph of the energy efficiency for exergy efficiency of 58.81 %.
the different types of gasoline On the other hand, the amount of energy loss in the
engine under study when using the Extra gasoline is
On the other hand, Table 8 and Figure 8 show the 9.49 kW (89.28 %) as indicated in Figure 10, whereby
multiple range test and the box and whisker plot for it was determined that the engine has an energy ef-
the exergy efficiency as dependent variable, where it is ficiency of 10.75 % and an exergy efficiency of 58.89
concluded that there is a significant difference between %.
the gasolines, with the Ecopais gasoline giving the
best result; however, there is no significant difference
between the Extra and the Super gasolines.
Table 8. Analysis of significant differences for the exergy
efficiency
Homogeneous
Fuel Cases Mean
Groups
T1 (Super) 3 58,8 X Figure 9. Sankey Diagram-Super Gasoline
T2 (Extra) 3 58,89 X
T3 (Ecopais) 3 59,19 X
Note: Method: 95.0 percentage of LSD
Figure 10. Sankey Diagram-Extra Gasoline
At last, the amount of energy loss in the engine
under study when using the Ecopais gasoline is 10.21
kW (89.64 %) as indicated in Figure 11, whereby it was
Figure 8. Comparative graph of the exergy efficiency for determined that the engine has an energy efficiency of
the different types of gasoline 10.39 % and an exergy efficiency of 59.19 %.26 INGENIUS N.◦ 26, july-december of 2021
References
[1] A. Filho, M. Rodrigues, J. Santos, C. Cunha, and
J. a. Donatelli, “Balanço Energético e Exergético
de uma Pequena Central Termelétrica Equipada
com um Motor de Combustão Interna a Diesel,”
in Conference: Iberian Latin American Congress
on Computational Methods in Engineering At:
Figure 11. Sankey Diagram-Ecopais Gasoline Cartagena das Índias, Colombia, 11 2019. [Online].
Available: https://bit.ly/3bPazB4
[2] E. A. Llanes-Cedeño, Y. Guardia-Puebla, A. de la
With the results presented it may be concluded Rosa-Andino, S. Cevallos-Carvajal, and J. C.
that there are variations in the energy and exergy effi- Rocha-Hoyos, “Detección de fallas en motores
ciency in the motor under study when using the three de combustión mediante indicadores de tem-
gasolines, the best efficiency of 11.31 % is obtained for peratura y presión de inyección,” INGENIUS,
the Super gasoline. It is also observed that the largest no. 22, pp. 38–46, 2019. [Online]. Available:
energy loss of 10.21 kW (89.64 %) exists in the engine https://doi.org/10.17163/ings.n22.2019.04
for the Ecopais gasoline, this energy loss occurs in the
emission of exhaust gases and in the conduction and [3] J. D. Ramírez Alzate and A. Arcila Agudelo,
convection heat transfers, consistent with the results of Validación experimental de la relación de com-
Llanes-Cedeño, Carguachi-Caizatoa, and Rocha-Hoyos presión para varios combustibles a utilizar en
[19], and at the same time this represents a high ex- un motor de combustión interna. Universidad
ergy potential for improvement which may be used to Tecnológica de Pereira, 2017. [Online]. Available:
generate work and simultaneously achieve an increase https://bit.ly/3r5PqJ6
in the energy efficiency of the engine when using the
Ecopais gasoline, these results are compatible with the [4] E. A. Llanes Cedeño, V. D. Zambrano León,
ones obtained by Valle et al. [35], where energy losses A. S. Cevallos Carvajal, E. R. Mena Mena, and
of 8.57 kW (66.35 %) of a total of 12.92 kW (100 %) J. C. Rocha Hoyos, Teoría de selección y dimen-
were obtained. sionamiento del parque automotor. Universidad
de las Fuerzas Armadas – ESPE, 2017. [Online].
Available: https://bit.ly/3q7plYI
4. Conclusions [5] Ministerio de Electricidad y Energía Renovable,
Balance Energético Nacional 2017. Gobierno
de la República del Ecuador, Ministerio e
The static engine which was studied when using differ-
Electricidad y Energía Renovable, 2017. [Online].
ent gasolines, shows an energy efficiency of 11.31 % for
Available: https://bit.ly/37ZUQOm
the Super gasoline, 10.75 % for the Extra gasoline and
10.39 % for the Ecopais gasoline. Regarding exergy [6] Erdiwansyah, R. Mamat, M. S. M. Sani, K. Sud-
efficiency, it was determined as 58.81 % for the Super hakar, A. Kadarohman, and R. E. Sardjono,
gasoline, 58.89 % for the Extra gasoline and 59.19 % “An overview of Higher alcohol and biodiesel
for the Ecopais gasoline. The exergy efficiency is much as alternative fuels in engines,” Energy Reports,
greater than the energy efficiency in each of the cases, vol. 5, pp. 467–479, 2019. [Online]. Available:
thus existing an exergy potential for improvement that https://doi.org/10.1016/j.egyr.2019.04.009
may take advantage of the exergy being destroyed to
transform it into work, and thus achieve an increase [7] Y. Li, M. Jia, S. L. Kokjohn, Y. Chang,
in the energy efficiency. and R. D. Reitz, “Comprehensive analy-
The maximum power of the engine is directly pro- sis of exergy destruction sources in differ-
portional to the energy efficiency, therefore, it may be ent engine combustion regimes,” Energy, vol.
concluded that the best energy efficiency of the engine 149, pp. 697–708, 2018. [Online]. Available:
was obtained when consuming the Super gasoline, with https://doi.org/10.1016/j.energy.2018.02.081
a maximum power generated of 1183.35 W at 3224 [8] P. Tamilselvan, N. Nallusamy, and S. Ra-
rpm and an energy efficiency of 11.31 %. jkumar, “A comprehensive review on per-
Based on the methodology applied, energy effi- formance, combustion and emission charac-
ciencies in the range from 10.39 % to 11.31 % were teristics of biodiesel fuelled diesel engines,”
determined, which are very low compared to the real Renewable and Sustainable Energy Reviews,
thermal efficiencies of an internal combustion engine vol. 79, pp. 1134–1159, 2017. [Online]. Available:
which oscillate between 25 % and 30 %. https://doi.org/10.1016/j.rser.2017.05.176Taipe-Defaz et al. / Evaluation of an experimental induced ignition engine under different gasoline 27
[9] N. Dolatabadi, M. Forder, N. Morris, R. Rahmani, hydrogen internal combustion engine,” Inter-
H. Rahnejat, and S. Howell-Smith, “Influence national Journal of Hydrogen Energy, vol. 44,
of advanced cylinder coatings on vehicular no. 11, pp. 5551–5563, 2019, the 6th Interna-
fuel economy and emissions in piston com- tional Conference on Energy, Engineering and
pression ring conjunction,” Applied Energy, Environmental Engineering. [Online]. Available:
vol. 259, p. 114129, 2020. [Online]. Available: https://doi.org/10.1016/j.ijhydene.2018.10.047
https://doi.org/10.1016/j.apenergy.2019.114129
[16] R. Morgan, G. Dong, A. Panesar, and M. Heikal,
[10] E. A. Llanes Cedeño, J. C. Rocha-Hoyos, D. B. “A comparative study between a rankine
Peralta Zurita, and J. C. Leguísamo Milla, cycle and a novel intra-cycle based waste
“Evaluación de emisiones de gases en un vehículo heat recovery concepts applied to an inter-
liviano a gasolina en condiciones de altura. nal combustion engine,” Applied Energy, vol.
Caso de estudio Quito, Ecuador,” Enfoque UTE, 174, pp. 108–117, 2016. [Online]. Available:
vol. 9, pp. 149–158, 06 2018. [Online]. Available: https://doi.org/10.1016/j.apenergy.2016.04.026
https://doi.org/10.29019/enfoqueute.v9n2.201
[17] M. Razmara, M. Bidarvatan, M. Shahbakhti, and
[11] E. Castillo Rivera, L. Mora Díaz, E. Gutiérrez R. D. Robinett, “Optimal exergy-based control
Gualotuña, O. Martínez Valdez, P. Tafur Es- of internal combustion engines,” Applied Energy,
canta, A. Soria Amancha, A. Villavicencio Poveda, vol. 183, pp. 1389–1403, 2016. [Online]. Available:
G. Torres Rodríguez, and R. Baldeón López, “Aná- https://doi.org/10.1016/j.apenergy.2016.09.058
lisis, estudio y modelamiento matemático para la
[18] K. Venkata Sundar Rao, S. N. Kurbet, and
caracterización energética de las gasolinas comer-
V. V. Kuppast, “A review on performance of
ciales en función de los parámetros de calidad ref-
the IC engine using alternative fuels,” Mate-
erentes a las normas ASTM,” Aporte Santiaguino,
rials Today: Proceedings, vol. 5, no. 1, Part
no. 1, pp. 122–137, 2019. [Online]. Available:
1, pp. 1989–1996, 2018, international Con-
https://doi.org/10.32911/as.2019.v12.n1.612
ference on Processing of Materials, Minerals
[12] M. A. William Fernando, C. P. Galarza Valarezo, and Energy (July 29th – 30th) 2016, Ongole,
and A. López Hidalgo, “Evaluación del consumo Andhra Pradesh, India. [Online]. Available:
específico de combustible y emisiones de gases https://doi.org/10.1016/j.matpr.2017.11.303
de escape, con el uso del combustible Eco-país
[19] E. A. Llanes-Cedeño, J. B. Carguachi-Caizatoa,
en un motor de combustión interna alternativo,”
and J. C. Rocha-Hoyos, “Evaluación energé-
Master’s thesis, Universidad del Azuay – Facultad
tica y exergética en un motor de combustión
de Ciencia y Tecnología – Escuela de Ingeniería en
interna ciclo Otto de 1.6 L,” Enfoque UTE,
Mecánica Automotriz, 2017. [Online]. Available:
vol. 9, pp. 221–232, 12 2018. [Online]. Available:
https://bit.ly/3kB8dd5
https://doi.org/10.29019/enfoqueute.v9n4.365
[13] M. Mofijur, M. G. Rasul, J. Hyde, and
[20] P. Sun, Z. Liu, X. Yu, C. Yao, Z. Guo, and
M. M. K. Bhuyia, “Role of Biofuels on IC
S. Yang, “Experimental study on heat and
Engines Emission Reduction,” Energy Procedia,
exergy balance of a dual-fuel combined injection
vol. 75, pp. 886–892, 2015, clean, Efficient
engine with hydrogen and gasoline,” International
and Affordable Energy for a Sustainable Fu-
Journal of Hydrogen Energy, vol. 44, no. 39,
ture: The 7th International Conference on
pp. 22 301–22 315, 2019. [Online]. Available:
Applied Energy (ICAE2015). [Online]. Available:
https://doi.org/10.1016/j.ijhydene.2019.06.149
https://doi.org/10.1016/j.egypro.2015.07.211
[21] C. A. Romero Piedrahita, “Contribución al
[14] Q. Wang, W. Sun, L. Guo, L. Fan, P. Cheng, conocimiento del comportamiento térmico y la
H. Zhang, and Y. Sun, “Effects of EGR and gestión térmica de los motores de combustión
combustion phasing on the combustion and interna alternativos,” Ph.D. dissertation, Univer-
emission characteristic of direct-injection CI sitat Politécnica de Valéncia, 2009. [Online]. Avail-
engine fueled with n-butanol/diesel blends,” able: https://doi.org/10.4995/Thesis/10251/4923
Energy Procedia, vol. 160, pp. 364–371,
2019, 2nd International Conference on En- [22] R. Hernandez Sampieri, Metodología de la
ergy and Power, ICEP2018, 13–15 December investigación: las rutas cuantitativa, cualitativa
2018, Sydney, Australia. [Online]. Available: y mixta. McGraw-Hill Interamericana, 2018.
https://doi.org/10.1016/j.egypro.2019.02.169 [Online]. Available: https://bit.ly/2O8xoHE
[15] X. Wang, B. gang Sun, and Q. he Luo, [23] J. C. Rocha-Hoyos, L. E. Tipanluisa, V. D.
“Energy and exergy analysis of a turbocharged Zambrano, and A. A. Portilla, “Estudio de28 INGENIUS N.◦ 26, july-december of 2021
un motor a gasolina en condiciones de al- [30] Y. Guardia-Puebla, J. Márquez-Delgado,
tura con mezclas de aditivo orgánico en el V. Sánchez-Girón, E. A. Llanes-Cedeño, J. C.
combustible,” Información tecnológica, vol. 29, Rocha-Hoyos, and D. B. Peralta-Zurita, “Mejoras
pp. 325–334, 10 2018. [Online]. Available: http: a la asignatura diseño estadístico de experimentos
//dx.doi.org/10.4067/S0718-07642018000500325 para estudiantes de la carrera de Ingeniería
Mecánica,” Revista Espacios, vol. 39, no. 30, 2018.
[24] Q. he Luo and B. gang Sun, “Experiments on
[Online]. Available: https://bit.ly/3b5M5UK
the effect of engine speed, load, equivalence
ratio, spark timing and coolant temperature on
[31] A. Guzmán, E. Cueva, A. Peralvo, M. Revelo, and
the energy balance of a turbocharged hydrogen
A. Armas, “Estudio del rendimiento dinámico
engine,” Energy Conversion and Management,
de un motor Otto utilizando mezclas de dos
vol. 162, pp. 1–12, 2018. [Online]. Available:
tipos de gasolinas Extra y Súper,” Enfoque UTE,
https://doi.org/10.1016/j.enconman.2017.12.051
vol. 9, pp. 208–220, 12 2018. [Online]. Available:
[25] M. Krishnamoorthi and R. Malayalamurthi, https://doi.org/10.29019/enfoqueute.v9n4.335
“Availability analysis, performance, combustion
and emission behavior of bael oil - diesel - [32] A. I. Quimbita Panchi and E. X. Guallichico Sun-
diethyl ether blends in a variable compression tasig, “Determinación del potencial energético
ratio diesel engine,” Renewable Energy, vol. y mecánico del motor Mazda F2 al utilizar
119, pp. 235–252, 2018. [Online]. Available: los tipos de gasolina comercial empleados en
https://doi.org/10.1016/j.renene.2017.12.015 el Ecuador,” Master’s thesis, Universidad de
las Fuerzas Armadas – ESPE, 2017. [Online].
[26] V. Karthickeyan, “Effect of combustion cham-
Available: https://bit.ly/3kCcddd
ber bowl geometry modification on engine
performance, combustion and emission charac-
[33] E. V. Torres González, R. Lugo Leyte, H. D.
teristics of biodiesel fuelled diesel engine with
Lugo Méndez, L. E. Méndez Cruz, J. A.
its energy and exergy analysis,” Energy, vol.
González Andrade, and I. E. Hernández Mora,
176, pp. 830–852, 2019. [Online]. Available:
“Evaluación del desempeño de un motor de
https://doi.org/10.1016/j.energy.2019.04.012
gasolina mediante el análisis energético y
[27] C. H. Rufino, A. J. T. B. de Lima, A. P. exergético,” in Memorias del XXXVII En-
Mattos, F. U. M. Allah, J. L. L. Bernal, cuentro Nacional de la AMIDIQ, Jalisco,
J. V. Ferreira, and W. L. R. Gallo, “Exergetic México, 2016, pp. 49–54. [Online]. Available:
analysis of a spark ignition engine fuelled with https://bit.ly/2NU95NV
ethanol,” Energy Conversion and Management,
vol. 192, pp. 20–29, 2019. [Online]. Available: [34] O. Rosendo Llerena, “Análisis energético,
https://doi.org/10.1016/j.enconman.2019.04.035 exergético y económico de un sistema de
cogeneración: Caso para una planta azucar-
[28] INEN, “Vehículos automotores. Bus urbano.
era de San Pablo,” INGENIUS, no. 19,
Requisitos, NTE INEN 2 205:2010,” Instituto
pp. 29–39, 2018. [Online]. Available: https:
Ecuatoriano de Normalización, Norma Técnica
//doi.org/10.17163/ings.n19.2018.03
Ecuatoriana, Tech. Rep., 2010. [Online]. Available:
https://bit.ly/3bPTlU1
[35] A. Erazo, M. Ribeiro Batista, C. E. Tuna, C. L.
[29] V. Kolanjiappan, “Reduction of amine and Vorobieff, and J. Silveira, “Análisis energético,
biological antioxidants on NOx emissions powered exergético y ecológico aplicado en un motor de
by mango seed biodiesel,” Revista Facultad de combustión interna de pequeño porte accionado
Ingeniería Universidad de Antioquia, no. 84, con biogas,” in XI Latin-American Congress on
pp. 46–54, Sep. 2017. [Online]. Available: Electricity Generation and Transmission, 2015.
http://doi.org/10.17533/udea.redin.n84a06 [Online]. Available: https://bit.ly/3r6qMs0You can also read