Energy in 2020: the year of COVID - Spencer Dale Chief economist, bp 8 July 2021
←
→
Page content transcription
If your browser does not render page correctly, please read the page content below
Energy in 2020: the year of COVID
Spencer Dale
Chief economist, bp

8 July 2021
Introduction
This is the 70th anniversary of the bp Statistical Review – something we are incredibly proud of.

Since it was first published in 1952, the Statistical Review has provided a constant source of objective,
comprehensive – and, most importantly – trusted data to help industry, governments and
commentators make sense of developments in global energy markets.

Over those 70 years, the Statistical Review has borne witness to some of the most dramatic episodes
in the history of the global energy system:

   •     The Suez Canal crisis in 1956;

   •     The oil embargo of 1973, soon followed by the Iranian revolution in 1979;

   •     More recently, the Fukushima disaster in 2011.

All moments of great turmoil in global energy.

But all pale in comparison to the events of last year.

Most importantly, the pandemic that engulfed the world last year is a humanitarian tragedy.

As of last week, around 4 million people were reported to have died as a result of COVID-19.

The true number is likely to be far higher, and it continues to rise.

The pandemic also led to huge economic loss.

Global GDP is estimated to have fallen by over 3.5% last year – the largest peacetime recession since
the Great Depression.

The IMF estimate that around 100 million people have been pushed into poverty as a result of the
virus.

And the economic scarring from the pandemic – especially for the world’s poorest and least-developed
economies – is expected to persist for many years after the virus is brought under control.

Long COVID can take many different forms.

For the global energy system, the combination of the pandemic, together with efforts to mitigate its
impact, led to developments and outturns unmatched in modern peacetime.

For energy, 2020 was a year like no other.

Energy in 2020: the year of COVID                                                                   Page | 1
The aim for today is to use the new Statistical Review data to try to shed light on those developments.
I plan to focus the discussion on three questions.
• First, over the past year, we have been bombarded with daily headlines of unprecedented
developments and volatility.
Standing back from all the noise, what exactly happened last year in the world of energy and
how surprising was it?
• Second, the global pandemic was the mother of all stress tests.
Engineers will tell you that we can learn a lot from how systems behave under extreme
pressure.
In that spirit, what have we learnt from the response of the global energy system to the COVID-
19 crisis?
• And finally, this all took place against a backdrop of increasing societal and political demands
for an accelerated transition to a net zero energy system.
Indeed, Glasgow in Scotland was due to host COP 26 last year – arguably the most important
UN climate conference since Paris.
In the event, the conference had to be delayed until November 2021.
So, as we prepare for Glasgow, what lessons can we draw from the past year – and, more
generally, from the developments since Paris – for the challenges and opportunities for this
year’s COP?
Energy in 2020: what happened and how surprising was it?
Starting first with what actually happened last year and how surprising was it?
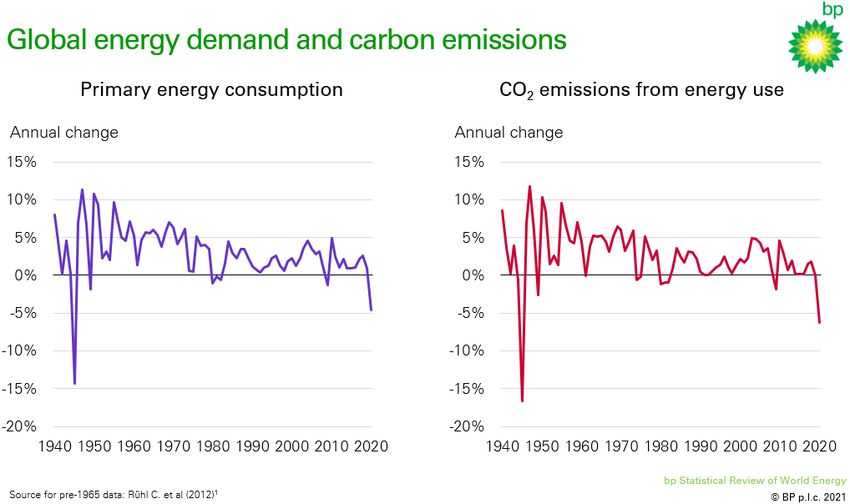
The headline numbers are dramatic: world energy demand is estimated to have fallen by 4.5% and
global carbon emissions from energy use by 6.3%.
Energy in 2020: the year of COVID Page | 2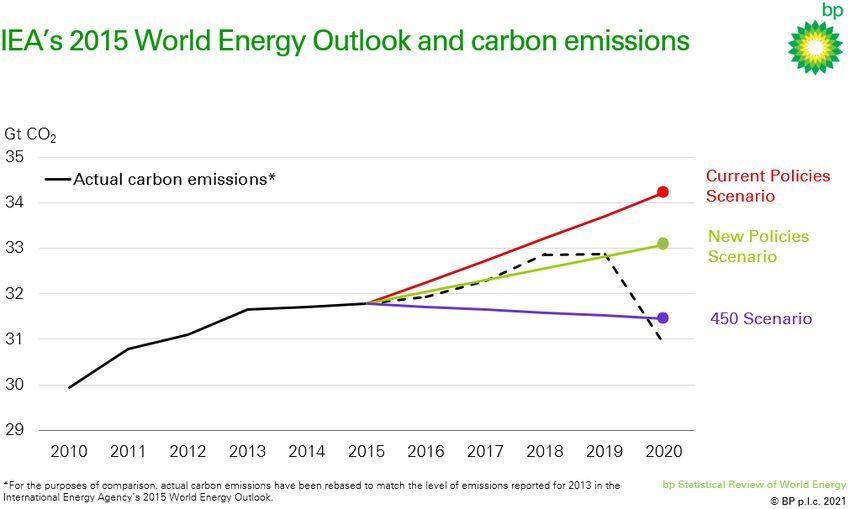
Chart 1

These falls are huge by historical standards – the largest falls in both energy demand and carbon
emissions since WWII.

Indeed, the fall of over 2 Gt of CO2 means that carbon emissions last year were back to levels last
seen in 2011.

It’s also striking that the carbon intensity of the energy mix – the average carbon emitted per unit of
energy used – fell by 1.8%, also one of the largest ever falls in post-war history.

How should we think about these reductions?

From a historical perspective, the falls in energy demand and carbon emissions are obviously
dramatic.

But from a forward-looking perspective, the rate of decline in carbon emissions observed last year is
similar to what the world needs to average each and every year for the next 30 years to be on track to
meet the Paris climate goals.

Put more concretely, if carbon emissions declined at the same average rate as last year for the next
30 years, global carbon emissions would decline by around 85% by 2050.

For those of you familiar with bp’s latest Energy Outlook, that is roughly mid-way between the Rapid
and Net Zero scenarios, which are broadly consistent with maintaining global temperature rises well
below 2oC and below 1.5oC respectively.

Last year’s fall in carbon emissions was obviously driven by the huge loss in economic output and
activity.

Energy in 2020: the year of COVID                                                                   Page | 3
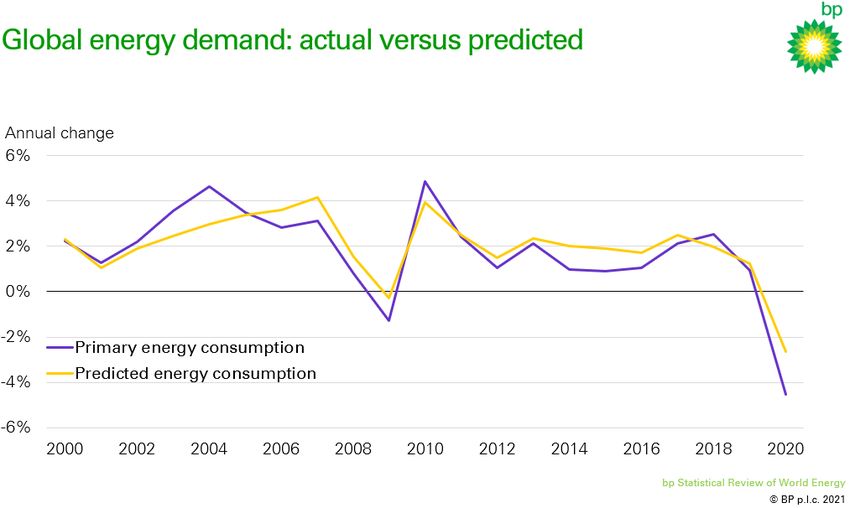
A simple calculation comparing the fall in emissions with the decline in world output equates to an
implied carbon price of almost $1400 per tonne.

Scarily high.

The challenge is to reduce emissions without causing massive disruption and damage to everyday
lives and livelihoods.

It’s interesting to ask how surprising the falls in energy demand and carbon emissions were last year.

Yes: they were the biggest falls seen for 75 years.

But they occurred against the backdrop of a global pandemic and the largest economic recession in
post-war history.

So how surprising were they given everything else that was going on?

The yellow ‘predicted’ line in Chart 2 is based on the same simple framework which we used in the
2019 Statistical Review to analyse movements in energy demand.

Chart 2

Energy in 2020: the year of COVID                                                                Page | 1
The framework uses GDP growth, changes in oil prices (as a proxy for energy prices), and the number
of unusually hot and cold days to predict the growth of energy demand at a country level and then
aggregates to global energy 1.

The neat thing about the framework is that, despite being embarrassingly simple, it can explain most
of the broad contours in energy demand over the past 20 years or so.

The key feature of last year’s fall in energy demand is that it was surprisingly big.

Even after controlling for the collapse in economic activity, the decline in energy demand was close to
twice the size of the ‘predicted’ fall: 4.5% compared with a predicted fall of around 2.5%.

The source of this surprise can be better understood by looking at the size of the falls in the different
components of energy demand.

Chart 3

Oil demand is estimated to have fallen by an unprecedented 9.3% (9.1 million barrels/day, or Mb/d) in
2020 – far bigger than anything seen in history and far bigger than the falls in the other demand
components.

1 The country-level model for China also includes a variable to capture the industrial composition of GDP growth. For more
details, see https://www.bp.com/content/dam/bp/business-sites/en/global/corporate/pdfs/energy-economics/statistical-
review/bp-stats-review-2019-full-report.pdf

Energy in 2020: the year of COVID                                                                                      Page | 2
Indeed, the fall in oil demand accounts for around three-quarters of the total decline in energy
consumption.

It’s also the key factor accounting for the near-record fall in the carbon intensity of the energy mix.

The yellow bars in Chart 4 use a similar modelling approach to derive predicted movements for each
of the demand components.

As you can see, the fall in oil consumption in 2020 was far bigger than expected based on past
relationships.

And the extent of that discrepancy was far greater than for any of the other demand components.

The decline in natural gas was pretty much bang-in-line with the model prediction and electricity
consumption actually fell by less than predicted.

Indeed, for those of you who like to think in statistical terms, the only statistically significant prediction
errors were those for total energy demand and oil demand.

And the surprise in total energy demand can be entirely explained by the greater-than-expected fall in
oil demand.

Chart 4

Of course, for all of us who experienced extended lockdowns last year, this is hardly surprising.

The lockdowns detracted from oil demand in a completely different way to a normal economic
downturn, crushing transport-related demand.

Energy in 2020: the year of COVID                                                                       Page | 3
Mobility metrics fell across the board.

Chart 5

Use of jet fuel and kerosene is estimated to have plunged by 40% (3.2 Mb/d) as aviation across much
of the world was grounded.

Similarly, gasoline demand fell by around 13% (3.1 Mb/d) as road mobility measures crashed.

In contrast, products most closely related to the petrochemicals sector (naphtha, ethane and LPG)
were broadly flat, supported in part by increasing demand for PPE and other medical- and hygiene-
related supplies.

In comparison, natural gas showed far greater resilience.

Energy in 2020: the year of COVID                                                              Page | 4
Chart 6

Gas demand is estimated to have fallen by 2.3% (81 bcm) in 2020, a broadly similar decline to that
seen in 2009 in the aftermath of the financial crisis.

Consumption fell in most regions, with the notable exception of China, where gas demand grew by
almost 7%.

The relative immunity of natural gas was helped by sharp falls in gas prices, which allowed gas
generation to gain share in the US power market and hold its own in the EU.

Chart 7

Energy in 2020: the year of COVID                                                                 Page | 5
Electricity consumption is estimated to have experienced the smallest fall across the main
components of final energy demand, declining by just 0.9% in 2020.

The relative resilience of electricity usage was aided by the nature of the lockdowns, with falling power
demand in industry and commercial buildings partially offset by increased domestic use by home-
based workers and locked-down families.

The relative resilience of overall power generation disguises a more significant shift in the generation
mix.

In particular, despite the fall in overall power demand, generation from renewables (wind, solar,
bioenergy and geothermal energy, and excluding hydroelectricity) recorded its largest ever increase
(358 TWh)

This growth was driven by strong increases in both wind (173 TWh) and solar (148 TWh) generation.

Chart 8

Encouragingly, the share of renewables in global generation recorded its fastest ever increase.

That continues the strong growth seen in recent years.

Over the past five years, renewable generation has accounted for around 60% of the growth in global
power generation, with wind and solar power more than doubling.

The growth in renewables last year came largely at the expense of coal-fired generation, which
experienced one of its largest declines on record (405 TWh, 4.4%).

Energy in 2020: the year of COVID                                                                   Page | 6
In addition to falling power demand and increasing deployment of renewables, coal was also hurt by a
loss of competitiveness relative to natural gas, especially in the US and EU.

These trends are exactly what the world needs to see as it transitions to net zero: strong growth in
renewable generation crowding out coal.

That said, the ‘more than doubling’ in wind and solar generation over the past five years hasn’t made
even the smallest dent in total coal generation.

The level of coal generation in 2020 was essentially unchanged from its level in 2015 as last year’s fall
simply offset increases from the previous few years.

It will take more than just strong growth in renewable energy to remove coal from the global power
sector, especially at the pace it needs to happen.

As highlighted by Chart 8, there is still a long way to go to squeeze coal out of the power sector.

In the developed world, there needs to be greater progress on energy efficiency.

And, as we highlighted in the 2020 Energy Outlook, for many emerging market economies to make
significant inroads into the role of coal while still ensuring improving energy access, they will likely
need to see an expansion in natural gas alongside renewable energy over the next 15-20 years.

Finally, in terms of this section, how ‘surprising’ was last year’s fall in carbon emissions?

Or put differently, what message should we take from this fall for future carbon trends?

Is this the beginning of the much hoped-for downward trend in emissions or just a temporary COVID-
induced dip?

Energy in 2020: the year of COVID                                                                     Page | 7
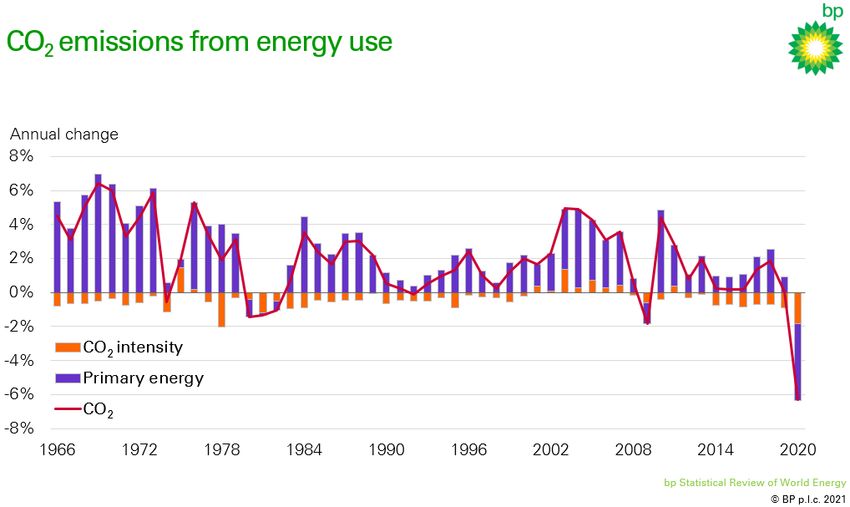
Chart 9

The two elements combining to produce the near-record decline in carbon emissions – the falls in
energy demand and in the carbon intensity of the energy mix – can both be largely traced back to the
unprecedented decline in oil demand triggered by the lockdowns.

This suggests that as lockdowns around the world are eased and economic activity begins to recover,
there is a significant risk that last year’s fall in carbon emissions will be reversed.

Indeed, the IEA recently estimated that the level of carbon emissions last December was already back
above pre-crisis levels.

What can we learn from the COVID-induced stress test?
Moving to the second question for today: what can we learn from the behaviour of the energy system
in response to the extreme stress test induced by the pandemic?

The focus here is on the supply response: how did different parts of the energy industry react to the
sudden, unexpected fall in demand?

As I have already mentioned, it’s striking that the relentless expansion of renewable energy was
relatively unscathed by the pandemic.

Impressive resilience.

And I will say more about the good news story which is renewables later.

Energy in 2020: the year of COVID                                                                  Page | 8
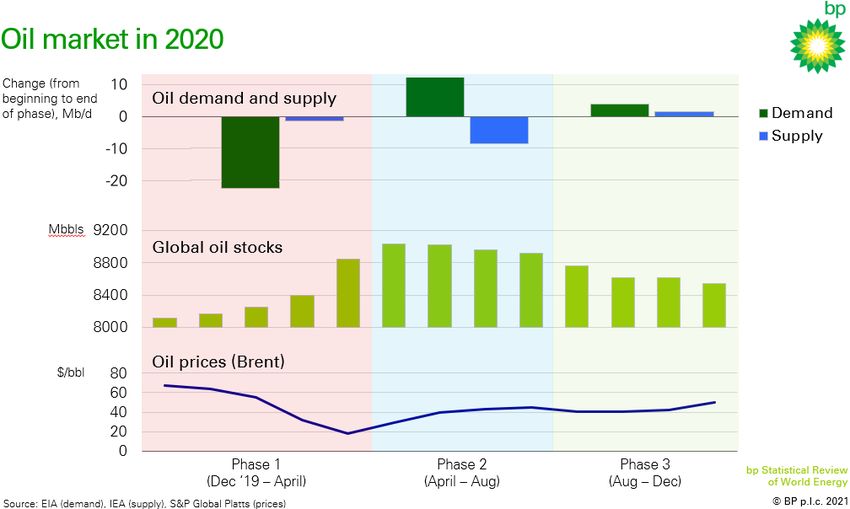
For now, I am going to concentrate on oil and natural gas markets which were affected more severely
by the events of last year.

Moreover, oil and natural gas markets could become increasingly challenged as the energy transition
gathers pace.

So, it’s interesting to ask whether we can learn anything about their future behaviour from their
response to the stresses of last year?

Starting first with oil.

Over the year as a whole, global oil production is estimated to have fallen by 6.6 Mb/d – again the
largest fall in post-war history.

To get a sense of the timing and composition of that supply response it is helpful to split the year into
three phases.

Phase 1 covers the onset of the global pandemic from December 2019 to April 2020.

This is the period in which global oil consumption literally collapsed, with demand reaching a trough in
April of more than 20 Mb/d below pre-COVID-19 levels.

Off the charts relative to anything seen in history.

The initial supply response was totally underwhelming.

In fact, it was counterproductive.

The obvious source of supply that could react quickly was OPEC.

But as you know, the key OPEC+ meeting in early March ended in disagreement, with supply actually
increasing for a period as a brief price war broke out.

Energy in 2020: the year of COVID                                                                   Page | 9
Chart 10

Oil inventories accumulated at a record pace, increasing by around 750 million barrels in just four
months.

That scale of imbalance is unheard of and generated severe logistical issues, in terms of both the
availability of storage and the ability of excess supplies to access storage sufficiently quickly.

Prices responded accordingly.

Brent reached a low of below $20/bbl in April.

And oil markets made frontpage news as US WTI prices turned negative for the first time ever.

The second phase, from April to August, saw a significant supply response.

The main supply reaction came from OPEC+, who agreed to cut oil production by 9.7 Mb/d between
May and June, later extended to July.

US tight oil also responded, with production falling by around 2 Mb/d between March and May.

The responsiveness of tight oil is typically framed in terms of the rapid decline rates in tight oil basins
combined with the speed with which new investment can be halted.

But the pace of response seen in the US last spring was far quicker than natural decline, and was
largely driven by producing wells being shut-in, due to a combination of logistics and economics.

The falls in US tight oil were compounded by falls in conventional supplies.

Energy in 2020: the year of COVID                                                                    Page | 10
All told, North American production fell by around 4 Mb/d between March and May – roughly twice that
of Russia.

At the same time, demand partially recovered as lockdowns were eased, initially in Asia and
increasingly in the US and Europe.

This resulted in a convergence of production and consumption levels, with inventories broadly stable
at their new elevated level.

The third and final phase, from August through to the end of the year, was one of gradual adjustment.

Demand continued to edge up, although second waves of COVID-19 spreading across different
regions slowed the pace of recovery.

Some of the supply response, from both OPEC+ and US tight oil, was partially unwound.

But continuing OPEC+ constraint and compliance meant the market moved into deficit and stocks
began to normalize.

By the end of the year, around half of the excess stocks accumulated during the first part of the year
had been unwound.

And prices had recovered to around $50/bbl.

What lessons can we draw from this real-world stress test of global oil markets?

For me, the main lesson was OPEC+ was both able and willing to step in and stabilise oil markets.

But whether this means it will always be able to do so, depends on the type of shock affecting oil
markets.

The nature of OPEC’s power to shift supply intertemporally from one period to another means it has
the ability to offset temporary, short-lived shocks.

Indeed, in response to an economics exam question of what type of demand shock is OPEC best able
to stabilise – a global pandemic followed by a successful vaccine would be close to the perfect
answer.

Relatively short-lived, temporary shocks.

Which is what makes the initial failure of OPEC to reach agreement in March 2020 all the more
surprising.

Energy in 2020: the year of COVID                                                                 Page | 11
In contrast, the ability – and incentive – for OPEC to offset a sustained and growing fall in oil demand
as the world transitions to net zero is less clear.

In this case, there may be a greater incentive for individual OPEC members to worry more about
protecting and growing their market shares and less about stabilising markets.

Turning to natural gas markets. I want to focus here on the European gas market, both because it’s
the largest market in which there is active gas-on-gas competition; and because of the key role it plays
as the balancing market for LNG cargoes.

So, what can we learn from its behaviour in response to the stress caused by the pandemic, with
European gas imports falling by over 8 ½ % last year?

The gas-on-gas competition in Europe takes the form of pipeline imports – predominantly from Russia
– competing against LNG imports – largely from the US as the marginal source of LNG.

As LNG imports have increased in recent years it has raised the question of the extent to which
Russia and other pipeline gas exporters will compete against LNG to maintain their market share or
instead forgo some of that share to avoid driving prices too low.

This issue could become more acute in a transition, in which Europe moves away from natural gas
and competition between different gas supplies intensifies.

Although there is lots of complicating detail, it appears that Russian exporters were prepared to forgo
some market share last year.

Chart 11

Pipeline imports from Russia as a share of European gas demand fell from 35% in 2019 to 31% in
2020, with much of the reduction happening in the first half of last year.

Energy in 2020: the year of COVID                                                                 Page | 12
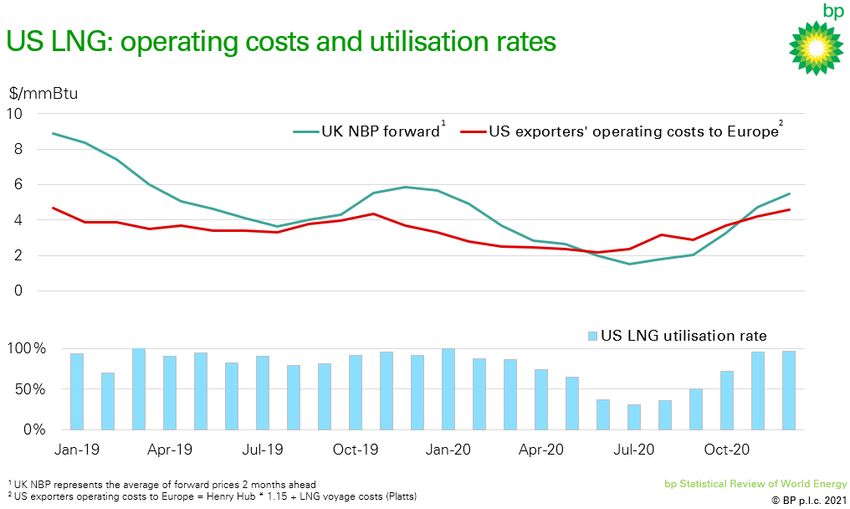
Some of that reduction initially reflected the record storage levels which had been built up towards the
end of 2019.

But Russian volumes remained low through the second quarter when the impact of the pandemic on
European gas demand was at its height.

In contrast, LNG imports were up year-on-year in the first half of 2020 and their share of European
demand for the year as a whole was broadly unchanged at 21%.

However, as to whether this provides a guide to the future behaviour of Russian pipeline exports is
less clear.

The argument here is similar to the point we just discussed in the context of OPEC.

In response to a fall in demand that is expected to be relatively short-lived, it may be entirely rational
for pipeline exporters to use their flexibility to reduce supply temporarily to help stabilise the market
and support prices.

But the possible response to a sustained and growing contraction in gas imports as Europe transitions
away from fossil fuels could be very different, with a stronger incentive for Russian pipeline exporters
to compete to be the last producer standing.

One of the factors affecting the response of pipeline exporters last year was their perception of how
low European prices would need to fall to shut-in LNG exports.

Which takes us to the second aspect I mentioned, Europe as the balancing market for LNG flows.

Until last year, this question of the shut-in price for LNG exports was largely hypothetical – shut ins
had never really occurred at scale.

That all changed last year.

Chart 12 (next page) shows a highly simplified view of US LNG exporters’ short-run operating costs.

As European LNG forward prices fell below these operating costs, this triggered a significant shut in of
US LNG exports.

Average utilization rates of US LNG facilities began to fall in April last year, reaching a low of around
30-35% at the height of the summer.

US LNG exports still increased by around 30% in 2020 helped by three new LNG trains coming on
stream and several others ramping up.

Energy in 2020: the year of COVID                                                                    Page | 13
But had it not been for the cancelling of cargoes, the growth in US exports would have been closer to
80%.

Chart 12

Progress since Paris – how is the world doing?
Finally for today, with the build-up to the Glasgow COP gathering pace, I want to spend a few minutes
putting last year’s developments into the broader context of progress made since the Paris COP in
2015.

The goals agreed at Paris are widely seen as a watershed in terms of achieving global alignment on
ambitions for limiting temperature rises and all countries agreeing to make their contribution to
achieving those aims.

So almost six years on from Paris, how is the world doing?

One of the biggest changes since 2015 is the marked increase in focus and ambition on getting to net
zero.

At the time of the Paris convention, no major country had made a formal commitment to achieve net
zero.

That accolade went to Sweden, who in June 2017, pledged to reach carbon neutrality by 2045.

Chart 13

Energy in 2020: the year of COVID                                                                   Page | 14
Fast-forward to today, ten countries together with the European Union have passed net zero targets
into law and a further 34 countries have either proposed legislation or outlined formal policy intentions
with the same intent.

The IEA recently estimated that together these commitments and intentions account for around 70%
of global carbon emissions2.

Although still early days, there are encouraging signs that the collective jolt and huge costs of COVID
may have led to renewed determination to prevent an even-more damaging global trauma in the form
of climate change.

That rising level of ambition is also evident at the corporate level. On last count, the number of
companies with stated aims or ambitions to get to net zero had increased more than six-fold since
2019 to more than 3000 companies.

This rise in corporate ambition has coincided with growing societal expectations for companies to both
increase further their transparency about climate-related risks and demonstrate their strategies and
actions are consistent with Paris.

Inflows into ESG-related funds have increased from less than $30 billion in 2015 to over $330 billion in
2020 – an 11-fold increase in just five-years.

2https://iea.blob.core.windows.net/assets/20959e2e-7ab8-4f2a-b1c6-4e63387f03a1/NetZeroby2050-
ARoadmapfortheGlobalEnergySector_CORR.pdf (page 33)

Energy in 2020: the year of COVID                                                                    Page | 15
The world of investing seems to have changed for good – in both senses of the word.

Although these developments are hugely encouraging, they come with two major caveats.

First, countries’ pledges still don’t go far enough.

Despite the substantial increase in net zero aims and intentions at national and regional levels, the UN
NDC Synthesis Report, published last December, concluded that ‘the current levels of climate
ambition are not on track to meet our Paris Agreement goals’ 3.

Second, there is a mismatch between these ambitions and the outcomes the world needs and wants
to see.

The Paris agreement was met with huge hope and optimism, but that hasn’t yet been reflected in a
marked improvement in the actual emissions data.

Chart 14 is based on the IEA’s World Energy Outlook (WEO) published in November 2015, just prior
to the Paris COP.

Chart 14

The 2015 WEO contained three scenarios for carbon emissions based on different assumptions about
the future setting of global energy policies: a continuation of current policies (in red); the

3   Additional targets have been announced since December and the UN will publish an updated report prior to COP 26.

Energy in 2020: the year of COVID                                                                                      Page | 16
implementation of declared policy intentions (in green); and a set of policies consistent with limiting
global temperature increases to 2oC (in purple).

Until last year, carbon emissions had continued their unrelenting rise, broadly in line with the policy
intentions that had been declared prior to the Paris meeting.

Importantly, there was no sign of the decisive shift envisaged by the ‘less than 2oC’ purple scenario.

The COVID-induced fall in carbon emissions last year put emissions closer to the 2-degree pathway,
but as discussed earlier, there is a good chance that much of that dip proves transitory.

Hope and ambition need to be translated into tangible, concrete differences.

Although much of the attention of the Paris Agreement is on the response to climate change, the
Agreement stipulates that this response should be in ‘the context of sustainable development and
efforts to eradicate poverty’4.

The UN Sustainable Development Goals for 2030 (UN SDGs), which were adopted around the same
time as the Paris COP, provide a natural benchmark for monitoring progress on this aspect of the
Paris Agreement.

There are several strong inter-connections between these goals and the energy system, including on
conservation and biodiversity, both on land (SDG 15) and in our oceans (SDG 14).

But perhaps the closest to home is SDG 7: ‘ensure access to affordable, reliable, sustainable and
modern energy for all’.

The good news is that there have been significant improvements in energy access over the past six
years.

The number of people without access to electricity has fallen from close to 1 billion in 2015, to a little
over 750 million by 2019.

Around 10% of the world’s population, down from 15% in 2015.

Encouraging progress.

However, just as with emissions, the progress comes with caveats.

4   https://unfccc.int/sites/default/files/english_paris_agreement.pdf

Energy in 2020: the year of COVID                                                                   Page | 17
The improvements have been uneven, with three-quarters of the global population without access to
electricity situated in sub-Saharan Africa.

Chart 15

Moreover, the impact of COVID has reversed some of that progress.

The World Bank estimate that the pandemic has made basic electricity services unaffordable for 30
million more people, the first time the number of people without access to electricity has increased for
six years.

And access to clean cooking facilities – the other focus of SDG 7 - lags far behind with around 2.6
billion people estimated not to have access.

Moreover, the concept of ‘energy access’ is somewhat nebulous.

The UN defines access to electricity in terms of a minimum level of residential consumption.

But the level of energy needed to support strong, sustainable economic growth is likely to far exceed
that.

Energy is vital for productive uses as well as household consumption.

Energy in 2020: the year of COVID                                                                Page | 18
For example, the Energy for Growth Hub propose a Modern Energy Minimum of 1000 kWh per person
per year, which they argue is consistent with countries reaching a lower-middle income status5.

This is around four times greater than the UN definition.

Importantly, the Energy for Growth Hub estimates that more than 3.5 billion people – close to half the
world’s population – are living below the Modern Energy Minimum.

Half the world’s population.

So, lots more to do in terms of energy access.

Arguably, the single most important element of the energy system needed to address both aspects of
the Paris Agreement – respond to the threat of climate change and support sustainable growth – is the
need for rapid growth in renewable energy.

I am pleased to say that the progress on renewable energy over the past five or six years has been a
perfect example of that tangible, concrete progress I mentioned.

If we start with what happened last year, focussing on wind and solar energy which is where most of
the action is.

Despite the huge disruptions associated with the global pandemic and the collapse in GDP, wind and
solar capacity increased by a colossal 238 GW in 2020 – 50% larger than at any time in history.

5   https://www.energyforgrowth.org/projects/modern-energy-minimum/

Energy in 2020: the year of COVID                                                                 Page | 19
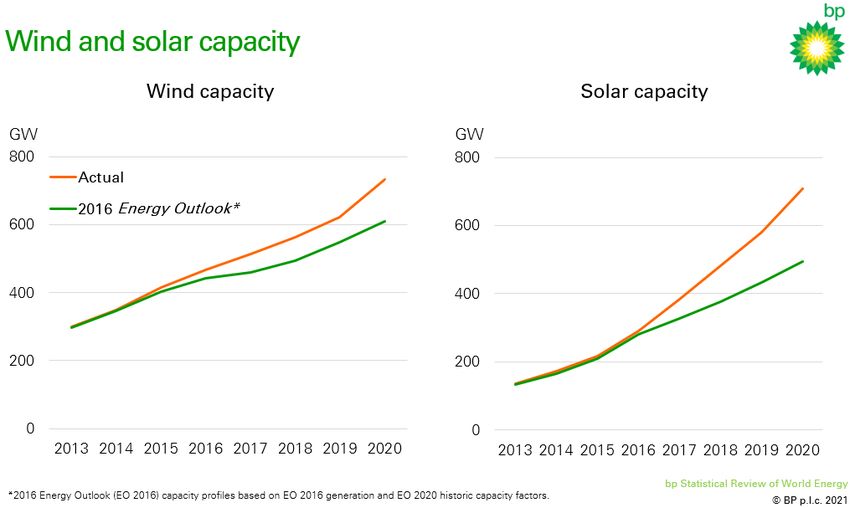
Chart 16

The main driver was China, which accounted for roughly half of the global increase in wind and solar
capacity.

The expansion in Chinese wind capacity (72 GW) is particularly striking and it’s likely that some of the
reported increase reflects various changes to Chinese subsidy and accounting practices.

But even controlling for that, it seems clear that 2020 was a record year for the build-out of wind and
solar capacity.

Viewed over a slightly longer period, wind and solar capacity more than doubled between 2015 and
2020, increasing by around 800 GW, which equates to an average annual increase of 18%.

To put that in context, in bp’s Rapid and Net Zero scenarios, wind and solar capacity increase at an
average annual rate of around 14% and 18% respectively over the next 10 years.

So, the current pace of growth is broadly on track with those scenarios.

The challenge is to maintain the recent pace of growth as the overall size of renewable energy
expands. In that context, what has underpinned the strong growth over the past five years?

Along with many other forecasters, we materially underestimated the growth of wind and solar power
over the past five years.

Energy in 2020: the year of COVID                                                                 Page | 20
Chart 17

Chart 17 compares the profiles for installed capacity of wind and solar power in bp’s 2016 Energy
Outlook with the actual outturns. A key factor underpinning this under-estimation is that costs of
renewable energy have fallen by far more than we projected in 2016.

The costs of onshore wind and solar power have fallen by around 40% and 55% respectively over the
past five years6. Far more than the 15% and 20% assumed in the 2016 Outlook.

Although it’s a gross simplification, cost reductions for renewables are often summarized in terms of a
‘learning-by-doing’ framework.

As ever-increasing amounts of renewable capacity are produced and installed, the supply chain learns
how to become more and more efficient, driving costs progressively lower.

Viewed in this way, renewable costs can fall by more than expected, either because the build out of
renewables is greater – hence allowing for ‘more learning’ – or because costs fall by more for a given
level of build-out – ‘faster learning’.

6   Costs based on LCOE (levelized cost of electricity) averaged across three major demand centres (US, China and Europe).

Energy in 2020: the year of COVID                                                                                     Page | 21
Chart 18

As shown in chart 18, the biggest factor accounting for the larger-than-expected falls in renewables
costs is ‘faster learning’ – which explains around three-quarters of the error on wind costs and two-
thirds for solar costs.

Interestingly, the majority of the ‘more learning’ contributions for both wind and solar over the past 5
years stem from China, as renewables have gained share from coal more quickly than expected.

This transition has gone hand-in-hand with a massive scaling up of China’s renewable manufacturing
capacity, which has helped reduce the cost of wind and solar power around the world.

So, an upbeat message on renewables.

But it’s important to remember that this pace of progress on renewable energy needs to be matched
by the many other dimensions of the energy transition: energy efficiency; the growth of new energy
vectors, such as hydrogen, to help decarbonize hard-to-abate sectors; and the build-out of carbon
capture use and storage (CCUS).

Continued rapid growth in renewable energy is necessary to get to net zero, but it’s not sufficient.

Conclusion
70th birthdays are important milestones, providing an opportunity to reflect on the events that have
shaped your life.

There have certainly been many, many changes in global energy markets since the Statistical Review
was first conceived in 1952.

Energy in 2020: the year of COVID                                                                  Page | 22
But as my mother-in-law said to me recently, even at 70 you can still be surprised.

And for the Statistical Review – like so many of us – 2020 will go down as one of the most surprising
and most dramatic years in its life.

With the largest declines in energy demand and carbon emissions seen in modern peacetime.

But the importance of the past 70 years pales into insignificance as we consider the challenges facing
the energy system over the next 10, 20, 30 years as the world strives to get to net zero.

Will 2020 be seen as a turning point when the shock of COVID-19 finally caused the world to take
decisive action to mitigate the threat of climate change?

Will the good intentions and increased ambitions of the past few years be translated into a sharp and
sustained fall in emissions?

Will renewable energy be able to maintain the rapid rates of growth seen over the past five-years?

And how important will the private sector – in the form of green and greening companies, prompted
and supported by growing societal expectations – be in the eventual success or otherwise of the
energy transition?

If 70th birthdays are important, 100-year anniversaries are really special.

What events will the 100-year-old Statistical Review report as it analyses energy developments in
2050?

Energy in 2020: the year of COVID                                                              Page | 23
You can also read