Contagious Protests - Belfer Center
←
→
Page content transcription
If your browser does not render page correctly, please read the page content below
WO RKING PAP ER
belfercenter.org/MEI
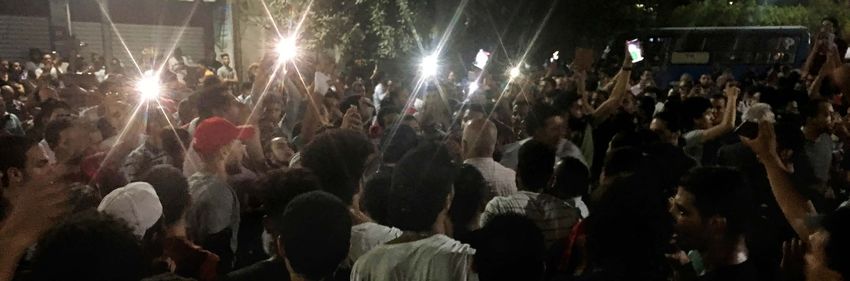
AP Photo/Nariman El-Mofty
M I D D L E E A S T I N I T I AT I V E | F E B R U A R Y 2 0 2 1
Contagious Protests
Rabah Arezki, Alou Adessé Dama, Simeon Djankov, and Ha Nguyen
Abstract
This paper explores the spillover of protests across countries using data on nonviolent and
spontaneous demonstrations for 200 countries from 2000 to 2020. Using an autoregressive spatial
model, the analysis finds strong evidence of “contagious protests,” with a catalyzing role of social
media. In particular, social media penetration in the source and destination of protests leads to
protest spillovers between countries. There is evidence of parallel learning between streets of
nations alongside the already documented learning between governments.
Keywords: street protest; contagion; social media.
JEL Codes: C21, D74, D8, E71.
Contagious Protests | Belfer Center for Science and International Affairs | February 2021 1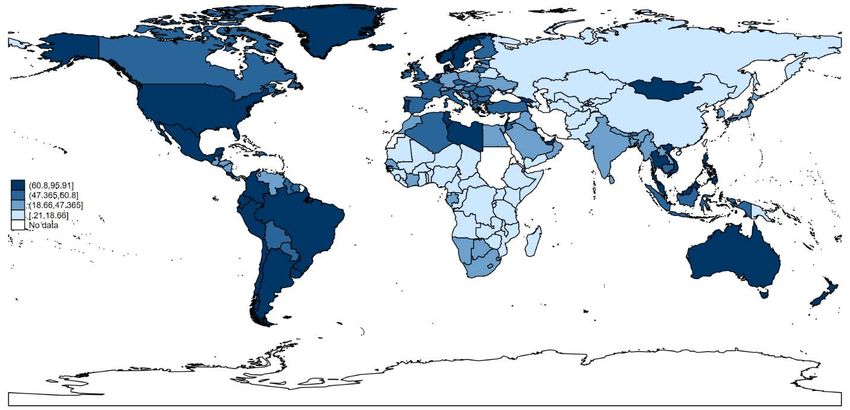
1. Introduction
History provides examples of media incentivizing street protests, which spread across borders.
The popular discontent that ended communism in Eastern Europe began in Poland in the early
1980s, and swept through Hungary, East Germany, Bulgaria, Czechoslovakia, and Romania. Radio
Free Europe played a critical role as a vehicle for the spread of the information about protests and
catalyzed its spillovers across borders (Puddington 2000), as did a network of radio stations of the
Catholic Church (Stehle 1982). Fast forward 30 years to the wave of street protests that sparked the
Arab Spring in 2011 following the death of a Tunisian street vendor who set himself ablaze—after
having been harassed and humiliated by municipal officials. These protests established social
media as the new conduit for the spread of protests. In 2019, a second wave of protests that started
in Sudan and Algeria spread to other Arab countries, including the Arab Republic of Egypt, Lebanon
and Iraq, eventually resulting in a global contagion of protests spanning from Chile to the Russian
Federation to Hong Kong SAR, China. Just as the global pandemic put a damper on street protests,
the death of George Floyd in US police custody powered a global protest movement against police
brutality and racial injustice. Again, social media was the main channel of protest engagement.

In this paper we systematically explore spillovers of spontaneous street protests across countries,
with social media acting as the catalyst. We use data on nonviolent and unorganized demonstra-
tions for 200 countries for the period 2000 to 2020. Using an autoregressive spatial model, we find
strong evidence for contagious protests with a catalyzing role of social media. Social media penetra-
tion in the source and destination of protests leads to protest spillovers between countries. There
is evidence for parallel learning between streets of nations alongside the previously documented
learning between governments.

Our research is related to three strands of previous work. First, our paper is related to the emerging
literature on social media and protests. Battaglini (2017) argues that protests are a way to signal
private information to policy makers, in which social media is a good medium for policy makers
to aggregate information. A field experiment in Hong Kong SAR shows that one’s turnout decision
depends on others’ turnout decisions (Cantoni et al, 2019). Broadband internet is shown to be pos-
itively associated with local online grassroots protest movements in Italy (Campante et al, 2018).
The diffusion of VK, Russia’s dominant online social network, increased protest turnout in Russia
(Enikolopov et al, forthcoming). Where internet coverage is low, such as in Africa, mobile phones’
diffusion increased protest turnout (Manacorda and Tesei, 2020).

Our paper is also related to the literature on learning and networks. Buera et al. (2011) study how
countries learn from the successes of neighbors’ past economic policies. Chen and Suen (2016)

                    Contagious Protests | Belfer Center for Science and International Affairs   |   February 2021   2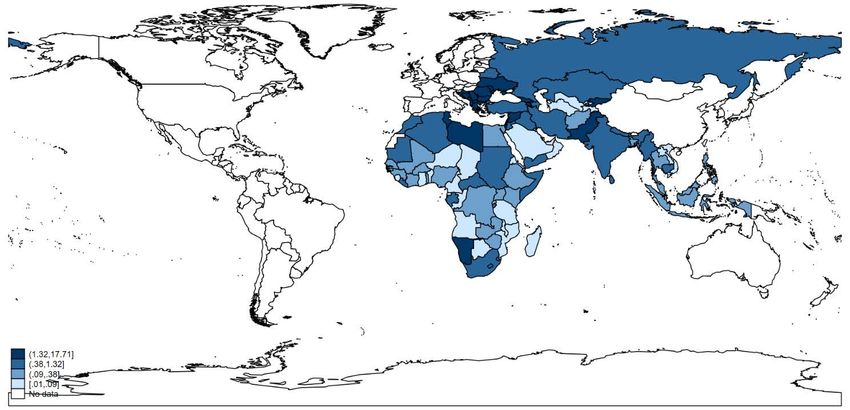
theorize that a successful revolution could dramatically lead to revisions in beliefs of both protest-
ers and governments and hence may lead to a series of revolutions in other countries. König et al.
(2017) examine how networks (of military alliances and enmities) affect the intensity of the conflict
in the Democratic Republic of Congo. Harari and Ferrara (2018) examine how local conflicts in one
gridded cell in Africa spill over to neighboring cells.

A strand of the literature studies spillovers from protests. Several papers have documented that
protests in Tunisia and Egypt have inspired protesters elsewhere (Bamert et al, 2015; Hale, 2013;
Lynch, 2013; Saideman, 2012). Similar spillovers were observed from other revolutionary periods,
such as the Eastern European democratization in the 1990s and the revolutionary wave of 1848 in
Europe (Hale, 2013; Weyland, 2010, 2012).

The remainder of the paper is organized as follows. Section II presents the data and the empirical
strategy. Section III shows the results. Section IV presents robustness checks. Section V concludes.

2. Data and Empirical Strategy
Data on protests are from the Armed Conflict Location & Event Data (ACLED) Project. Protests
are defined in the data set as “non-violent demonstrations, involving typically unorganized action
by members of society.” This category covers peaceful protests, protests with interventions (e.g.
arrests), and protests in which excessive force was used against protesters (e.g. causing injuries and
deaths). Note that this definition does not include violent demonstrations and mob violence. The
data coverage starts in 1997 but is severely imbalanced, rendering difficult the use of earlier years
to conduct the spatial analysis. We aggregate the number of protests at the monthly (and quarterly)
level.

Figure 1 shows the evolution of the number of protests at a monthly frequency as recorded by
ACLED—in absolute number (Panel A) and in per million capita (Panel B). Note that starting in
2010 and subsequent years more countries were added to the data set—see Panel A of Appendix
Table A1 for the list of countries included in the data set. That explains the big jump in the series in
the year 2010. We hence restrict our sample to start in January 2010 when using the ACLED data
set.1

1   Note that for countries added to the data set after 2010, we consider these country-year pairs as missing observations (and
    not zeros) before they are added to the data set. However, our results remain robust when using data from ACLED starting in
    January 1997.

                         Contagious Protests | Belfer Center for Science and International Affairs   |   February 2021            3
Figure 1: Evolution of the Total Number of Protests

Panel A: Protests in levels
                                     1.2
   Monthly number of protests (per million persons)
                                     1
                                     .8
                                     .6
                                     .4
                                     .2
                                     0

                                                      1995m1          2000m1            2005m1              2010m1           2015m1             2020m1
                                                        Sources: Authors' calculation using ACLED dataset

Panel B: Protests in per capita
                                  6000
 Monthly number of protests
   2000            4000           0

                                                      1995m1          2000m1             2005m1             2010m1           2015m1             2020m1
                                                        Sources: Authors' calculation using ACLED dataset

                                                                            Contagious Protests | Belfer Center for Science and International Affairs   |   February 2021   4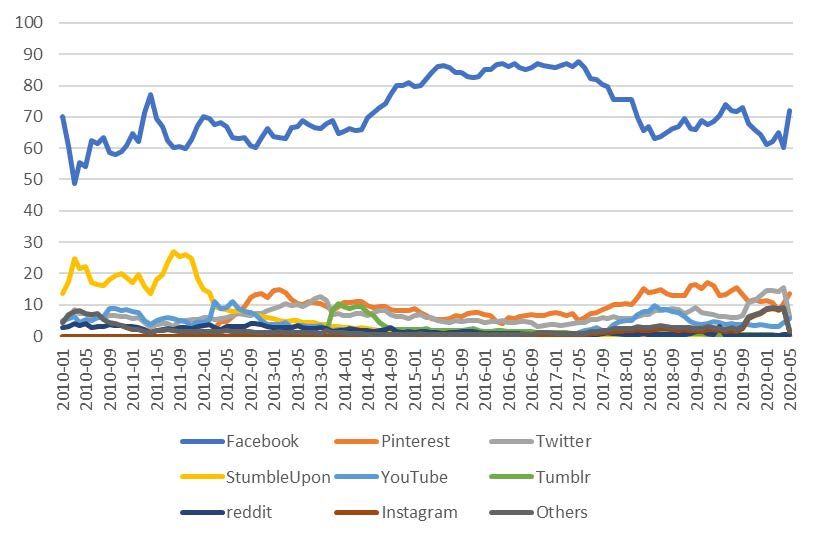
For the sample starting in January 2010 to January 2020, the average number of protests per month per
country is 21. In 34 percent of country-month pairs (2,910 of 8,549), there is no occurrence of protest.
Panel A of Appendix Figure A1 presents the histogram of the entire distribution of available occurrence
of protests from ACLED (Appendix Table A2 for summary statistics of actual protests). The distribution
supports the use of the Zero-Inflated Poisson estimator, which we discuss in the next section.

We construct an alternative measure of protests capturing the intensity of media chatter around
protests. The rationale for the news-based measure of protests is first and foremost that it allows to
significantly expand the scope of the data on protests over space and time. This measure accounts
for the saliency of specific protests. For instance, a protest sparked by a popular figure is likely
reported and discussed more extensively in the news media. The news data are from Dow Jones
FACTIVA, which is a global repository of over one billion articles published across the world and
reported in 28 different languages. For each language, the following words are translated: (i) “street”
and (ii) “protests” or “protest”. The search for each language is constructed such that the word
“street” and at least one relating to “protest” appear. For example, in English, the precise search
query is: [(“street”) AND (“protest” OR “protests”)].

This search is performed for all countries and all languages in the Dow Jones database, over the
period from January 1, 2000 to December 31, 2019. In addition, we gather the number of total arti-
cles in the Dow Jones FACTIVA for each country and each month. A measure of normalized article
counts is then constructed by taking the ratio between the number of articles mentioning “street
protests” and the total number of articles for each country-month pair multiplied by 100. Formally,
for country i in month t the intensity of media chatter around protests is as follows:

The news-based protest data provide us with a balanced panel for 207 countries from January 1,
2000 to December 19, 2019 (see Panel B of Appendix Table A1 for the list of countries). The cover-
age is more comprehensive than for ACLED and allows us to exploit time and space variation. Panel
B of Appendix Figure A1 presents the histogram of the entire distribution of news-based protests. In
33.4 percent of country-month pairs (16,568 of 49,678), there is zero news about protest (Appendix
Table A2 for summary statistics). The distribution is also skewed toward zero, which supports the
use of the Zero-Inflated Poisson estimator.

                     Contagious Protests | Belfer Center for Science and International Affairs   |   February 2021   5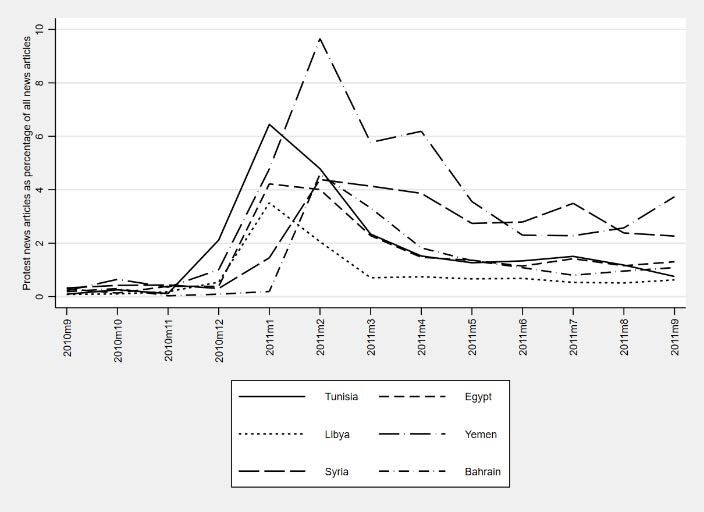
The evolution of the measure is presented in Figure 2 in monthly frequency (Panel A). We also
illustrate the evolution of the measure for countries in the Middle East and North Africa (Panel B).
Both panels show a clear uptick in the chatter about protests around the Arab Spring in 2011 and
the second wave of protests that started in 2019. The uptick in Panel A around 2003 reflects global
protests against the war in Iraq.

Figure 2: News-Based Measure of Street Protests

Panel A. Global Perspective

Panel B: Middle East and North Africa countries

Sources: Dow Jones FACTIVA and authors’ own calculations.

Note: Middle East and North Africa region includes Algeria, Bahrain, Djibouti, the Arab Republic of Egypt, the Islamic Republic
of Iran, Iraq, Jordan, Kuwait, Lebanon, Libya, Morocco, Oman, Qatar, Saudi Arabia, the Syrian Arab Republic, Tunisia, United Arab
Emirates, West Bank and Gaza, and the Republic of Yemen.

                          Contagious Protests | Belfer Center for Science and International Affairs   |   February 2021             6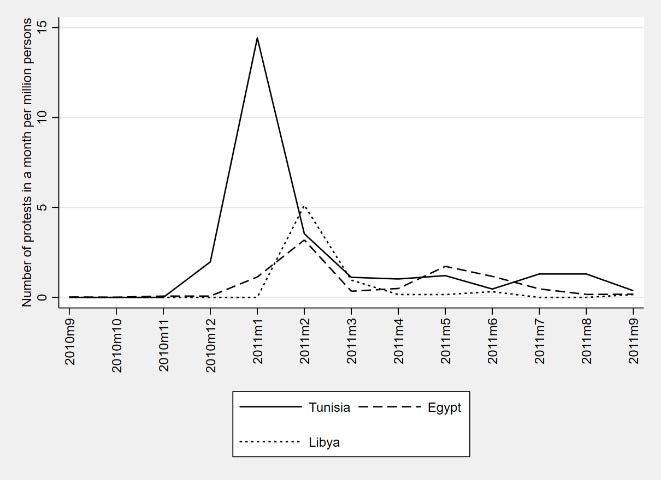
We next compare the ACLED account of actual protests (Panel A in Figure 3) with our alternative
source of protests based on news (Panel B in Figure 3) around the time of the Arab Spring. Panel A
in Figure 3 shows a spike in the number of protests—plotted as the number of protests in per capita
terms—in Tunisia, which occurred after the death of Mohamed Bouazizi on December 17, 2010.
Panel B in Figure 3 confirms the spike in the news about protests in Tunisia around that period. The
protest quickly spread from Tunisia to Bahrain, Egypt, Libya, the Syrian Arab Republic, and the
Republic of Yemen. The availability of data from ACLED limits us to Egypt and Libya only. Panel
A in Figure 3 confirms that both Egypt and Libya experienced spikes in actual protests following
Tunisia’s unrest. The news-based measure appears to be a good proxy to the actual protest data,
which suffer from limitations in terms of coverage.

Figure 3. Protests during the Arab Spring

Panel A: Actual Protests from ACLED

Panel B. Protests based on News

Source: ACLED, FACTIVA and authors’ own calculations.

                      Contagious Protests | Belfer Center for Science and International Affairs   |   February 2021   7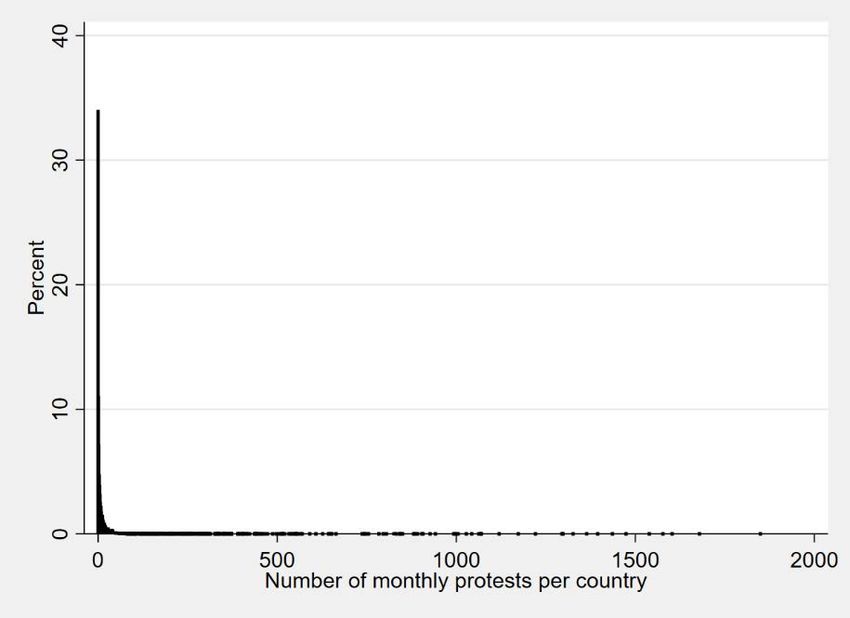
We use data on social media penetration to explore the role of social media as a catalyst for the spread
of protests across country borders. Specifically, we use the number of Facebook subscribers as a
fraction of the population to capture social media penetration in a country. Among different platforms
of social media, Facebook accounts for the lion’s share in pretty much all world regions (see Appendix
Figure A2).2 In previous anecdotal studies, Facebook use was found in different studies to be linked
with protest activity (see Valenzuela et al, 2012 for the case of Chile and for Egypt see New York
Times, 2011). A preliminary look at the data suggests a correlation between protests and Facebook
penetration (see Appendix Figure A3). In particular, the cross-country correlation between Facebook
penetration and the average number of monthly protests (per million persons) is 0.41.

To capture the role of other potential catalysts for protests, we use a variety of other measures.
Polity data are from the Polity IV project, which gathers information about authority characteris-
tics of states for 195 countries. Polity IV provides a democracy index ranging from -10 to 10. We use
the average value of the democracy index over the period 1997 to 2018 to create a dummy variable
on Common Polity. The dummy takes the value of 1 if the average democracy index is above 0, and
the dummy takes the value of 0 otherwise. Two countries are considered “close” in terms of polity if
the dummy for each country takes the same value. Corruption data are from Transparency interna-
tional’s Corruption Perception Index (CPI). The data cover 189 countries. The Common Corruption
dummy takes the value of 1 if both countries under consideration are relatively corrupt, i.e., the
corruption indices of both countries for the last two years are less than the median value. Appendix
Table A2 presents summary statistics of actual protests, news-based protests, polity IV, corruption
perception index, and social media penetration in 2018.

We next present the test as to whether protests in period, t-1, in the rest of world (i.e., for all other
countries j in the rest of the world) lead to protests in the current period, t, in country i. The number of
protests per capita is skewed to the left, with a majority of countries having no protest (see Table 1).

The framework is an autoregressive spatial model following Lesage and Pace (2009). The Zero-
Inflated Poisson (ZIP) model mixes two zero generating processes. The first process generates
zeros. The second process is governed by a Poisson distribution with an estimation as follows:

where is an N-by-1 vector that contains the number of protests per capita in N countries at cur-
rent month .       is an N-by-1 vector that contains the number of protests per capita in N countries
in the past month. In subsequent robustness checks, we use quarterly frequency instead of monthly.

2   China is an important exception where Facebook and other global platforms have been blocked. Facebook was banned after
    June 2009 riots in Western China when the platform was used among protesters.

                        Contagious Protests | Belfer Center for Science and International Affairs   |   February 2021        8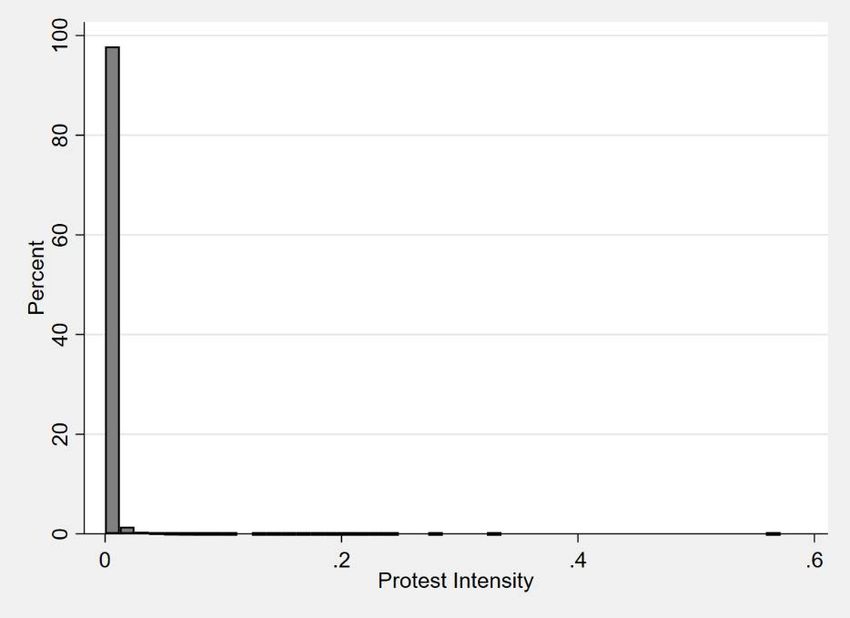
In addition to the Zero-Inflated Poisson estimator, we use the standard Poisson as an alternative
estimator. We also use an alternative measure of protests based on the intensity of media chatter
around protests.

   is an N-by-N spatial weight matrix that captures geographic proximity between countries. In the
baseline specification, we measure the spatial spillovers using geographical distance. The diagonal ele-
ments are zero. The off-diagonal elements are the inverse of the distance between country capitals (i.e.,
          ). Next, the weight matrix is standardized so that the sum of row is unity. captures the impor-
tance of spatial dependence in protest spillover from foreign countries. is an N-by-N identity matrix.
   captures the autoregressive effects of domestic protests per capita in previous months.      and
are vectors of country and month fixed effects. Data on distance and language are obtained from CEPII.

To account for the role that social media could play as a catalyst for protests, we use information
about social media penetration in both source and destination of protests. Specifically, we test
whether source countries with higher social media penetration are more likely to send stronger
protest spillover to other countries. The econometric specification is as follows:

The only difference between (2) and (1) is the spatial weight matrix. now is also an N-by-N
spatial weight matrix but is different from . The diagonal elements are zero. The off-diagonal
elements are the inverse of the distance multiplied by common social media penetration (i.e.,
                                       ). The weight matrix is then also standardized so that the sum
of row is unity. The idea is to account for protests in countries with a common level of social media
penetration.                              is a dummy which takes the value of 1 if both countries i and j
have relatively large penetration of social media and 0 if at least one country’s social media penetra-
tion is below that threshold. The hypothesis we test is that the set of countries subject to potential
protest spillover is limited to countries with social media penetration beyond a certain threshold.

To account for similarities between political systems and other factors that could play an important
role in driving spillovers, we use the following dummies in the estimation:

•                      is a dummy which takes the value of 1 if country i and country j are either
    both democracies or both autocracies. The hypothesis we want to test is whether protest spill-
    overs take place between countries with “close” polity.

                     Contagious Protests | Belfer Center for Science and International Affairs   |   February 2021   9
• is a dummy which takes the value of 1 if both countries i and j have a
high level of corruption. The hypothesis we want to test is whether protest spillovers take place
between countries with “close” levels of perceived corruption.
• is a dummy which takes the value of 1 if both countries i and j have the
same language. The hypothesis we want to test is whether protest spillovers take place between
countries with similar languages.
Contagious Protests | Belfer Center for Science and International Affairs | February 2021 103. Results
The results for geographic proximity point to statistically insignificant protest spillovers from
neighboring countries for both measurement of geographic proximity (see columns [1] and [2] of
Table 1). Column [1] captures the spillovers of protests from neighboring countries (i.e., sharing
borders) where protests are measured as the simple average of the number of protests per million
capita. After controlling for domestic protests in the previous months, protests in neighboring
countries are found to have a statistically insignificant effect on protests in the country under con-
sideration. Similarly, column [2] indicates that the spillovers from inverse distance-weighted global
protests in the previous months are statistically insignificant.
Table 1: Contagion, Distance and Social Media—Actual Protests
Zero-Inflated Poisson Protests per million persons (t)
Distance Only Distance*Common Social Media
Social Media Penetration Threshold
> 10% > 20% > 30%
[1] [2] [3] [4] [5]
Protests pc (t-1) 0.033*** 0.031*** 0.031*** 0.032*** 0.032***
(0.006) (0.004) (0.004) (0.004) (0.004)
Neighbor’s simple average protests pc*(t-1) 0.012
(0.015)
Inverse-distance weighted protests pc*(t-1) 0.022
(0.022)
Inverse-Distance-Common Social Media weighted Protest
0.030 0.044* 0.047**
pc*(t-1)
(0.026) (0.023) (0.022)
Constant Yes Yes Yes Yes Yes
Country fixed effects Yes Yes Yes Yes Yes
Month fixed effects Yes Yes Yes Yes Yes
Observations 7,728 8,256 5,340 3,324 2,652
Number of countries 92 97 67 47 40
N_zero 2776 2822 1584 781 626
Chi-square 18514 22090 16763 11038 9742
Log likelihood -5150 -5865 -4595 -3466 -2836
Note: Robust standard errors in parentheses (*** pThe effects of protest spillovers become significant when the commonality in social media pen-
etration between countries is considered as well. Columns [3],[4],[5] of Table 1 differ in the
threshold of the definition for large social media penetration. In column [3], a country is defined
to have large social media penetration if it has more than 10% of its population subscribed to
Facebook in 2018. In columns [4] and [5], the threshold is 20% and 30% respectively. The dummy
takes the value of 1 if both countries have large social media penetrations
and 0 otherwise.
The larger the threshold, the smaller the number of countries included in the sample—which by
construction only includes countries with social media above the threshold. We can interpret the
results as protest spillovers within a selected number of “connected” countries with high social
media penetration. The three columns show that commonality in social media penetration between
source and destination country of protests plays an important role in protest spillovers. The coeffi-
cients for (inverse distance-social media) weighted average global protests in the previous month
now are statistically significant. The coefficient is more significant with larger magnitude for larger
common social media thresholds, and largest at the 30% threshold (see column [5]). 3
The coefficient of 0.047 implies that a one standard deviation increase in foreign protests, which
is 3.1 more protests per million persons, leads to 1.15 more domestic protests per million persons.
This is 37% of the standard deviation of a country’s monthly protests. To put this in perspective, at
the onset of the Arab Spring, protests in Tunisia jumped from zero in November 2010 to close to 15
protests per million persons in January 2011, which is 5 times the standard deviation of protests in
our sample.
Social media is found to play a significant role in driving spillover of protests using the news-based
measure. News-based protest about neighboring countries in the previous month has statistically
significant effect on current month domestic news-based protest (see Column [1] of Table 2), but
global protest using inverse distance-weighted in previous month has statistically insignificant
effect (Column [2]). We observe large and consistent news-based protest spillovers for countries
with strong media penetrations. This is true for all three thresholds of social media (columns [3]
to [5]). The coefficient of 0.912 in column [5] implies that one standard deviation increase in previ-
ous month’s foreign news-based protests, which is 0.632 percentage point increase, leads to a 1.78
percentage points increase in the contemporaneous month of its own news-based protests. This is
3 When we run the regressions with distance alone on the samples in columns [3],[4],[5], the coefficients of foreign protests
(per million persons) are not significant (Appendix Table A3, Panel A). Appendix Table A4 shows that our main results are
robust to using an earlier cross-section of data for Facebook penetration for the year 2010 for 61 countries for both actual
protests (Panel A) and news-based protests (Panel B).
Contagious Protests | Belfer Center for Science and International Affairs | February 2021 12equivalent to about 3 times the standard deviation of news-based protests.4,5 Our results are consis-
tent with the social media being a catalyst for both push and pull factors behind protests, i.e. social
media makes it much easier for protesters in one country to raise their voice, and for sympathizers
in other countries to read, learn and emulate.
Table 2: Contagion, Distance and Social Media—News based Protests
Zero-Inflated Poisson News-based protests
Distance Only Distance*Common Social Media
Social Media Penetration Threshold
> 10% > 20% > 30%
[1] [2] [3] [4] [5]
News-based protests(t-1) 0.238*** 0.160*** 0.234*** 0.374*** 0.372***
(0.014) (0.012) (0.014) (0.021) (0.022)
Neighbor’s simple news-based protests*(t-1) 0.098***
(0.034)
Inverse distance weighted news-based protests*(t-1) 0.128
(0.152)
Inverse-Distance-Common Social Media weighted
0.889*** 0.872*** 0.912***
News-based protests*(t-1)
(0.137) (0.155) (0.156)
Constant -1.461*** -1.80*** -2.079*** -2.152*** -2.14***
(0.177) (0.321) (0.277) (0.255) (0.258)
Country fixed effects Yes Yes Yes Yes Yes
Month fixed effects Yes Yes Yes Yes Yes
Observations 36,806 49,469 31,348 26,218 24,318
Number of countries 154 207 165 138 128
N_zero 8045 16469 9050 7273 6495
Chi-square 26983 23141 29855 17864 17386
Log likelihood -16695 -22067 -12989 -10529 -9772
Note: Robust standard errors in parentheses (*** pWe examine the role of Polity characteristics, Corruption level and Language in protest spillovers.
They are found to play an insignificant role in the spillover of actual protests (Columns [1] to [3] of
Table 3), except for the spillover of news-based protests where they have some importance (col-
umns [4] to [6]).
Table 3: Contagion, Polity, Corruption, and Language
Zero-Inflated Poisson Protests per million persons News-based protests
[1] [2] [3] [4] [5] [6]
Protest pc (t-1) 0.031*** 0.031*** 0.032***
(0.005) (0.005) (0.004)
News-based protests (t-1) 0.236*** 0.234*** 0.164***
(0.013) (0.014) (0.012)
Inverse-distance-Common Polity weighted
0.009
Protest pc*(t-1)
(0.018)
Inverse-distance-Corruption weighted Protest
0.002
pc*(t-1)
(0.015)
Inverse-distance-Common Language weighted
0.018*
Protest pc*(t-1)
(0.010)
Inverse-distance-CommonPolity weighted
0.467***
news-based protests*(t-1)
(0.078)
Inverse-distance-Corruption weighted news-
0.224***
based protests*(t-1))
(0.074)
Inverse-distance-Common Language weighted
0.174***
news-based protests*(t-1)
(0.051)
Constant Yes Yes Yes Yes Yes Yes
Country fixed effects Yes Yes Yes Yes Yes Yes
Month fixed effects Yes Yes Yes Yes Yes Yes
Observations 8,184 6,048 6,936 38,718 18,499 41,582
Number of countries 95 72 76 162 124 174
N_zero 2822 2117 2602 8241 4023 14946
Chi-square 21384 13219 18698 31139 19957 19197
Log likelihood -5697 -3658 -4730 -509.1 -289.6 -527.0
Note: Robust standard errors in parentheses (*** pRegarding the news discussions of street protests, polity, corruption, and common language are
found to have significant effects on the spillover of global protest discussions (Panel B). Between
them, Common Polity seems to have the largest effects (columns [4] to [6] of Table 3). The coeffi-
cient of 0.467 implies that one standard deviation increase in previous month’s foreign news-based
protests, which is 0.632 percentage point increase, leads to 1.34 percentage points increase in the
contemporaneous month of its own news-based protests.
Contagious Protests | Belfer Center for Science and International Affairs | February 2021 154. Robustness Checks
We conduct several robustness checks. First, we examine protest spillover at the quarterly
frequency. Second, we employ the Standard Poisson estimator. Our results are robust to these
checks.
We find that the spillovers are weaker when using quarterly frequency. This is true for both mea-
sures of protests. Table 4 shows that past foreign protests, even with large social media penetration,
are no longer having spillover effects on domestic protests (columns [1] to [3] of Table 4). The coeffi-
cients remain positive but are not statistically significant.
In terms of news-based protests, foreign protests are found to have statistically significant spillover
effects on domestic protests at all three thresholds of social media penetration (see columns [4] to
[6]). This finding could reflect the stronger tendency for news-based protests to spread than actual
protests do. However, the coefficients associated with the effects for the last quarter’s discussions
about foreign protests are smaller than those of the last month’s (see Table 2 for a comparison). The
effect using quarterly frequency tends to “dilute” the effect captured at the monthly frequency.
Contagious Protests | Belfer Center for Science and International Affairs | February 2021 16Table 4: Contagion, Distance, and Social Media—Quarterly Frequency
Zero-Inflated Poisson Protests per million persons News-based protests
[1] [2] [3] [4] [5] [6]
Social Media Penetration Threshold > 10% > 20% > 30% > 10% > 20% > 30%
Protest pc (t-1) 0.010*** 0.010*** 0.010***
(0.002) (0.002) (0.002)
News-based protests (t-1) 0.193*** 0.413*** 0.412***
(0.032) (0.033) (0.035)
Inverse-distance-Common Social Media
0.039 0.040 0.038
weighted Protest pc*(t-1)
(0.029) (0.025) (0.024)
Inverse-distance-Common Social Media
0.440** 0.536** 0.662***
weighted news-based protests*(t-1)
(0.208) (0.237) (0.233)
Constant Yes Yes Yes Yes Yes Yes
Country fixed effects Yes Yes Yes Yes Yes Yes
Month fixed effects Yes Yes Yes Yes Yes Yes
Observations 1,780 1,108 884 10,395 8,694 8,064
Number of countries 67 47 40 165 138 128
N_zero 310 174 145 1813 1477 1291
Chi-square 11224 7293 6535 14666 8477 8142
Log likelihood -2805 -2117 -1751 -4286 -3466 -3224
Note: Robust standard errors in parentheses (*** pTable 5: Contagion, Distance, and Social Media—Poisson Estimator
Zero-Inflated Poisson Protests per million persons News-based protests
[1] [2] [3] [4] [5] [6]
Social Media Penetration Threshold > 10% > 20% > 30% > 10% > 20% > 30%
Protest pc (t-1) 0.031*** 0.032*** 0.032***
(0.001) (0.002) (0.002)
News-based protests (t-1) 0.234*** 0.374*** 0.372***
(0.020) (0.027) (0.028)
Inverse-distance-Common Social Media
0.029 0.031*** 0.046*
weighted Protest pc*(t-1)
(0.032) (0.028) (0.026)
Inverse-distance-Common Social Media
0.889*** 0.872*** 0.912***
weighted news-based protests*(t-1)
(0.175) (0.214) (0.219)
Constant Yes Yes Yes Yes Yes Yes
Country fixed effects Yes Yes Yes Yes Yes Yes
Month fixed effects Yes Yes Yes Yes Yes Yes
Observations 5,340 3,324 2,652 31,348 26,218 24,318
Number of countries 67 47 40 165 138 128
Chi-square 221625 397000 164076 117912 33160 53553
Log likelihood -4418 -3339 -2729 -12563 -10174 -9443
Note: Robust standard errors in parentheses (*** p5. Conclusions
The frequent shutdown of internet by governments in times of protests illuminates the catalyzing
role of social media. Governments often argue that limited social media access is necessary for
public safety or curbing the spread of misinformation. It seems, however, that a bigger concern is
the organizing role of social media in anti-government protests.
Contagious Protests | Belfer Center for Science and International Affairs | February 2021 19References
Bamert J, Gilardi F and Wasserfallen F. 2015. “Learning and the diffusion of regime contention in the Arab Spring,” Research and
Politics: 1-9.
Battaglini, M. 2017. “Public Protests and Policy Making” The Quarterly Journal of Economics, pp 485–549.
Buera, F, A Monge‐Naranjo and G E. Primiceri. 2011. “Learning the Wealth of Nations,” Econometrica, vol. 79(1), pages 1-45.
Cantoni, Davide, David Y Yang, Noam Yuchtman, Y Jane Zhang. 2019. “Protests as Strategic Games: Experimental Evidence from
Hong Kong’s Antiauthoritarian Movement”. The Quarterly Journal of Economics, Volume 134, Issue 2, May 2019.
Campante, Filipe, Ruben Durante and Francesco Sobbrio. 2018. “Politics 2.0: The Multifaceted Effect of Broadband Internet on
Political Participation.” Journal of the European Economic Association, 16 (4), pp 1094–1136.
Chen H. and W. Suen. 2016. “Falling Dominoes: A Theory of Rare Events and Crisis Contagion,” American Economic Journal:
Microeconomics, 8(1), pages 228-255.
Enikolopov, R., A. Makarin and M. Petrova (forthcoming). “Social Media and Protest Participation: Evidence from Russia.”
Econometrica.
Hale HE. 2013. “Regime change cascades: What we have learned from the 1848 revolutions to the 2011 Arab uprisings.” Annual
Review of Political Science 16: 331–353.
Harari, M. and E. La Ferrara, 2018. “Conflict, Climate and Cells: A disaggregated analysis.” The Review of Economics and Statistics
100(4), p 594-608.
König, M., D. Rohner, M. Thoenig, and F. Zilibotti. 2017. “Network in conflict: Theory and Evidence from the Great War of Africa”.
Econometrica, Vol. 85, No. 4, 1093–1132.
Manacorda, M. and A. Tesei. 2020. “Liberation Technology: Mobile Phones and Political Mobilization in Africa.” Econometrica, 85(4):
533-567.
LeSage, J. and R. Kelley Pace. 2009. Introduction to Spatial Econometrics. Chapman and Hall.
Lynch M. 2013. The Arab Uprising: The Unfinished Revolutions of the New Middle East. New York: Public Affairs.
Puddington, A. 2000. “Broadcasting Freedom: The Cold War Triumph of Radio Free Europe and Radio Liberty”.
Saideman SM. 2012. “When conflict spreads: Arab spring and the limits of diffusion.” International Interactions 38(5): 713–722.
Stehle H. 1982, Church and Pope in the Polish Crisis. The World Today, 38 (4) 139-148.
Valenzuela, S, A. Arriagada, and A. Scherman. 2012. “The social media basis of youth protest behavior: The case of Chile.” Journal of
communication 62.2 pp 299-314.
Contagious Protests | Belfer Center for Science and International Affairs | February 2021 20Weyland, K. 2010. “The diffusion of regime contention in European democratization, 1830–1940.” Comparative Political Studies
43(8-9): 1148–1176.
Weyland K. 2012. “The Arab spring: Why the surprising similarities with the revolutionary wave of 1848?” Perspectives on Politics
10(4): 917–934.
Contagious Protests | Belfer Center for Science and International Affairs | February 2021 21Appendix Table A1
Panel A: Countries included in the ACLED dataset with at least 1 protest
Country First month in Country First month in the
the dataset dataset
Afghanistan 1/2017 Libya 1/1997
Albania 1/2018 Madagascar 1/1997
Algeria 1/1997 Malawi 1/1997
Angola 1/1997 Malaysia 1/2018
Armenia 1/2018 Mali 1/1997
Azerbaijan 1/2018 Mauritania 1/1997
Bahrain 1/2016 Moldova 1/2018
Bangladesh 1/2010 Montenegro 1/2018
Belarus 1/2018 Morocco 1/1997
Benin 1/1997 Mozambique 1/1997
Bosnia and Herzegovina 1/2018 Myanmar 1/2010
Botswana 1/1997 Namibia 1/1997
Bulgaria 1/2018 Nepal 1/2010
Burkina Faso 1/1997 Niger 1/1997
Burundi 1/1997 Nigeria 1/1997
Cambodia 1/2010 North Macedonia 1/2018
Cameroon 1/1997 Oman 1/2016
Central African Republic 1/1997 Pakistan 1/2010
Chad 1/1997 West Bank and Gaza 1/2016
Croatia 1/2018 Philippines 1/2016
Cyprus 1/2018 Qatar 1/2016
Congo, Dem. Rep. 1/1997 Congo, Rep. 1/1997
Djibouti 1/1997 Romania 1/2018
Egypt, Arab Rep. 1/1997 Russian Federation 1/2018
Equatorial Guinea 1/1997 Rwanda 1/1997
Eritrea 1/1997 Saudi Arabia 1/2015
Eswatini 1/1997 Senegal 1/1997
Ethiopia 1/1997 Serbia 1/2018
Gabon 1/1997 Sierra Leone 1/1997
Gambia, The 1/1997 Somalia 1/1997
Georgia 1/2018 South Africa 1/1997
Ghana 1/1997 South Sudan 1/1997
Greece 1/2018 Sri Lanka 1/2010
Guinea 1/1997 Sudan 1/1997
Guinea-Bissau 1/1997 Syrian Arab Republic 1/2017
India 1/2016 Tajikistan 1/2018
Indonesia 1/2015 Tanzania 1/1997
Iran, Islamic Rep. 1/2016 Thailand 1/2010
Iraq 1/2016 Togo 1/1997
Israel 1/2016 Tunisia 1/1997
Côte d’Ivoire 1/1997 Turkey 1/2016
Jordan 1/2016 Turkmenistan 1/2018
Kazakhstan 1/2018 Uganda 1/1997
Kenya 1/1997 Ukraine 1/2018
Kosovo 1/2018 United Arab Emirates 1/2016
Kuwait 1/2016 Uzbekistan 1/2018
Kyrgyzstan 1/2018 Vietnam 1/2010
Lao PDR 1/2010 Yemen, Rep. 1/2015
Lebanon 1/2016 Zambia 1/1997
Lesotho 1/1997 Zimbabwe 1/1997
Liberia 1/1997
Contagious Protests | Belfer Center for Science and International Affairs | February 2021 22Panel B: Countries included in the news-based protest dataset
Afghanistan, Albania, Algeria, Andorra, Angola, Anguilla,Antigua and Barbuda, Argentina, Armenia, Aruba, Australia, Austria,
Azerbaijan, Bahamas, Bahrain, Bangladesh, Barbados, Belarus, Belgium, Belize, Benin, Bermuda, Bhutan, Bolivia, Bosnia and
Herzegovina, Botswana, Brazil, British Virgin Islands, Brunei, Bulgaria, Burkina Faso, Burundi, Cambodia ,Cameroon, Canada, Cape
Verde, Cayman Islands, Central African Republic, Chad, Chile, China, Colombia, Comoros, Congo Republic, Costa Rica, Cote d’Ivoire,
Croatia, Cuba, Cyprus, Czech Republic, Democratic Republic of the Congo, Denmark, Djibouti, Dominica, Dominican Republic,
Ecuador, Egypt, El Salvador, Equatorial Guinea, Eritrea, Estonia, Eswatini, Ethiopia, Faroe Islands, Fiji, Finland, France, French
Polynesia, Gabon, Gambia, Georgia, Germany, Ghana, Gibraltar, Greece, Greenland, Grenada, Guatemala, Guinea-Bissau, Guinea,
Guyana, Haiti, Honduras, Hong Kong, Hungary, Iceland, India, Indonesia, Iran, Iraq, Ireland, Israel, Italy, Jamaica, Japan, Jordan,
Kazakhstan, Kenya, Kiribati, Kuwait, Kyrgyzstan, Laos, Latvia, Lebanon, Lesotho, Liberia, Libya, Lithuania, Luxembourg, Macau,
Madagascar, Malawi, Malaysia, Maldives, Mali, Malta, Marshall Islands, Mauritania, Mauritius, Mexico, Micronesia, Moldova, Mongolia,
Montserrat, Morocco, Mozambique, Myanmar, Namibia, Nauru, Nepal, Netherlands, New Caledonia, New Zealand, Nicaragua, Niger,
Nigeria, North Korea, North Macedonia, Northern Mariana Islands, Norway, Oman, Pakistan, Palau, Palestine, Panama, Papua New
Guinea, Paraguay, Peru, Philippines, Poland, Portugal, Puerto Rico, Qatar, Romania, Russia, Rwanda, Saint Lucia, Samoa, San Marino,
Sao Tome and Principe, Saudi Arabia, Senegal, Seychelles, Sierra Leone, Singapore, Slovakia, Slovenia, Solomon Islands, Somalia,
South Africa, South Korea, Spain, Sri Lanka, St. Helena, St. Kitts and Nevis, St. Vincent and the Grenadines, Sudan, Suriname,
Sweden, Switzerland, Syria, Taiwan, Tajikistan, Tanzania, Thailand, Timor-Leste, Togo, Tonga, Trinidad and Tobago, Tunisia, Turkey,
Turkmenistan, Turks and Caicos Islands, Tuvalu, Uganda, Ukraine, United Arab Emirates, United Kingdom, United States, Uruguay,
Uzbekistan, Vanuatu, Venezuela, Vietnam, Yemen, Zambia, Zimbabwe
Appendix Table A2: Summary Statistics
Corruption
Protests (per Protests news Facebook Penetration
Perception Polity IV
million persons) (%) in 2018 (%)
Index
Number of Obs 8524 49678 3150 162 192
Mean 0.791 0.197 42.388 3.530 41.738
Std. Dev. 3.118 0.632 20.948 6.105 23.446
Min 0.000 0.000 4 -10 0.211
p10 0.000 0.000 21 -6.909 8.169
p25 0.000 0.000 26 -1.364 18.528
Median 0.116 0.075 36 5.818 47.199
p75 0.554 0.202 55 8.909 60.937
p90 1.643 0.438 76 10 72.615
Max 124.192 57.143 100 10 95.906
Number of Countries 101 207 184 162 192
Country Country
Unit Country-Month Country-Month Country
average average
Contagious Protests | Belfer Center for Science and International Affairs | February 2021 23Appendix Table A3: Contagion and Distance
Panel A: Actual Protests using Reduced Sample
[1] [2] [3]
Zero-Inflated Poisson Protests per million persons (t)
Social Media Penetration Threshold > 10% > 20% > 30%
Protest pc (t-1) 0.030*** 0.031*** 0.031***
(0.005) (0.004) (0.004)
Inverse-Distance-weighted Protest pc*(t-1) -0.002 0.042 0.044
(0.037) (0.033) (0.033)
Country fixed effects Yes Yes Yes
Month fixed effects Yes Yes Yes
Observations 5,340 3,324 2,652
Number of countries 67 47 40
N_zero 1584 781 626
Chi-square 14778 11188 9926
Log likelihood -4673 -3470 -2840
Note: This panel reports the regressions on the samples of columns [3] to [5] of Table 1. The results point to insignificant effect of
the inverse-distance weighted average protests (per million persons). Robust standard errors in parentheses (*** pPanel B: News Coverage using Reduced Sample
[1] [2] [3]
Zero-Inflated Poisson News-based protests (t)
Social Media Penetration Threshold > 10% > 20% > 30%
News-based protests(t-1) 0.231*** 0.371*** 0.370***
(0.014) (0.021) (0.021)
Inverse-distance-weighted news-based protests*(t-1) 0.432*** 0.229 0.217
(0.112) (0.141) (0.145)
Constant -2.016*** -2.072*** -2.053***
(0.276) (0.255) (0.257)
Country fixed effects Yes Yes Yes
Month fixed effects Yes Yes Yes
Observations 31,348 26,218 24,318
Number of countries 165 138 128
N_zero 9050 7273 6495
Chi-square 29724 18124 17650
Log likelihood -12994 -10537 -9782
Note: This panel reports the regressions on the samples of columns [3] to [5] of Table 2. The results point to largely insignificant ef-
fect of the inverse-distance weighted average news-based protests. Robust standard errors in parentheses (*** pAppendix Table A4:
Contagion, Distance and Social Media—2010 Facebook Penetration
Panel A: Contagion, Distance, and Social Media—Actual Protests
[1] [2]
Zero-Inflated Poisson
Social Media Penetration Threshold in July 2010 > 5% > 10%
Protest pc (t-1) 0.037*** 0.038***
(0.003) (0.003)
Inverse-Distance-Common Social Media weighted Protest pc*(t-1) 0.054* 0.052*
(0.029) (0.028)
Constant Yes Yes
Month fixed effects Yes Yes
Observations 1,056 552
Number of countries 18 13
N_zero 160 88
Chi-square 7017 3817
Log likelihood -1244 -860.5
Note: This panel includes countries having social media penetration in July 2010 larger than 5% and 10% thresholds. The results
point to still positive and marginally significant effect of the inverse-distance-social media weighted average global protests (per
million persons). Robust standard errors in parentheses (*** pPanel B: Contagion, Distance and Social Media—News based Protests
[1] [2]
Zero-Inflated Poisson
Social Media Penetration Threshold > 5% > 10%
Protest news(t-1) 0.467*** 0.452***
(0.029) (0.029)
Inverse-Distance-Common Social Media protest news*(t-1) 0.456*** 0.373***
(0.109) (0.099)
Constant Yes Yes
Country fixed effects Yes Yes
Month fixed effects Yes Yes
Observations 10,038 8,604
Number of countries 42 36
N_zero 545 392
Chi-square 11179 10963
Log likelihood -4099 -3527
Note: This panel includes countries having social media penetration in July 2010 larger than 5% and 10% thresholds.
The results point to positive and highly significant effect of the inverse-distance-social media weighted average global
protests news. Robust standard errors in parentheses (*** pAppendix Table A5: Contagion, Distance, and Social Media
Panel A: Actual Protests—including Countries with Social Media Penetration below
Thresholds
[1] [2] [3]
Zero-Inflated Poisson Protests per million persons (t)
Social Media Penetration Threshold > 10% > 20% > 30%
Protest pc (t-1) 0.031*** 0.031*** 0.031***
(0.004) (0.004) (0.004)
Inverse-Distance-Common Social Media weighted Protest pc*(t-1) 0.030 0.022 0.023
(0.024) (0.020) (0.019)
Constant Yes Yes Yes
Month fixed effects Yes Yes Yes
Observations 7,812 7,812 7,812
Number of countries 92 92 92
N_zero 2603 2603 2603
Chi-square 21691 21761 21712
Log likelihood -5573 -5573 -5573
Note: This panel reports the regressions in columns [3] to [5] of Table 1 but including countries having social media penetration
below the thresholds (by assigning undefined weights to zero). The results point to still positive but insignificant effect of the
inverse-distance-social media weighted average global protests (per million persons). Robust standard errors in parentheses (***
p 30%
News-based protests(t-1) 0.236*** 0.234*** 0.234***
(0.013) (0.013) (0.013)
Inverse-Distance-Common Social Media news-based protests*(t-1) 0.510*** 0.540*** 0.495***
(0.132) (0.120) (0.118)
Constant Yes Yes Yes
Country fixed effects Yes Yes Yes
Month fixed effects Yes Yes Yes
Observations 45,886 45,886 45,886
Number of countries 192 192 192
N_zero 14686 14686 14686
Chi-square 30003 29919 29898
Log likelihood -19695 -19693 -19694
Note: This panel reports the regressions in columns [3] to [5] of Table 2 but including countries having social media penetration
below the thresholds (by assigning undefined weights to zeros). The results point to positive and highly significant effect of the in-
verse-distance-social media weighted average global protests news. Robust standard errors in parentheses (*** pAppendix Figure A1: Distribution of Protests
Panel A: Distribution of Number of Protests per Country per Month
Source: ACLED and authors’ own calculation.
Note: In 34 percent of country-month pairs (2910 out of 8549), there is no occurrence of protest.
Panel B: Distribution of Protests News Intensity
Source: Dow Jones’ FACTIVA and authors’ own calculation.
Note: Protest intensity is measured as the number of street news-based protests articles divided by the number of total news
articles in that country and month. In 33.4 percent of country-month pairs (16568 out of 49678), there is zero news-based protests.
Contagious Protests | Belfer Center for Science and International Affairs | February 2021 29Appendix Figure A2: Market Shares of Facebook
Panel A: Facebook versus other Social Media Platforms
Panel B: Facebook’s Market Share in Different Regions
Source: statcounter.com [https://gs.statcounter.com/social-media-stats#monthly-200903-202005]
Contagious Protests | Belfer Center for Science and International Affairs | February 2021 30Appendix Figure A3: Facebook Penetrations and Protests
Panel A: Average Number of Protests per Million Persons Per Month
Source: ACLED.
Note: Include countries with at least 1 protest. Data coverage starts from January 2010.
Panel B: Facebook Penetration (% of Population, December 2018)
Source: www.napoleoncat.com.
Contagious Protests | Belfer Center for Science and International Affairs | February 2021 31You can also read