Site C Clean Energy Project

        Rebuttal Evidence

With Respect to the Submissions of
  Mr. Philip Raphals on Behalf of
    Treaty 8 Tribal Association
←
→
Page content transcription
If your browser does not render page correctly, please read the page content below
Site C Clean Energy Project
Rebuttal Evidence
With Respect to the Submissions of
Mr. Philip Raphals on Behalf of
Treaty 8 Tribal AssociationRebuttal Evidence
With Respect to the Submissions of
Mr. Philip Raphals on Behalf of
Treaty 8 Tribal Association
Table of Contents
1 Introduction ........................................................................................................ 1
2 Block and Portfolio PV Modelling Analysis ......................................................... 3
3 Project Need and Purpose ................................................................................. 5
3.1 The Claim that Maximizing the Development of Hydroelectric
Potential of the Site Flood Reserve is a Constraint on Need and
Alternatives To the Project ........................................................................ 5
3.2 The Claim that Retail Access should be Addressed in the Load
Forecast .................................................................................................... 6
3.3 The Claim that Need for Capacity Drives the IRP and the Project ............ 8
4 Site C Unit Capacity Cost ................................................................................. 10
5 Four Alternatives .............................................................................................. 13
5.1 Simple Cycle Gas Turbines..................................................................... 13
5.2 Site 7B .................................................................................................... 15
5.3 DSM Capacity Initiatives ......................................................................... 16
5.4 DSM Option 3 ......................................................................................... 21
6 Base Resource Plans ....................................................................................... 23
6.1 External Market Energy Reliance ............................................................ 23
6.2 DSM Reliance for Capacity ..................................................................... 25
6.3 BRP Evaluation Period............................................................................ 26
7 Small Gap/Large Gap Scenarios ...................................................................... 26
List of Figures
Figure 1 Project UCC ..................................................................................... 12
List of Appendices
Appendix A Load Forecast Submissions
Site C Clean Energy Project
Page iRebuttal Evidence
With Respect to the Submissions of
Mr. Philip Raphals on Behalf of
Treaty 8 Tribal Association
1 1 Introduction
2 On 29 November 2013 Mr. Philip Raphals filed a written submission on behalf of
3 Treaty 8 Tribal Association (T8TA) entitled “Need for, Purpose of and Alternatives to
4 the Site C Hydroelectric Project” (Raphals Submission). 1 Mr. Raphals made two
5 oral presentations on 10 December 2013 which summarized the Raphals
6 Submission. 2 By letter dated 3 December 2013, 3 BC Hydro sought leave pursuant to
7 section 5.10 of the Public Hearing Procedures to file written rebuttal evidence to the
8 Raphals Submission. BC Hydro provides the following Rebuttal Evidence pursuant
9 to counsel for the Joint Review Panel’s (JRP) e-mail dated 6 December 2013
10 conveying that the JRP had acceded to BC Hydro’s request. 4
11 BC Hydro’s overall assessment is that Mr. Raphals has engaged in a mathematical
12 exercise that does not account for the Clean Energy Act 5 self-sufficiency restriction
13 and does not present a reasonable framework for future actions that BC Hydro could
14 take to provide its customers with reliable, cost-effective service with manageable
15 risks. This is apparent when one examines the two Raphals Submission Base
16 Resource Plans (BRPs).
17 BC Hydro’s Rebuttal Evidence is organized to generally follow the structure of the
18 Raphals Submission, with some exceptions:
19 • Part 2 addresses the contention that BC Hydro has not been clear that there
20 are two distinct analyses – the Block Analysis and the Portfolio Present Value
21 (PV) modelling analysis. Part 2 concludes by reiterating that the Portfolio PV
1
Canadian Environmental Assessment Agency Registry Number (CEAR) #1952.
2
Copies of the slides are found at CEAR #2085 and CEAR #2087.
3
Letter of Mr. Feldberg, Fasken Martineau, page 7; CEAR #2006.
4
CEAR #2023.
5
S.B.C. 2010, c.22.
Site C Clean Energy Project
Page 1Rebuttal Evidence
With Respect to the Submissions of
Mr. Philip Raphals on Behalf of
Treaty 8 Tribal Association
1 modelling analysis is the primary test for the cost-effectiveness of the Project
2 compared to portfolios of available alternatives;
3 • Part 3 responds to the assertion that the purpose of the Site C Clean Energy
4 Project (Project) is restricted to the need for dependable capacity in F2019
5 after taking into account achievement of the aggressive Demand Side
6 Management (DSM) Target and renewal of contracts (called Electricity
7 Purchase Agreements or EPAs) with Independent Power Producers (IPPs);
8 • Part 4 analyzes the Project Unit Capacity Cost (UCC) created by Mr. Raphals;
9 • Part 5 reviews the positioning of four potential alternatives – natural gas-fired
10 Simple Cycle Gas Turbines (SCGTs); Site 7B; three DSM capacity initiatives -
11 industrial customer load curtailment, DSM capacity programs and Time of Use
12 (ToU) rates; and DSM Option 3;
13 • Part 6 canvasses the two Raphals Submission BRPs, with emphasis on the
14 degree of reliance on uncertain DSM to meet BC Hydro’s need for dependable
15 capacity, and the use of external market energy contrary to the self-sufficiency
16 requirement found in section 6 of the Clean Energy Act;
17 • Part 7 assesses the Raphals Submission Contingency Resource Plans
18 (CRPs).
19 Appendix A contains BC Hydro’s rebuttal comments concerning the two documents
20 introduced by Mr. Rick Hendriks on behalf of T8TA for the first time at the public
21 hearing on 9 December 2013 entitled “2007 LTAP Load Forecast versus Actuals” 6
22 and “Alcoa Vows to Cut Power use in Quebec as Power Rates Rise”. 7 BC Hydro
23 counsel expressed concern that these materials were introduced without any
24 opportunity for BC Hydro to review and provide comments, and asked for the
25 opportunity to provide rebuttal on 24 December 2013. The Chair of the JRP agreed
6
CEAR #2018.
7
CEAR #2107.
Site C Clean Energy Project
Page 2Rebuttal Evidence
With Respect to the Submissions of
Mr. Philip Raphals on Behalf of
Treaty 8 Tribal Association
1 that BC Hydro could provide rebuttal on 24 December 2013 with respect to the two
2 documents introduced by Mr. Hendriks. 8
3 2 Block and Portfolio PV Modelling Analysis
4 The Raphals Submission at pages 6 to 8 and again at pages 32 to 38 makes claims
5 that BC Hydro bases its conclusions on Project cost-effectiveness on the Block
6 Analysis. At page 7, the Raphals Submission states that “[t]he conclusions of the
7 EIS … are based upon the block analysis” and that “the description of the portfolio
8 modelling framework … presented in s.5.5.3 and 5.5.3.1 of the EIS in fact refer to
9 the block analysis”. BC Hydro disagrees with this characterization, and references
10 the Environmental Impact Statement (EIS), page 5-61, lines 7-17 for the description
11 of the portfolio modelling created by System Optimizer and page 5-69, lines 6-11
12 where it was made clear that the comparable Block Analysis was in addition to the
13 System Optimizer portfolios.
14 The Raphals Submission further argues that BC Hydro only acknowledged that it
15 carried out two distinct analysis in its Evidentiary Update; 9 and that BC Hydro was
16 clearer in its 2013 Integrated Resource Plan (IRP) as compared to any of the
17 environmental assessment filings that the Portfolio PV modelling is the primary
18 means of assessing the cost-effectiveness of the Project and the alternative
19 portfolios. For example, the Raphals Submission at page 7 quotes the August 2013
20 IRP 10 to assert that the IRP is clear as to the advantages of the Portfolio PV
21 modelling analysis:
8
Transcript, Volume 1, 9 December 2013, page 166, line 23 to page 167, line 9.
9
CEAR #1574.
10
The Raphals Submission refers to the August 2013 IRP submitted to the British Columbia Minister of Energy
and Mines (Minister) on 3 August 2013. BC Hydro submitted a revised IRP to the Minister on 15 November
2013. The Lieutenant Governor-in-Council approved the November 2013 IRP on 25 November pursuant to
Order in Council (OIC) No. 514. A copy of the November 2013 IRP is found at CEAR #2101, and a copy of
the OIC is found at CEAR #2159. The differences between the August 2013 IRP and the November 2103 IRP
are not material to Mr. Raphals’ analysis.
Site C Clean Energy Project
Page 3Rebuttal Evidence
With Respect to the Submissions of
Mr. Philip Raphals on Behalf of
Treaty 8 Tribal Association
1 The second method creates and evaluates portfolios using the linear
2 organization model (System Optimizer) that selects the optimal
3 combinations of resources over a 30-year planning horizon under
4 different assumptions and constraints. The analysis using System
5 Optimizer is a more sophisticated approach and provides additional
6 information not captured by the simple unit cost comparison.
7 [Emphasis in the original].
8 The underlined portion of this quote appears virtually word-for-word at page 29 of
9 the Evidentiary Update:
10 The [Portfolio Modelling using System Optimizer] analysis evaluates
11 the cost competitiveness of the Project by comparing the present value
12 cost of portfolios with and without the Project using the System
13 Optimizer. As described in Section 5.5.3.2 of the EIS as amended,
14 System Optimizer is a model that selects a resource expansion
15 sequence (i.e. the order in which new projects are built) that minimizes
16 the present value (PV) of net system costs.
17 The analysis using System Optimizer is a more sophisticated approach
18 than the Block Analysis and provides additional information not
19 captured by the block analysis, including … [Emphasis added].
20 BC Hydro has consistently based the analysis of Project cost-effectiveness primarily
21 on the Portfolio PV modelling in the EIS, Evidentiary Update and supporting analysis
22 such as IR responses. In its 8 May 2013 response to T8TA Information Request (IR)
23 ab_0001-137, 11 BC Hydro explained that there are two analysis, and that the Block
24 Analysis, which takes a block of resources that can deliver the same energy and
25 dependable capacity as the Project, provides the longer net cost difference between
26 the Project and alternative resources as Unit Energy Costs (UECs).
27 BC Hydro clarified in both its 4 June 2013 “Technical Memo: Alternatives to the
28 Project” 12 and the 13 September 2013 Evidentiary Update that the Portfolio PV
29 modelling using System Optimizer is the primary means of analyzing the
30 cost-effectiveness of the Project and available alternative resources in both the EIS
11
CEAR #1423.
12
CEAR #1458; a copy is also found attached to BC Hydro’s Evidentiary Update, CEAR #1574.
Site C Clean Energy Project
Page 4Rebuttal Evidence
With Respect to the Submissions of
Mr. Philip Raphals on Behalf of
Treaty 8 Tribal Association
1 and Evidentiary Update. Section 3.3.2 of the Evidentiary Update lists the two key
2 advantages of the Portfolio PV modelling analysis: (1) it captures most of the
3 economical dispatch value (for dispatchable resources such as the Project, natural
4 gas-fired generation) which provides value to BC Hydro’s customers and is a point of
5 differentiation of the Project from intermittent clean or renewable resources such as
6 wind and run-of-river; and (2) it incorporates the ‘lumpiness’ of resources by
7 modeling timing of resources and the net cost of energy imbalances by comparing
8 acquisition costs to value in the electricity markets. The resulting annual energy
9 surplus or deficit will differ depending on the portfolio – i.e., portfolios that do not
10 include the Project will not produce the same annual surplus/deficit as portfolios with
11 the Project.
12 3 Project Need and Purpose
13 The bulk of the Raphals Submission concerns alternatives to the Project. However,
14 the Raphals Submission raises the following three issues with respect to the need
15 for and purpose of the Project.
16 3.1 The Claim that Maximizing the Development of Hydroelectric
17 Potential of the Site Flood Reserve is a Constraint on Need and
18 Alternatives To the Project
19 Mr. Raphals appears to argue at pages 12 -13 of his submission that the “objective
20 to maximize the development of the hydroelectric potential of the Site C Flood
21 Reserve” acted as an objective with respect to or a constraint on the need for and/or
22 alternatives to the Project. If so, this is demonstrably false.
23 The objective of maximizing the development of the hydroelectric potential of the
24 Site C Flood Reserve has no impact on the determination of the need for the Project,
25 which as described in section 5.2 of the EIS consists of the following elements:
26 • The December 2012 Load Forecast;
Site C Clean Energy Project
Page 5Rebuttal Evidence
With Respect to the Submissions of
Mr. Philip Raphals on Behalf of
Treaty 8 Tribal Association
1 • Generation resources such as BC Hydro’s 30 existing hydroelectric generating
2 facilities and IPPs that are currently delivering electricity to BC Hydro pursuant
3 to their EPAs; and
4 • The addition of two future resources prior to the Project: (1) implementation of
5 the DSM Target of 7,800 gigawatt hours per year (GWh/year) of energy
6 savings and 1,400 megawatts (MW) of associated capacity savings by F2021,
7 and (2) renewing IPP EPAs as described in section 3.3 of this Rebuttal
8 Evidence.
9 It is also clear that maximizing the development of the hydroelectric potential of the
10 Site C Flood Reserve was not a constraint on consideration of alternatives to the
11 Project in sections 5.4 and 5.5 of the EIS. Alternative portfolios were created that did
12 not include the Project. In accordance with sections 4.1.1, 4.1.2 and 4.2 of the EIS
13 Guidelines and the Canadian Environmental Assessment Agency’s Operational
14 Policy Statement: Addressing the “Need for”, “Purpose of”, “Alternatives to” and
15 “Alternative Means” under the Canadian Environmental Assessment Act”, 13
16 BC Hydro screened resources in section 5.4.2 of the EIS to determine if they are
17 legislatively barred, or economically or technically feasible. The resulting available
18 alternative resources are listed in section 5.5 of the EIS. The energy resources
19 selected by System Optimizer in the Portfolio PV modelling in the mid-gap portfolios
20 consist of wind in the Peace Region and Central Interior of B.C., with much smaller
21 amounts of wood-based biomass and municipal solid waste in the Lower Mainland
22 and Vancouver Island, and one run-of-river project in the Lower Mainland.
23 3.2 The Claim that Retail Access should be Addressed in the Load
24 Forecast
25 The Raphals Submission makes a comment at page 23 that “[t]o the extent …
26 industrial customers make use of retail access it will reduce the loads to be served
13
Updated version (November 2007), pages 1 and 3.
Site C Clean Energy Project
Page 6Rebuttal Evidence
With Respect to the Submissions of
Mr. Philip Raphals on Behalf of
Treaty 8 Tribal Association
1 by BC Hydro. This eventuality is not addressed in the 2012 Load Forecast”. It would
2 be an arbitrary and therefore imprudent exercise to reduce industrial customer load
3 on the basis advanced by Mr. Raphals given the significant uncertainty concerning
4 the workability and design of retail access, and the resulting impact, if any, on
5 BC Hydro’s Load Forecast.
6 Retail access occurs when a customer buys some or all of its generation from a
7 third-party supplier but continues to use the public utility’s transmission assets for
8 delivery. The Industrial Electricity Policy Review Task Force (IEPR) final report,
9 which is referred to by Mr. Raphals with respect to ToU rates, notes that retail
10 access raises difficult design issues:
11 • “It may be difficult to design a program that both delivers material value to
12 participating customers and maintains a ‘no harm’ principle” (the protection for
13 remaining customers that would face unreasonable costs when other
14 customers depart from the BC Hydro system);
15 • “Competing uses for the transmission system may limit BC Hydro’s ability to
16 optimize its generation and transmission system, particularly in times of
17 surplus”; and
18 • “Retail access may be inconsistent with the Province’s self-sufficiency and
19 [greenhouse gas] reduction objectives by enabling costs of these policies to be
20 avoided”. 14
21 Appendix 3.1 to the IEPR final report notes three models of retail access that could
22 be pursued:
23 • Retail access from B.C.-based generation other than BC Hydro’s, meaning
24 IPPs. Such a program existed between 2005 and 2012 15 - the BC Hydro retail
14
IEPR final report, released 26 November 2013, page 28; available at
www.newsroom.gov.bc.ca/downloads/Industrial_Policy_Review_Task_Force_Report.pdf.
Site C Clean Energy Project
Page 7Rebuttal Evidence
With Respect to the Submissions of
Mr. Philip Raphals on Behalf of
Treaty 8 Tribal Association
1 access program, which had the policy objective to encourage IPP development.
2 No industrial customer made use of this retail access program because IPP
3 energy was consistently more expensive than BC Hydro supply;
4 • Retail access within B.C. and access to the Mid-Columbia (Mid-C) market for
5 spot energy; and
6 • Market price indexing. This model would see BC Hydro index a portion of an
7 industrial customer’s energy purchases to the Mid-C market.
8 The B.C. Government response to the retail access portion of the IEPR final report is
9 that “[a] rate design review process will be launched to examine ways to provide
10 industrial customers with more options to reduce their electricity costs”. 16 Given the
11 significant uncertainty concerning the parameters for retail access and the outcome
12 of the B.C. Government announced rate design review process, it would be
13 imprudent to reduce forecasted customer load based on retail access. As a result,
14 Mr. Raphals criticism is unwarranted.
15 3.3 The Claim that Need for Capacity Drives the IRP and the Project
16 Mr. Raphals asserts at page 10 of his submission that the 2013 IRP “makes clear
17 that it is capacity needs that drive the planning process”, and references as support
18 the fact that the consequences of a capacity shortfall are greater compared to the
19 consequences of an energy shortfall.
20 The statements made by BC Hydro refer to the difference in consequences between
21 an energy shortfall and a capacity shortfall. They do not indicate that energy supply
22 is not a core component of the resource planning process. The 2013 IRP is
23 BC Hydro’s long-term resource plan to address both the need for energy and for
15
BC Hydro’s retail access program was approved by the British Columbia Utilities Commission (BCUC) in
2005 by BCUC Order G-79-05, and suspended by the BCUC in 2012 by BCUC Order G-39-12.
16
B.C. Ministry of Energy and Mines, “Backgrounder: Industrial Electricity Policy Review Report”, Item #11,
page 2; available at
www.newsroom.gov.bc.ca/downloads/Backgrounder_Industrial_Electricity_Policy_Review_Report.pdf.
Site C Clean Energy Project
Page 8Rebuttal Evidence
With Respect to the Submissions of
Mr. Philip Raphals on Behalf of
Treaty 8 Tribal Association
1 capacity. This is clear from a review of Chapter 9 of the November 2013 IRP setting
2 out BC Hydro’s action plan for the next five years:
3 • As demonstrated by Tables 3 and 4 of the Evidentiary Update, without future
4 resources there is a need for energy in virtually the same year as the need for
5 capacity – F2018 for energy and F2017 for capacity.
6 • As set out in section 3.1 above, BC Hydro factors in two resources prior to
7 determining the need for the Project – the DSM Target and IPP EPA renewals.
8 The DSM Target is being relied on for both energy and capacity. The IPP EPA
9 renewals are relied on for energy and capacity, albeit the clean or renewable
10 IPP resources do not make a large dependable capacity contribution. The result
11 is a need for energy in F2027 and a need for capacity in F2019 as described at
12 page 12 of the Evidentiary Update. 17
13 The contention also overlooks that the Portfolio PV modelling recognizes there is a
14 difference in timing for the need for capacity and the need for energy. As provided in
15 section 3.3.2 of the Evidentiary Update, the Portfolio PV modelling times resource
16 additions to the need for energy and capacity. The Project, which provides both
17 energy and dependable capacity, in general has a PV advantage over alternative
18 Clean Generation and Clean + Thermal Generation portfolios across a range of
19 sensitivities.
20 BC Hydro agrees that the consequences of failing to deliver required capacity are
21 greater than failure to deliver required energy. In addition to the reasons contained in
22 the IRP quote at page 11 of the Raphals Submission (lead times and fewer capacity
23 options), relying on external markets during winter peaks raises the issues listed at
24 page 5-19 of the EIS: the thinly traded nature of the market for capacity; insufficient
25 transmission capability; and the market not having surplus capacity to sell.
17
Without accounting for liquefied natural gas (LNG) demand; the corresponding energy and capacity gaps are
F2022 and F2019 respectively with LNG load at about 3,000 GWh/year and 360 MW: Transcript, Volume 1, 9
December 2013, page 327, lines 21-22.
Site C Clean Energy Project
Page 9Rebuttal Evidence
With Respect to the Submissions of
Mr. Philip Raphals on Behalf of
Treaty 8 Tribal Association
1 4 Site C Unit Capacity Cost
2 Mr. Raphals generated a Project UCC for the period 2024 to 2040, and incorrectly
3 valued the energy the Project would avoid using BC Hydro’s spot market forecasts in
4 all years. The predictable result is the high Project UCCs shown in Figure 16 of the
5 Raphals Submission of $306 per kilowatt year (kW-year) in 2024 and $237/kW-year
6 in 2040.
7 The UCC put forward in the Raphals Submission is misleading, giving the
8 impression that:
9 1. The Project creates an energy surplus for a significant period of time, despite the
10 fact that Mr. Raphals correctly observes that under the reference case output
11 from System Optimizer, “the percentage of Site C energy that will be surplus to
12 the utility’s needs will fall gradually from 100% in 2024 to 0% in 2033” [emphasis
13 added] (Raphals Submission, page 48). The load-resource balance in Table 9 of
14 the Evidentiary Update shows that based on the case with no LNG demand, with
15 the implementation of the Project, and assuming achievement of the DSM Target
16 and renewal of EPAs, the energy surplus in F2033 is about 200 GWh, indicating
17 that about 96 % of the Project’s energy is required domestically in that year.
18 There would be an incremental need for energy in F2034;
19 2. The energy that the Project would avoid for its entire life should be valued using
20 the spot market, even when there is a need for energy. Mr. Raphals expressly
21 states that he valued “Site C energy used by BC Hydro customers … at the price
22 at which it could be purchased in the [external spot] market” [emphasis added]
23 (Raphals Submission, page 48). Mr. Raphals agreed under questioning that a
24 UCC for a long-lived resource such as the Project should not be based solely on
25 the period of time when the Project creates an energy surplus 18 and that when
26 there is a need for energy, BC Hydro must meet that need using B.C.-based
18
Transcript, Volume 2, page 142, line 21 to page 143, line 1.
Site C Clean Energy Project
Page 10Rebuttal Evidence
With Respect to the Submissions of
Mr. Philip Raphals on Behalf of
Treaty 8 Tribal Association
1 resources given the self-sufficiency requirement set out in section 6 of the Clean
2 Energy Act. 19 As explained in section 5.4.2.1 of the EIS, external market/import
3 energy such as spot market energy does not meet the self-sufficiency
4 requirement because it is not energy “solely from electricity generating facilities
5 within the Province”. Spot market energy is forecast to be far lower in price than
6 B.C.-based energy resources. For example, BC Hydro’s mid electricity forecast
7 (Market Scenario 1) shows spot market energy at about $39/MWh CAD, $F2013)
8 in 2030 compared to $124/MWh-$125/MWh for clean or renewable IPP
9 resources. 20
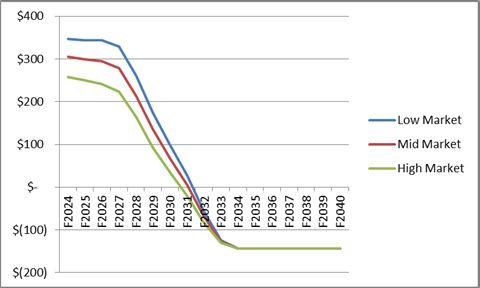
10 BC Hydro reproduces a comparison figure for Raphals Submission Figure 16, using
11 the following assumptions:
12 • During the period of F2024-F2033 when a portion of the Project’s energy is
13 surplus, the surplus energy is valued using Market Scenario 1 (“Mid Market”) and
14 the needed energy is valued using the UEC of the energy resources selected in
15 the Clean Generation Block of $125/MWh given the Clean Energy Act’s 93 %
16 clean or renewable objective. The low market price (Market Scenario 2) and high
17 market price scenario (Market Scenario 3) values are also included; and
18 • After F2033, when all of the Project’s energy is needed, the Project energy is
19 valued using the same $125/MWh UEC.
20 The result is a net Project UCC of minus $127/kW-year in F2033, and a net Project
21 UCC of minus $144/kW-year in F2040. Refer to Figure 1.
19
Transcript, Volume 2, 10 December 2013, page 143, lines 2-7.
20
Evidentiary Update, Supplemental Information to Part 4, Table 26 (for spot market values) and
Evidentiary Update, Appendix B, section 7.1.2.2 ‘Energy’ (for clean or renewable IPP values).
Site C Clean Energy Project
Page 11Rebuttal Evidence
With Respect to the Submissions of
Mr. Philip Raphals on Behalf of
Treaty 8 Tribal Association
1 Figure 1 Project UCC
2 Appendix B of the Raphals Submission reproduces T8TA’s written comment to
3 BC Hydro concerning the August 2103 IRP. T8TA requested a UCC for the Project.
4 BC Hydro’s response is that the Portfolio PV modelling analysis considers both the
5 energy and capacity provided by a resource such as the Project, and is a more
6 thorough analysis of the cost-effectiveness of the Project than a unit cost
7 assessment. UCCs are generally presented to compare the costs of resources that
8 are relied on to serve winter peak requirements, and UECs are generally presented
9 to compare the costs of resources that are relied on to serve annual energy
10 requirements. To compare a resource such as the Project which provides both
11 energy and capacity to a resource that only provides capacity, BC Hydro needs to
12 adjust the Project UCC to take into account the large energy benefits of avoiding
13 clean or renewable energy resources in B.C., which results in a negative UCC. 21
14 This is borne out by Figure 1 above.
21
November 2013 IRP, supra, note 10, page 7-92.
Site C Clean Energy Project
Page 12Rebuttal Evidence
With Respect to the Submissions of
Mr. Philip Raphals on Behalf of
Treaty 8 Tribal Association
1 5 Four Alternatives
2 The Raphals Submission at pages 15 to 31 canvasses four potential alternatives to
3 the Project:
4 • SCGTs (section 3.1.1 of the Raphals Submission);
5 • Site 7B (section 3.1.2);
6 • DSM capacity initiatives (section 3.2), consisting of industrial load curtailment,
7 capacity-focused DSM programs and ToU rate(s); and
8 • DSM Option 3 (section 3.3).
9 5.1 Simple Cycle Gas Turbines
10 The Raphals Submission suggests at page 18 that it should not be assumed that
11 SCGTs must run for 18% of the time but rather that SCGTs should be planned on as
12 if they operated as little as 5% of the time. The Raphals Submission’s evidence in
13 support of the 5% SCGT reliance consists of a 1995 Hydro-Quebec release of plant
14 operating statistics that showed average capacity factors for gas turbines was 0.2%
15 and reference to a single SCGT facility in Ontario - York Energy Centre - that is
16 designed to operate between 3-15% of the time. BC Hydro observes that the 15%
17 upper end of York Energy Centre is not that different from the BC Hydro 18%
18 number. The Raphals Submission provides no context for the systems in which
19 these plants are to be operated, no indication of whether these systems have a
20 surplus of capacity resources or how they would compare to BC Hydro’s in terms of
21 existing generation resources and their operation.
22 The Raphals Submission on SCGT capacity factors is not a realistic assessment of
23 BC Hydro’s system needs and capability. BC Hydro’s rationale for the 18% operating
24 requirement is based on an assessment of its future operating requirements as well
Site C Clean Energy Project
Page 13Rebuttal Evidence
With Respect to the Submissions of
Mr. Philip Raphals on Behalf of
Treaty 8 Tribal Association
1 as to be able to meet the intent of the Clean Energy Act. Each of these issues is
2 addressed in turn.
3 Reliability and Operational Requirements
4 Planning future resource portfolios and building and acquiring future generation
5 resources must address system operational considerations and ensures customers
6 receive a reliable and secure supply of electricity. The 5% SCGT capacity factor
7 claim does not take system reliability and operational issues into consideration. The
8 operating issues contemplated in arriving at the 18% capacity factor include the
9 existing hydro and natural gas-fired generation resources and the number of peak
10 load hours over the winter period.
11 The components of the existing system generation are important to consider in
12 assessing the benefits contributed by new generation. The assumption that all new
13 SCGTs would be limited-use peakers ignores what resources have been built to
14 date and how they are operated. This would be true for any power system whether
15 hydro based or thermal based. To the extent that the system already has peaking
16 generation, new generation must be able to support the shape of the incremental
17 load requirements.
18 In the BC Hydro system, there is a significant amount of hydroelectric generation
19 that is built and operated in a peaker fashion, i.e., operated for limited hours each
20 day. The operational limits can be due both to reservoir sizes as well as equipment
21 ratings. It is estimated that the difference between operating such hydro for a 15
22 hour peak versus a 3 hour peak would reduce the effective capacity of the hydro
23 system by about 1,200 MW. As a result, additional generation that BC Hydro adds to
24 the system must be capable of sustained peak period operation.
25 As set out in BC Hydro’s response to T8TA IR ab_0001-116, BC Hydro’s load is
26 highest during the four month period from November through February, between 6
Site C Clean Energy Project
Page 14Rebuttal Evidence
With Respect to the Submissions of
Mr. Philip Raphals on Behalf of
Treaty 8 Tribal Association
1 pm and 10 pm during weekdays and Saturdays. A capacity resource should at a
2 minimum be capable of meeting BC Hydro’s load during this peak load period. A
3 generator running at full capacity during this time period would have a capacity
4 factor of 18%. This reliance does not take into account other times of the year when
5 BC Hydro may face forced or maintenance outages on its other generating
6 resources. The 18 % does not include any additional reliance on the SCGTs to help
7 integrate intermittent clean or renewable resources that may be needed - particularly
8 in a scenario when the Project was not built as shown by the composition of the
9 Clean Generation and Clean + Thermal Generation portfolios.
10 Clean Energy Act
11 Relying on SCGTs for only a 5% capacity factor would mathematically result in being
12 able to build higher volumes of SCGTs – as much as 1,800 MW of new SCGTs -
13 however, those resources would not be able to be operated beyond the 5% planned
14 capacity factor and still meet the 93% clean or renewable objective. Relying on
15 1,800 MW of SCGTs that could only operate 5% of the time means that BC Hydro
16 would rely on the external market to meet system requirements. As noted in the
17 November 2013 IRP, section 6.2.2, a reliance on the market to meet the 93% clean
18 or renewable objective is inconsistent with the intent of the Clean Energy Act.
19 5.2 Site 7B
20 The Raphals Submission presents Site 7B as an available resource, and is
21 incorporated into the first of his two BRPs. Characteristics of Site 7B include:
Location ~ 39.5 kilometers downstream Peace Canyon Dam
Capacity 238 MW
Annual generation 1210 GWh
22 In its 8 May 2013 response to T8TA IR ab_0001-144, BC Hydro provided a UEC for
23 Site 7B and stated that it was not cost-competitive with available resource options
24 picked up by the Portfolio PV modelling for the Clean Generation and Clean +
Site C Clean Energy Project
Page 15Rebuttal Evidence
With Respect to the Submissions of
Mr. Philip Raphals on Behalf of
Treaty 8 Tribal Association
1 Thermal Generation portfolios. Site 7B has a higher adjusted UEC than the available
2 alternative resources. The adjusted UEC (excluding any capacity credit) for Site 7B
3 was provided by BC Hydro on 10 December at the public hearing as follows:
4 $200/MWh to $255/MWh.22 As a result, the inclusion of Site 7B in the Portfolio PV
5 modelling analysis would not change the analysis – it has a higher cost than the
6 resources selected in the Clean Generation and the Clean + Thermal Generation
7 portfolios.
8 5.3 DSM Capacity Initiatives
9 The Raphals Submission at section 3.2.1 identifies theoretical savings for three DSM
10 capacity initiatives - industrial load curtailment, capacity-focused DSM programs and
11 ToU rates - and declares these to be achievable, albeit with some adjustments.
12 In section 5.4.2.4 of the EIS, BC Hydro set out its reasons why it considers that
13 industrial load curtailment and capacity focused DSM initiatives are not viable
14 alternatives to the Project. As discussed in section 3.2 of this Rebuttal Evidence and
15 as noted by the Raphals Submission, the consequences of capacity shortfalls are
16 more severe than energy shortfall. In the approved November 2013 IRP, BC Hydro
17 identified actions to explore industrial load curtailment and DSM capacity options,
18 but deliberately has not included those resources in its planning resource stack until
19 there is sufficient evidence that BC Hydro would be able to elicit the needed
20 customer response and that the delivered capacity savings product did in fact
21 remove the need to build additional supply-side capacity resources. 23
22 Further details concerning load curtailment, capacity-focused DSM programs and
23 industrial customer ToU rates are set out below.
24 Industrial Load Curtailment
22
Transcript, Volume 2, 10 December 2013, page 72, lines 4-9.
23
November 2013 IRP, supra, note 10, section 9.2.2.
Site C Clean Energy Project
Page 16Rebuttal Evidence
With Respect to the Submissions of
Mr. Philip Raphals on Behalf of
Treaty 8 Tribal Association
1 An industrial load curtailment program would target large customers who agree to
2 curtail load on short notice to provide BC Hydro with capacity relief during peak
3 periods. The IEPR in background paper on ‘Industrial Time of Use Rates’ made the
4 following comments:
5 Curtailment programs have been tried in BC. … [C]urtailment
6 programs have usually not been successful in BC. In general, this
7 reflects the fact that most industrial processes are relatively inflexible
8 and rely on an enormous capital investment. As such, they are
9 relatively unresponsive to the modest short-term signals that these
10 programs tend to offer. That is because even large changes in
11 electricity prices tend to be overwhelmed by other considerations
12 unless these price effects apply consistently over a large period of
13 time, so that they can be accommodated into the industrial processes
14 cost effectively. 24
15 To this BC Hydro would add that for load curtailment to be considered a long-term
16 planning resource that could be relied on to meet the need for capacity, industrial
17 customers would have to meet a set of conditions which can be grouped into the
18 following categories:
19 • Price, which would be managed against BC Hydro’s lowest cost B.C.-based
20 capacity supply alternative, Revelstoke Unit 6, with a UCC of $50 kW-year;
21 • The required number of curtailment events per year; and
22 • The required duration of curtailment, which would also likely include terms
23 regarding the amount of energy to be shed, the notice period, the minimum
24 period between curtailment events and the period available for curtailment. 25, 26
24
Available at
www.empr.gov.bc.ca/EPD/Documents/Task%20Force%20Issue%20Paper%20-%20Time%20of%20Use%20
Rates%20FINAL.pdf.
25
Transcript, Volume 1, 9 December 2013, page 103, lines 17-25.
26
BC Hydro would also require a minimum contract commitment and notice of termination provision (estimated
to be 5 years) given the 4 plus year lead time to acquire and build alternative supply-side resources.
Site C Clean Energy Project
Page 17Rebuttal Evidence
With Respect to the Submissions of
Mr. Philip Raphals on Behalf of
Treaty 8 Tribal Association
1 BC Hydro’s approach of pursuing a voluntary industrial load curtailment program
2 from F2015 to F2018 to determine how much capacity savings can be acquired 27
3 and relied on for the long-term is the prudent course, in contrast to the Raphals
4 Submission approach of assuming that such a program will deliver capacity savings
5 and should be relied on in combination with other DSM exclusively to meet
6 BC Hydro’s need for capacity for most of the 20 year planning period.
7 Capacity Focused DSM Programs
8 The capacity-focused DSM programs were BC Hydro’s first attempt to identify
9 potential demand response and load control opportunities from residential and
10 commercial customer classes. The development of these capacity-focused DSM
11 saving estimates is an area, unlike DSM programs that target energy and capacity
12 savings, where BC Hydro has little or no experience. The assessment contemplated
13 finding three hour blocks of demand curtailment largely based upon economic
14 factors. It is unknown the extent to which customers will be willing to accepted or
15 implement alternative behaviors or changes in services to earn the potential
16 economic benefits.
17 BC Hydro has not had the opportunity to assess how likely and consistent any
18 response would be and how that would be combined with system operations
19 including market trade and integrating renewable resources. BC Hydro intends to
20 pilot capacity-focused DSM programs (direct load control) for residential, commercial
21 and industrial customers over two years, starting in F2017. In this regard, the
22 uncertainties of participation and savings per participant may be greater with these
23 pilot programs than with voluntary load curtailment. This further underscores the
24 importance of BC Hydro’s strategy to test these programs starting in F2015 to
25 determine how many capacity savings can be acquired.
26 Customer ToU Rates
27
November 2013 IRP, supra, note 10, Recommended Action 2, section 9.2.2, pages 9-20 to 9-23.
Site C Clean Energy Project
Page 18Rebuttal Evidence
With Respect to the Submissions of
Mr. Philip Raphals on Behalf of
Treaty 8 Tribal Association
1 The Raphals Submission attempts to portray BC Hydro as having changed its view
2 of ToU rates between the draft May 2012 IRP and the 2013 IRP. The Raphals
3 Submission at page 21 calls attention to a footnote from the 2013 IRP concerning
4 what is characterized as the “disappearance of ToU rates from the 2013 IRP”. The
5 same footnote appears on page 3-12 of the draft May 2012 IRP:
6 At the time of the 2010 ROR development, BC Hydro also considered
7 Time-Based as a category of capacity option; since then, in
8 accordance with government policy, BC Hydro has no plans to
9 implement Time-Based Rates to address capacity requirements.
10 The Raphals Submission ToU rates are taken from the unapproved draft May 2012
11 IRP. Figure 3-4 of that document shows the estimated savings potential for
12 residential and commercial customer ToU rates, and does not include industrial ToU
13 rates. Any potential for industrial customers to modify their operations in response to
14 ToU rates was captured in the industrial load curtailment option. 28
15 As Mr. Raphals acknowledges, the then Minister of Energy and Mines ruled out ToU
16 in 2011, and it was only by letter dated 19 June 2013 29 that the Minister requested
17 that the IEPR consider the feasibility of ToU rates for industrial customers only. The
18 letter is clear: “[t]his review is to stay strictly within the bounds of industrial
19 customers only” [emphasis added]. It continues to be B.C. Government policy that
20 ToU rates are not an option to be considered by BC Hydro for its residential and
21 commercial customers. This eliminates the ToU potential identified at page 21 of the
22 Raphals Submission for the reasons set out in the preceding paragraph.
23 BC Hydro has had a ToU rate for industrial customers – Rate Schedule (RS) 1825,
24 in place since 1 April 2006. There is a required three year commitment. No industrial
28
Transcript, Volume 1, 9 December 2013, page 103, lines 4-25.
29
Available at:
www.empr.gov.bc.ca/EPD/Documents/Letter%20from%20Minister%20Bennett%20to%20IEPR%20Task%20
Force.pdf.
Site C Clean Energy Project
Page 19Rebuttal Evidence
With Respect to the Submissions of
Mr. Philip Raphals on Behalf of
Treaty 8 Tribal Association
1 customer has exercised the option to use RS 1825. 30 There are two key reason why
2 no industrial customer has elected to use RS 1825: (1) RS 1825 does not provide
3 sufficient ToU price differentials to incent customers to shift load; and (2) industrial
4 customers would need to have sufficient flexibility in their production processes to
5 shift load from winter heavy load hours to light load hour periods, or from winter to
6 spring or remainder months. Customers who are ‘best-suited’ to a ToU rate have the
7 following attributes: they use a continuous process; they have large, discrete load
8 centres; they have sophisticated load control systems; and they have a product
9 storage ability to ‘make-up’ lost production. Industrial customers with these attributes
10 are only a subset of overall industrial customers, such as thermo-mechanical pulp
11 mills and electrochemical plants.
12 The IEPR picked up on these themes in its background paper on ‘Industrial Time of
13 Use Rates’. The IEPR reviewed the Pacific Gas and Electric ToU in California, and
14 noted the strong price signal required, which the IEPR suggested may mean “a
15 relatively inelastic industrial sector that requires large price signals to prompt a
16 demand response (although this can only be inferred from the rate)”. 31
17 The B.C. Government response to the IEPR report concerning industrial customer
18 ToU rates suggests that any such ToU rate may be voluntary. 32 There remains
19 significant uncertainty as to the potential for industrial customer ToU rates, and
20 design issues such as potential revenue volatility for BC Hydro depending on the
21 level of industrial customer response, the overall complexity, required margins, price
22 risk and term commitment combine to make such ToU rates challenging.
30
Transcript, Volume 1, 9 December 2013, page 102, line 23 to page 103, line 3; refer also to page 34 of
Attachment 2 to BC Hydro’s response to JRP Further IR #1 (CEAR #1705).
31
Supra, note 24.
32
Supra, note 16, Item #13.
Site C Clean Energy Project
Page 20Rebuttal Evidence
With Respect to the Submissions of
Mr. Philip Raphals on Behalf of
Treaty 8 Tribal Association
1 5.4 DSM Option 3
2 Subsection 2(d) of the Clean Energy Act provides that it is “British Columbia’s
3 energy objective” to “take demand-side measures and to conserve energy, including
4 the objective of [BC Hydro] reducing its expected increase in demand for electricity
5 by the year 2020 by at least 66%”. The DSM Target anticipates 7,800 GWh/year of
6 energy savings and 1,400 MW of associated capacity savings by F2021. The DSM
7 Target, even with the short-term energy savings and expenditure reductions
8 discussed below, is anticipated to reduce BC Hydro’s forecasted demand for energy
9 by 78% in F2021. 33
10 DSM Option 3 targets 8,300 GWh/year of energy savings and 1,500 MW of
11 associated capacity savings by F2021. As described in section 5.2.3 of the EIS,
12 DSM Option 3 targets more electricity savings by expanding DSM program efforts,
13 while keeping the level of activity for savings from codes and standards, and
14 conservation rate structures, the same as the DSM Target. DSM Option 3 program
15 activity was expanded based on allowing program cost-effectiveness to increase
16 beyond BC Hydro’s current Long-Run Marginal Cost of $85/MWh to $100/MWh. 34
17 The Raphals Submission at pages 28 to 29 references the August 2013 IRP to
18 contend that BC Hydro dismissed DSM Option 3 because “it is incompatible with the
19 DSM reductions that are the preferred solution to the short-term surplus”. This is not
20 correct:
21 • BC Hydro explained in section 3.3.1 of the November 2013 IRP that while it
22 adjusted near term expenditures and savings for the DSM Target and DSM
23 Option 1 35 in light of the short-term surplus, it did not reduce near-term
33
Refer to the 8 May 2013 Technical Memo: Demand-Side Management, page 2; CEAR #1446, a copy of
which is also found as an attachment to the Evidentiary Update, CEAR #1574.
34
November 2013 IRP, supra, note 10, page 3-21.
35
DSM Option 1 was developed to explicitly meet 66% of the forecasted load growth with DSM, which would be
the minimum required to meet the Clean Energy Act objective of reducing BC Hydro’s “expected increase in
demand for electricity by the year 2020 by at least 66%”. DSM Option 1 targets 6,100 GWh/year of energy
Site C Clean Energy Project
Page 21Rebuttal Evidence
With Respect to the Submissions of
Mr. Philip Raphals on Behalf of
Treaty 8 Tribal Association
1 expenditures and savings for DSM Option 3 due to deliverability risk in
2 recovering to DSM Option 3 savings levels (there is significant uncertainty
3 regarding the ramp rate assumptions, that is, the ability to ramp back up to
4 achieve longer-term DSM Option 3 energy savings); and
5 • As is clear from both section 3.2.2 of the Evidentiary Update and section 6.3.4.2
6 of the 2013 IRP, BC Hydro conducted Portfolio PV modelling analysis to
7 determine if DSM Option 3 would be a lower cost potential alternative to the
8 Project. This was done by combining DSM Option 3 with the portfolio having the
9 lowest PV cost as between the alternative portfolios – the Clean + Thermal
10 portfolio. The results in Table 13 of the Evidentiary Update show that a portfolio
11 with the DSM Target and the Project at its earliest in-service date of F2024 has a
12 PV cost benefit of $320 million when compared to a portfolio combining DSM
13 Option 3 with Revelstoke Unit 6 and G.M. Shrum Units 1-5 Capacity Increase
14 and SCGTs within the Clean Energy Act’s 93% clean or renewable target.
15 The Raphals Submission at page 31 quotes DSM Option 3’s average Utility Cost of
16 $22/MWh from the August 2013 IRP, and compares this to the Project adjusted UEC
17 of $94/MWh to declare that DSM Option 3 is “so much less expensive than Site C”.
18 The proper comparison is between the incremental UEC of DSM Option 3 of about
19 $75/MWh on a Total Resource Cost (TRC) basis and the adjusted Project UEC with
20 a capacity credit of $83/MWh. The Utility Cost test for DSM does not disclose all the
21 costs associated with DSM initiatives; the Utility Cost defines costs exclusively in
22 terms of costs incurred by the public utility administrator and thus reflects only a
23 portion of the full costs of the DSM resource. The net TRC is more appropriate 36
savings and 1,200 MW of associated capacity savings by F2021; November 2013 IRP, supra, note 10,
section 3.3.1.1.
36
The TRC is the primary test applied to assess the cost-effectiveness of DSM initiatives. The net TRC includes
reductions in public utility capacity costs, and inclusion of customer non-energy benefits and avoided
non-electric fuel costs; refer to the “Additional Information: Demand Side Management and Total Resource
Cost Test” forming part of BC Hydro’s response to JRP Additional IR Request #1, CEAR #1705. Note that
this responds to T8TA’s comment on the treatment of DSM found at section 7 of T8TA’s IRP-related
submission (Appendix B of the Raphals Submission).
Site C Clean Energy Project
Page 22Rebuttal Evidence
With Respect to the Submissions of
Mr. Philip Raphals on Behalf of
Treaty 8 Tribal Association
1 because the TRC measures the overall economic efficiency of a DSM initiative from
2 a resource options perspective based on the initiatives’ total cost including both
3 customer participant and the public utility’s costs.
4 BC Hydro’s response to JRP IR 25 37 (CEAR #1624) at page 2 sets out the Project
5 adjusted UEC of $83/MWh. The adjusted UEC for the Project without a capacity
6 credit is $94/MWh, and with a capacity credit is $83/MWh. Given that the net TRC
7 for DSM Option 3 includes reductions for capacity benefits, the Project adjusted
8 UEC of $83/MWh with the capacity credit is the appropriate comparator. Note that
9 the adjusted Project UEC would decrease by a further $2/MWh if the seasonal, daily
10 and hourly shaping capability of the Project is accounted for. 38
11 6 Base Resource Plans
12 BC Hydro’s review focuses on two resources used in the Raphals Submission BRPs
13 (referred to as BRP1 and BRP2):
14 • On the energy side, reliance on external market energy purchases contrary to the
15 requirement to be self-sufficient pursuant to section 6 of the Clean Energy Act;
16 and
17 • On the capacity side, reliance on DSM to meet all of BC Hydro forecasted
18 demand for capacity to virtually the end of the planning period in F2033.
19 Each of these resources is addressed in turn.
20 6.1 External Market Energy Reliance
21 The Raphals Submission is clear that external “market purchases” are an energy
22 resource used in both of BRP1 and BRP2. For example, the energy graphs shown in
23 Figure 24 (with respect to BRP1) and Figure 25 (with respect to BRP2) contain a
37
CEAR #1624.
38
Refer to BC Hydro’s response to JRP IR 77-A, page 9, footnote 1 to Table 3 (CEAR #1645).
Site C Clean Energy Project
Page 23Rebuttal Evidence
With Respect to the Submissions of
Mr. Philip Raphals on Behalf of
Treaty 8 Tribal Association
1 resource entitled “market purchases”. BC Hydro estimates that BRP1 and BRP2
2 contain about 2,000 GWh and 3,000 GWh of external market purchases by F2033,
3 respectively. 39
4 The Raphals Submission explains at page 53 that “additional energy has been
5 provided through market purchases … to avoid the difficulty of modelling additional
6 clean resources”. BC Hydro fails to understand why the UEC of the energy
7 resources selected in the Clean Energy Generation Block of $125/MWh could not be
8 used a proxy. In any event, what is clear is that BRP1 and BRP2 are not viable
9 resource plans and could not be implemented by BC Hydro due to the reliance on
10 external market energy. As summarized in section 5 of this Rebuttal Evidence,
11 external market/import energy does not meet the section 6 Clean Energy Act
12 self-sufficiency requirement because it is not energy “solely from electricity
13 generating facilities within the Province”.
14 In addition, inserting external market energy instead of B.C.-based clean or
15 renewable resources artificially reduces the cost of BRP1 and BRP2. In his oral
16 presentation on 10 December 2013, Mr. Raphals advanced that he did not think
17 what he called the “short cut” of inserting external market purchases in lieu of
18 B.C.-based clean or renewable resources would “have a significant effect on the
19 bottom line”, and that the “cost difference is probably small compared to the big
20 picture”. 40 BC Hydro disagrees with these statements, which are contradicted by the
21 evidence on the record. As described in section 5 of this Rebuttal Evidence, external
22 spot market energy is forecast to be far lower in price than B.C.-based energy
23 resources. BC Hydro’s mid electricity forecast (Market Scenario 1) shows spot
24 market energy at about $39/MWh (CAD, $F2013) in 2030 compared to
25 $124/MWh-$125/MWh for clean or renewable IPP resources.
39
These external market reliance estimates were put to Mr. Raphals during questioning, and he stated that the
2,000 GWh and 3,000 GWh estimates were “possible”; Transcript, Volume 2, 10 December 2013, page 148,
line 2 to page 149, line 2.
40
Transcript, Volume 2, 10 December 2013, page 132, lines 11-14.
Site C Clean Energy Project
Page 24Rebuttal Evidence
With Respect to the Submissions of
Mr. Philip Raphals on Behalf of
Treaty 8 Tribal Association
1 6.2 DSM Reliance for Capacity
2 The starting point for a discussion of DSM reliance for meeting the forecasted need
3 for capacity is what BC Hydro plans to do through its own BRP. BC Hydro
4 anticipates 1,400 MW of capacity savings in F2021 through pursuit of the DSM
5 Target. As described in section 5.2.3 of the EIS, the DSM Target represents about
6 85% of the capacity load-resource gap in F2021. The DSM Target is aggressive and
7 entails delivery risks – particularly that the anticipated capacity savings will not be
8 delivered within the specified time frame.
9 Ensuring an adequate capacity supply is the primary concern for BC Hydro, since
10 capacity is required at specific times to meet peak load requirements and to maintain
11 system security and reliability. Capacity resources also support intermittent clean or
12 renewable generation resources that primarily supply energy so that generation is
13 available when the loads require it. The consequence of the DSM Target not
14 delivering the anticipated 1,400 MW of dependable capacity savings by F2021 is
15 greater as compared to failure to deliver the anticipated energy savings. As
16 described in section 3.3 of the Rebuttal Evidence, relying on the external market
17 during winter peaks presents significant risks.
18 Mr. Raphals would have BC Hydro rely exclusively on DSM to meet the capacity gap
19 for much of the time period under consideration. To take BRP1 as an example, in
20 F2027 100% of the capacity gap is met with DSM 41 – a combination of DSM
21 Option 3 and three DSM capacity initiatives (load curtailment, DSM capacity-focused
22 programs and ToU rates). The Raphals Submission proposes to meet all capacity
23 requirements for the next fourteen years by relying only on DSM capacity savings,
24 including a number of DSM sources that BC Hydro finds to be inappropriate to
25 include in its stack for dependable capacity.
41
During questioning, Mr. Raphals agreed that In F2027, he filled the capacity gap entirely with DSM;
Transcript, Volume 2, 10 December 2013, page 145, lines 18-23.
Site C Clean Energy Project
Page 25Rebuttal Evidence
With Respect to the Submissions of
Mr. Philip Raphals on Behalf of
Treaty 8 Tribal Association
1 6.3 BRP Evaluation Period
2 As shown in Figure 26 of the Raphals Submission, the two BRPs and resulting PV
3 costs presented are evaluated for a 20-year period ending in F2033. This is a
4 shorter period than used in BC Hydro’s Portfolio PV modelling analysis conducted
5 for the EIS and IRP, both of which use a 30-year period ending in F2041. As a
6 result, the Raphals Submission analysis evaluates less than 10 years of the
7 Project’s 70-year economic planning life, and only the period during which a portion
8 of the energy generation is surplus.
9 As a result of using a truncated evaluation period and the external market and DSM
10 reliability issues raised above, the PV differentials shown by Mr. Raphals in Figure
11 27 are . This short-term analysis does not recognize the long-term benefits of the
12 Project – namely, the avoided cost of higher-price B.C.-based alternative energy
13 resources.
14 7 Small Gap/Large Gap Scenarios
15 In sections 4.2 and 4.3 of the Raphals Submission, alternative portfolios are
16 provided for small gap and large gap scenarios. For the small gap scenario at
17 page 70 of the Raphals Submission, it is noted that “BC Hydro did not actually
18 present a base resource plan that follows its low load scenario”. BC Hydro does not
19 plan resource acquisitions using either the large or small gap forecasts, but rather to
20 the mid-level (reference) forecasts as required by self-sufficiency and the Electricity
21 Self-Sufficiency Regulation. 42 A BRP is by definition the plan to meet the base case
22 or mid-level need. It is imprudent to plan a system to a low need situation and not be
23 able to meet the load on an expected basis.
24 As discussed on page 10 of the response to JRP IR 77A and on page 6-46 of the
25 November 2013 IRP, the low gap scenario has a probability of about 10%. BC Hydro
42
Section 2 of the B.C. Reg. 315/2010, as amended by B.C. Reg. 16/2012; refer to section 5.2.1.1 of the EIS.
Site C Clean Energy Project
Page 26You can also read


