The Impact of Instant Messaging on the Energy Consumption of Android Devices
←
→
Page content transcription
If your browser does not render page correctly, please read the page content below
The Impact of Instant Messaging on the Energy
           Consumption of Android Devices
                                     Stylianos Rammos, Mansi Mundra, Guijing Xu,
                                    Chuyi Tong, Wojciech Ziolkowski, Ivano Malavolta
                                      Vrije Universiteit Amsterdam, The Netherlands
                { s.l.rammos | m.mundra | g.xu | c.tong | w.m.ziolkowski }@student.vu.nl, i.malavolta@vu.nl

   Abstract—Context. One of the primary uses of mobile devices        a mobile application is running, the energy consumption not
is to send and receive instant messages via messaging apps.           only depends on the installed code, but also on how the
However, no evidence is still available about how receiving instant   user interacts with the application [27]. For example, the
messages impacts the energy consumption of mobile devices.
Goal. With this study we aim to empirically assess to what extent     energy consumption of an IM application can be affected by
the number and distribution of received instant messages impact       the frequency and the number of instant messages sent and
the energy consumption of Android devices.                            received by the user with their contacts.
Method. The subjects of our experiment are WhatsApp and                  When considering IM apps running on mobile devices,
Telegram, two of the most known and used messaging apps. Each         instant messages are generally received as push notifications
run of the experiment lasts 5 minutes and is executed on a Nexus
9 Android device. The independent variables of the experiment         [1]. Push notifications are messages generated in the Cloud
are: (i) the frequency of the received messages (i.e., 0, 10, 25,     and asynchronously received by a mobile app. Intuitively,
50 per minute) and (ii) the distribution of messages arrival (i.e.,   Android push notifications work as follows. On the Android
evenly or in bursts). The dependent variable of the experiment        platform, there are a lot of services that provide push notifica-
is the energy consumption of the Android device in Joules.            tions functions for devices powered by the Android operating
Results. We confirm that the energy consumption of the Android
device tends to be proportional with the number of received mes-      system. Most of those services are basically the Firebase Cloud
sages across both apps. When the number of received messages is       Messaging (FCM) services. In order to push messages, the
fixed, the frequency of their arrival does not significantly impact   FCM needs to be integrated into the application. To push
the energy consumption of the Android device.                         messages, a third-party server (e.g, WhatsApp server) sends
Conclusions. This study provides evidence that receiving instant      a message request to the mobile notification service’s (e.g.,
messages can largely reduce the battery life of a user’s Android
device, even when the number of received messages is relatively       FCM) server. After that, the mobile notification service’s
low (i.e., 10 messages per minute). Moreover, sending bursts of       server transmits the request to the user’s device. In its turn, the
messages does not lead to significant changes in terms of energy      Android operating system running onboard the device checks
consumption. Developers can use this information to develop           the received information to associate it to the corresponding
new features for their Instant Messaging apps for aggressively        application and display it to the user.
bundling messages without the risk of impacting the energy
consumption of end users’ devices.                                       For instant messaging applications, push notifications usu-
   Index Terms—Empirical study, Energy consumption, Android,          ally include notification icon in the status bar, messages in
Instant messaging                                                     the notification drawer, heads up notification (from Android
                                                                      5.0) and lock screen notification display (from Android 5.0).
                       I. I NTRODUCTION                               There are a few factors in message reception which can
   Today, more and more people tend to use mobile devices at          effect the energy consumption of a device, such as the setting
a high frequency for social interaction from everywhere and at        of volume and vibration, the frequencies and distribution of
any time. Therefore, mobile instant message (IM) applications         messages received, and also, the post limit. To reduce the
continue to rise in popularity and play an important role in          interruption from the notifications, developers usually tend
users’ social life. For instance, WhatsApp, which is one of           to group the separate notifications into a group (available on
the most popular messaging applications worldwide, has two            Android 7.0 and higher), which means that the group allows
billion active users on a monthly basis as of July 2020 [11].         users to collapse multiple notifications into just one post in the
   At the same time, energy consumption has gradually be-             notification drawer. The user can then expand the notification
come a major challenge for developers and mobile device               to reveal the details for each individual notification [2].
vendors since it can have a significant effect on user expe-             The goal of this study is to assess the impact of instant
rience. For instance, users have an Always-on mentality [5]           messaging on the energy consumption of Android devices.
and might need to frequently charge their mobile devices or           Specifically, we empirically assess to what extent the num-
even plug in mobile power banks if the battery runs low               ber and distribution of received instant messages impact the
quickly. Not only the hardware (e.g., the display, cameras,           energy consumption of Android devices running IM apps.
network antenna) consumes energy, but also the software can              The design of the experiment is based on the following
affect the energy consumption of mobile devices [22]. When            experimental variables. The independent variables of the ex-
periment are: (i) the frequency of received messages (i.e., 0, power consumption. Switching between them depending on
10, 25, 50 per minute) and (ii) the distribution of arrival of the the context turned out to be more energy efficient. Our study
messages (i.e., evenly or in bursts). The dependent variable of complements the work by Burgstahler et al. since we target
the experiment is the energy consumption of the Android de- the number and distribution of messages receiving via a
vice in Joules. The subjects of our experiment are WhatsApp1 push-notification communication mechanism, which is the one
and Telegram2 . With a total number of monthly active users of officially employed by the Android platform.
2.4 billion in July 2020, WhatsApp and Telegram are two of Chowdhury et al. [10] studied whether maintaining the
the most widely-used messaging applications in the Android logs created by the applications to monitor their behaviour
app store [11]. Each run of the experiment has a fixed duration impacts battery performance. In order to profile the tested
of 5 minutes and it is executed on a real mobile device (i.e., an applications, GreenMiner was used. The study found that in
HTC Nexus 9). After having collected the measurement data most applications logging has little to no impact on the energy
for more than 300 independent runs, we statistically assess consumption, however in about 80% of cases there was at least
how energy consumption varies according to our empirical one version of an application that impacted the battery in a
variables. significant manner. Although this paper focuses on a different
The main results of this study are that receiving instant aspect of mobile application profiling, the goals of measuring
messages can largely reduce the battery life of a user’s the energy usage and empirical methodology are similar.
Android device, even when the number of received messages Acer et al. [3] focused on energy efficient scheduling of
is relatively low (i.e., 10 messages per minute). Moreover, push notifications. It argues that due to the sporadic nature of
the study provides evidence that receiving instant messages such messages and very small size, sending them immediately
either in bursts or evenly over time does not lead to significant to the users device comes with a large cost to both energy
differences in terms of energy consumption. consumption and network load. The authors come forward
The target audience of this study is composed of both end with the network-centric scheduling of push notifications that
users and developers. Indeed, the results of our experiment are delays their delivery based on the predictions of users’ network
relevant for both end users and developers alike. Specifically, activities, allowing for sending multiple push messages at once
we discover that (i) receiving instant messages can largely instead of multiple messages over time. Although the overall
reduce the battery life of a user’s Android device, even when goals of the paper differ from ours, it allows for more in-depth
the frequency of received messages is relatively low (i.e., 10 analysis of the network cost of push notifications. The energy
messages per minute) and (ii) receiving bursts of messages needed to receive the push notification in a low coverage area
does not lead to a statistically significant difference in terms where the phone might operate using more broadcasting power
of energy consumption. for a longer duration to communicate with the remote server
The remainder of this paper is structured as follows. Section through the base station might be one of the factors leading
II discusses related work and the study design is reported in to increased energy usage.
Section III. The results of the study are reported in Section Ding Li et al. analysed the energy consumption of Android
V and discussed in Section VI, whereas threats to validity are applications analysing 405 real world market applications [21].
elaborated in Section VII. Section VIII closes the paper. One of the outcomes of the analysis is that 61% of their energy
consumption occurs during their idle states with network being
II. R ELATED W ORK the most energy consuming component. Even though our paper
Burgstahler et al. analysed the energy consumption of two specifically targets push notifications, it is complementary to
types of mobile communication approaches: push notifications the one by Ding Li et al. since we consider different workloads
and pull-based notifications [7]. The study covers in depth the and workload distributions of message reception during our
evaluation of the energy impact on mobile devices of classic experiment.
push notifications and compares them with a new solution Yongmin Choi et al. [9] argues that new mobile applications
proposed by the authors. In order to obtain precise results, cause frequent changes between connected and idle states
the researchers used an external measurement device. The of the radio equipment in the mobile devices leading to
original battery was separated from the device and connected increased power consumption. Although this work focuses on
to special dummy battery in the phone with modified charging the network aspects of the applications it shows again that
cradle in-between to intercept the power connection between the idle activity of mobile apps can bear heavy impact on the
the battery and the device. For push notifications, Google battery life of mobile devices.
Cloud Messaging was used in encrypted and non-encrypted
III. S TUDY D ESIGN
versions. The results of the study revealed that up to 7%
improvement in battery consumption can be achieved by This section presents the main points of the study design.
switching between the push and pull communication approach We refer the reader to the replication package of the study3
since they have different impacts on notification latency and for more details on the research method, tools, and collected
data. The replication package contains all the information for
1 https://play.google.com/store/apps/details?id=com.whatsapp
2 https://play.google.com/store/apps/details?id=org.telegram.messenger 3 https://github.com/S2-group/mobilesoft-2021-replication-packageindependent verification and replication of the study, namely: typically receive a large number of messages. The literature
(i) the Python scripts for executing the experiment, (ii) the raw already confirmed that bundling HTTP requests reduces energy
data containing all the measures collected during the execution consumption without imposing significant runtime overhead in
of the experiment, (iii) the R scripts for analysing the collected Android apps [24]; our answer to RQ2 will fill a similar gap
data, and (iv) a detailed guide for replicating the experiment. in the context of push notifications.
To provide an answer to this research question, we once
A. Goal and Research Questions again measure the energy consumption of WhatsApp and
We define the goal of this study by following the template Telegram. However, this time the messages are received in
presented by Wohlin et al. in [32]. Table I shows our goal short bursts, such as the total amount of messages received
formulation. remains the same but they are received in short periods of
Object of study IM app’s message reception time rather than evenly distributed. The idle state trials will
Purpose Assessing remain the same.
Quality of focus Energy Consumption
Perspective End users and app developers B. Subjects Selection
Context Android mobile devices
In order to produce results as close to the real-world use
TABLE I: Goal definition of our study case scenario we have decided to use two popular messaging
applications – WhatsApp and Telegram [11]. They have been
To achieve the aforementioned goal, this study aims to chosen due to (i) their popularity and (ii) the availability
provide a clear and accurate response to the two research of well-documented tools for programmatically sending mes-
questions depicted below. sages to them (see Section IV); the latter point is particularly
RQ1: What is the impact of receiving messages in IM apps at important for the viability of the experiment, where we need
different frequencies on the energy consumption of Android to reliably send several hundreds of messages during the
devices? execution of the experiment.
Answering this research question helps app users in making
better choices on using IM applications, e.g., by choosing the C. Experimental Variables and Hypotheses
ones that fit better the typical amount of received messages. This experiment has two independent variables, one for each
App developers and Android maintainers can benefit from our research question. For RQ1, the independent variable is the
answer to RQ1 because they will obtain evidence about how frequency of the messages received by the application for
receiving IM-related push notifications can impact the energy the whole duration of the run (i.e., 5 minutes). We defined
consumption of an Android device under different workloads. four treatments for this variable, namely:
To answer this question, we compute the energy consump- • Idle: the IM app does not receive any messages during
tion of messages received by two messaging applications. the whole duration of the run, it acts as the baseline for
More specifically, those applications are WhatsApp and Tele- our experiment;
gram. Those applications were selected based on their wide • Low: the IM app receives 10 messages per minute;
global popularity and their ability to perform automated mes- • Medium: the IM app receives 25 messages per minute;
saging; a crucial requirement for conducting the experiment. • High: the IM app receives 50 messages per minute;
The energy consumption is measured within a specific window
For every treatment, messages are always randomly distributed
of time for a set number of messages, received evenly at fixed
over the 1-minute time window.
time intervals. Those trials will be referred to as active state
For RQ2, the independent variable is the distribution of
trials and the measurements taken during those trials (for each
arrival of the messages within a time window of one minute.
application) will be normalized using the measurements of idle
This variable has two treatments:
state trials, referred to as the trials during which no messages
are received but where the application runs in background. • Even: in every minute of the run, messages are received
RQ2: What is the impact of receiving messages in IM apps with an even distribution over time;
with different distributions on the energy consumption of • Burst: messages are received all at once at the beginning
Android devices? of every minute of the run.
By answering this research question we offer insights on It is important to note that, in order to be able to observe
the potential impact of bulk message reception on energy possible effects of the distribution of arrival of messages, for
consumption. It is usual behavior to have messaging appli- RQ2 we are always sending 50 messages per minute.
cations running in the background and receiving messages as For both RQ1 and RQ2, the dependent variable is the
they come, on a continuous basis. In this study, we compare energy consumption in Joules of the Android device. We
this behaviour to the one where the time between messages measure energy consumption by using Trepn, a software-based
is larger, but they arrive in bulk. The insights gained from power profiler for Android devices. Trepn is widely used in
such comparison can help developers in taking better informed empirical studies on energy-efficient software [26], [13], [19]
decisions about how to issue push notifications to users (e.g., and it has been reported as sufficiently accurate with respect
by aggressively bundling them), specially to the ones who to hardware power measurement (e.g., the Monsoon PowerMonitor4 ), with an error margin of 99% [18]. The energy For answering RQ1 we adopt a randomized complete design
consumption E of each run of the experiment is computed by [32]. Having a complete design allows us to investigate all
(i) measuring the average power P consumed by the Android possible treatments in the context of all subjects. Table II
device (in microWatts) and (ii) applying the following formula presents the trials resulting from such design, where each
for obtaining the total amount of consumed energy in Joules treatment is applied to both the selected subjects (i.e., What-
during the 5-minutes window of each run: sApp or Telegram) in a random order for 30 times. We
repeated every trial of the experiment 30 times in order to
P take into account possible fluctuations of the measured energy
E=( )W × 300s (1)
106 consumption [4]. The estimated running time for answering
The null hypothesis for answering RQ1 states that the RQ1 is (2 × 4 × 30) × 5m = 1, 200m = 20h since we are
average energy consumption of the Android device does not considering 2 IM apps, 4 treatments, 30 repetitions per trial,
significantly differ across all frequencies of received messages; and 5 minutes per run.
we formally formulate it as follows.
TABLE III: Trials for answering RQ2 (examples)
H0RQ1 : µidle = µlow = µmedium = µhigh (2) even burst
WhatsApp 1st 2nd
where µ is the average energy consumption of the IM apps Telegram 2nd 1st
across the idle, low, medium, and high treatments of the 30 repetitions for each trial
frequency independent variable.
The alternative hypothesis for RQ1 states that the average We apply a randomized complete design also for answering
energy consumption of the device is significantly different RQ2 with one factor (i.e., the distribution of the received
for at least one pair of considered frequencies; we formally messages), two treatments (i.e., even and burst), and 2 subjects
formulate it as follows. (i.e., WhatsApp and Telegram). Table III shows the trials
used according to the mentioned design. The running time
for answering RQ2 is (2 × 2 × 30) × 5m = 600m = 10h. Also
HaRQ1 : ∃i, j ∈ {idle, low, medium, high} : µi ∕= µj ∧ i ∕= j in this case we repeat every trial 30 times.
(3)
E. Data Analysis
For RQ2, we are interested in the distribution of the arrival
of the messages and it states that the average energy consump- The data analysis related to each research question consists
tion of the Android device does not significantly differ when of three main phases: data exploration, hypothesis testing, and
receiving messages either evenly or in bursts; we formally effect size estimation.
formulate it as follows. In the data exploration phase we aim at obtaining a pre-
liminary understanding of the obtained energy measures. We
H0RQ2 : µeven = µburst (4) compute summary statistics of the obtained measures and
visualize them by means of density plots, box plots, and
The alternative hypothesis for RQ2 states that the average histograms.
energy consumption of the device is significantly different In the hypothesis testing phase we aim at answering the
when messages arrive with different distributions; we formally research questions of the study by applying statistical tests.
formulate it as follows. For RQ1 we plan to use the One-Way ANOVA statistical test
since our independent variable has more than two treatments.
H1RQ2 : µeven ∕= µburst (5) If the assumptions of the ANOVA test are not met, then we will
apply a non-parametric one, i.e., the Kruskal Wallis statistical
D. Experiment Design
test [20]. In order to identify which pairs of treatmets are
We designed this study so to investigate on each research significantly different, we apply the Dunn Test as post-hoc
question in isolation. This decision is due to the fact that analysis [15] (with Benjamini-Hochberg correction to reduce
(i) for each RQ we want to have a complete design (i.e., to the chances of Type-I errors). Differently, when answering
cover all combinations of subjects and treatments) and (ii) RQ2 we plan to use a statistical test fitting a 1-factor-2-
we want to keep the random distribution of message arrivals treatments study design, i.e., the paired t-test [29]. If the
when answering RQ1 (this is in contrast with the even/burst assumptions of the mentioned statistical test are not met by the
distributions we consider in RQ2). collected measures, then we apply a non-parametric statistical
test, i.e., the Wilcoxon Rank-Sum test [17]. All statistical tests
TABLE II: Trials for answering RQ1 (examples)
are executed with with α = 0.05.
idle low medium high Finally, we assess the magnitude of the differences among
WhatsApp 1st 3rd 2nd 4th
the considered treatments via the Cliff’s Delta effect size mea-
Telegram 2nd 1st 4th 3rd
30 repetitions for each trial sure [12]. The Cliff Delta is a non-parametric measure of effect
size for ordinal variables and it does make any assumptions
4 https://www.msoon.com about the distributions being compared. The values of the CliffDelta measures are interpreted according to the guidelines • Manufacturer: HTC
proposed by Grissom et al. [16] and reported according to the • Model: Nexus 9
following ranges: negligible, small, medium, and large [16]. • Android Version: 7.1.1
• CPU: Nvidia Tegra K1
IV. E XPERIMENT E XECUTION • Memory: 2 GB
This section provides the technical details of the infrastruc- Both the laptop and the Nexus 9 run under the same Wifi
ture we setup for executing the experiment, as well as the network with a speed of 100 Mbps. To ensure that the Wi-
various software tools and hardware devices we used. Fi conditions do not alter the results of the experiment, the
As shown in Figure 1, the main components for executing Nexus 9 and the laptop are the only devices connected to the
the experiment are three: (i) a laptop for executing the orches- network and they are always placed at the same distance from
tration logic of the experiment and for collecting the measures the Wi-Fi router. Further, we take special care in keeping the
from the Android device, (ii) an Android device for running execution environment as clean as possible, specifically: the
the subjects of the experiment, and (iii) the Cloud hosting the Nexus 9 is loaded with a clean installation of the Android OS,
APIs for delivering the instant messages. it has been configured so to do not perform any OS updates, all
For orchestrating the execution of all the runs of the third-party apps have been uninstalled, and push notifications
experiment we make use of Android Runner [25]. Android for apps different from Telegram and WhatsApp have been
Runner is a Python framework for automatically executing ex- disabled as well. The specific versions of the subjects of the
periments involving both native and web applications running experiments are reported below:
on Android-based devices. In accordance to Android Runner, • Telegram - v7.0.1 (released on 22.08.2020)
we define our experiment in a descriptive manner as a JSON • WhatsApp - v2.20.199.14 (released on 15.09.2020)
file, and then the full execution of the experiment is managed With the laptop connected to the Nexus 9, the first steps for
by the tool via a combination of Python scripts and Android executing a run of the experiment are: (i) to stop all previously
Debug Bridge (ADB) commands. running apps (step 1 in Figure 1) and (ii) to start the Trepn
In our experiment, Android Runner is executed on a laptop energy profiler (step 2). Trepn is distributed as an Android
running MacOS Catalina 10.15.6 with a 2.2 GHz 6-Core Intel application and, thanks to the private APIs provided by the
Core i7-8750H processor and 16Gb of memory. Qualcomm CPU mounted on the Nexus 9 device, it is able to
The technical specifications of the Android device on which accurately measure the energy consumed by the device itself.
the subjects are running are reported below. In this specific phase of the run, Trepn is active, but it is still
Fig. 1: Overview of the measurement infrastructure and performed steps while executing a run of the experimentnot profiling the energy consumed by the Nexus 9 device.
Then, in step 3 we (i) start the IM app to be measured (i.e.,
either WhatsApp or Telegram, depending on the plan of the 30
runs created by Android Runner) and (ii) start collecting data
about energy consumption via Trepn.
As shown in Figure 1, in addition to Android Runner, we
Frequency
20
use a series of python scripts to interact with each application’s
API and send messages programmatically (step 4-8). The
messages are sent using custom Python scripts interacting
with the application’s API, following the experiment planning 10
described previously. The decision to use custom Python
scripts was made to have full control over the experiment
execution and more flexibility on the time intervals between 0
each message. These scripts use the following Python libraries 0 50 100 150
for each IM app: Telethon for Telegram and Selenium for Energy consumption (J)
WhatsApp. Since WhatsApp does not provide a set of APIs
Fig. 2: Frequency of the energy consumption values (RQ1)
to programmatically send instant messages, we use a second
Android device to send the WhatsApp messages. The technical
specifications of the second device for sending WhatsApp
messages are not relevant for the experiment since they do not Figure 3 and Table V show a visualization and summary
have an effect on the energy consumption of device receiving statistics of the energy consumption of the Android device
the messages. across the four treatments of the distribution variable. We can
Finally, after 5 minutes of running-and-profiling time, the observe that the energy consumption of the Android device
current run is stopped and the data collected by Trepn is grows with the increase of the numbers of received messages
fetched and saved locally on the laptop (step 9). per minute.
In order to take into account the intrinsic variability of It is also interesting to note that: (i) the energy measures
energy measurement, we take the following precautions: (i) of the idle treatment are very compact, this can be considered
the order of execution of the experiment runs is randomized, as a good indication of the reliability of our measurement
(ii) the measurement of each IM app is repeated 30 times, (iii) infrastructure, and (ii) the variance of the energy measures
between each run the Nexus 9 remains idle for 2 minutes so increases when considering higher frequencies of arrival of
to take into account tail energy usage, i.e., the phenomenon instant messages, this phenomenon might be due to the best
where where certain hardware components of mobile devices effort model of Android push notifications or the platform/OS
are optimistically kept active by the OS to avoid startup energy managing push notifications differently (e.g., grouping); a deep
costs [23], and (iv) the IM apps are cleared before each run investigation of this phenomenon is left for future work.
so to reset their cache and persisted data.
150
V. R ESULTS
Energy consumption (J)
In this section we report the obtained results according to
the research questions of the study. 100
A. Impact of receiving IMs at different frequencies (RQ1)
50
Data exploration. Figure 2 and Table IV give an overview
of the energy consumed in each run of the experiment. The
average energy consumption of the devices in the time slot 0
of 5 minutes is 18.391 Joules, although there are some cases Idle Low Medium High
Frequency of messages
where the energy consumption is comparatively large (e.g.,
143.949 joules). The skewness of the energy consumption is Fig. 3: Energy Consumption for each treatment in RQ1
2.812, which implies that the data is not symmetrical.
TABLE IV: Descriptive statistics for RQ1
TABLE V: Energy Consumption for each treatment in RQ1
Energy (Joules)
Minimum 4.016 Energy Consumption (Joules)
Treatment
1st quartile 7.346 Mean Median Q1 Q3
Median 12.779 Idle 6.064959 5.231174 4.484845 5.907169
Mean 18.391 Low 13.530337 9.368802 8.648248 18.968561
3rd quartile 23.030 Medium 25.008157 16.140350 13.169032 30.774704
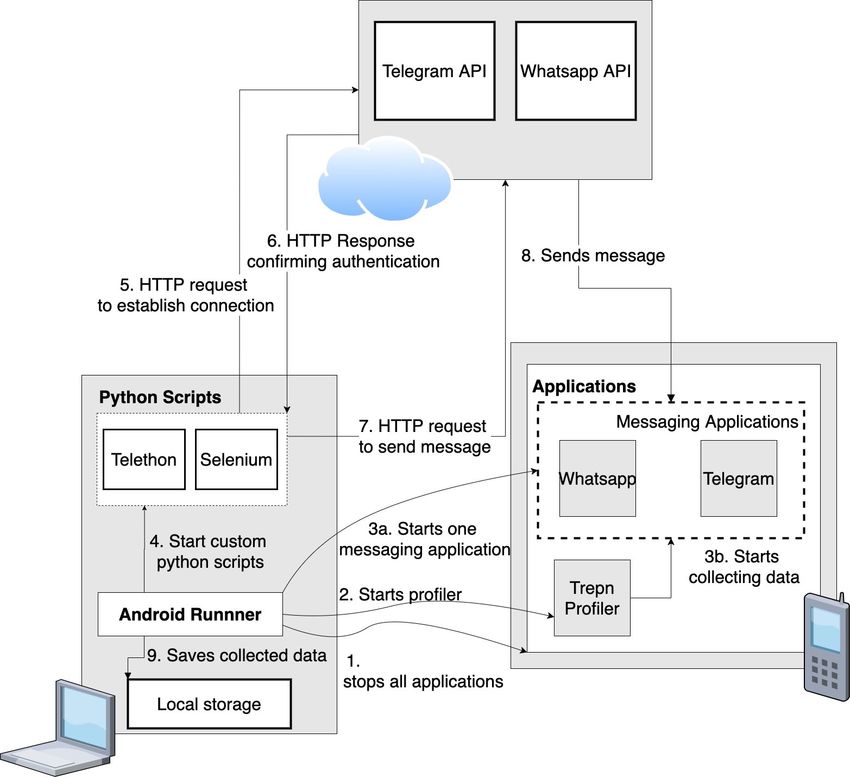
Maximum 143.949 High 28.960692 20.766082 16.098280 38.774762Figure 4 and Table VI present the measured energy con- Idle
sumption across the two subjects of the experiment. It can be 0.6 Telegram
seen that when the system is idle or with low workload, the WhatsApp
two apps consume a similar amount of energy. Differently,
Density
0.4
when the number of received messages is medium and high, 0.2
Whatsapp messages tend to consume more energy than Tele-
gram messages. Also, the energy consumption of Whatsapp 0.0
5 10 15
tends to have a higher variance than Telegram. Energy consumption (J)
150 Low frequency
Telegram
Telegram
Energy consumption (J)
WhatsApp 0.6
WhatsApp
Density
100 0.4
0.2
50 0.0
10 15 20 25
Energy consumption (J)
0
Idle Low Medium High Medium frequency
Frequency of messages Telegram
0.15 WhatsApp
Fig. 4: Energy consumption for different treatments of Telegram
Density
0.10
and Whatsapp
0.05
Treat- Energy Consumption (Joules) 0.00
Subject 50 100 150
ment SD Mean Median Min Max
Energy consumption (J)
Telegram 2.160 6.355 5.633 4.866 14.835
Idle
WhatsApp 3.576 5.774 4.481 4.016 18.880
Telegram 4.574 10.789 8.648 8.000 22.372 High frequency
Low
WhatsApp 8.038 16.271 10.064 8.942 28.380 Telegram
Telegram 7.331 17.004 13.135 11.295 35.070 WhatsApp
Medium 0.10
WhatsApp 26.530 33.013 22.657 14.543 143.949
Density
Telegram 8.831 20.199 17.438 5.402 40.696
High
WhatsApp 26.258 37.722 29.315 4.167 80.191 0.05
TABLE VI: Energy consumption for different treatments of 0.00
Telegram and Whatsapp 20 40 60 80
Energy consumption (J)
Hypothesis testing. Since our dependent variable(energy con-
sumption) is continuous, and the samples are independent, we Fig. 5: Density plots of the four treatments of the frequency
need firstly check whether the distribution of the dependent variable
variable in the four treatments is normal. The density plots
of the energy consumption for the four treatments are shown
in Figure 5. These density plots help us to get an initial test of residuals is 2.2e-16, which means that the distribution
indication about the distribution of the energy consumption of the residuals is not normal, either.
for each treatment. It can be seen in the figures that all of the
distributions in the four groups seem to be not normal. We TABLE VII: P-values of the Shapiro-Wilk normality test
apply the Shapiro-Wilk normality test to statistically assess Messages frequency p-value
the normality of the data related to the four treatments. Table Idle 1.406842e-11
Low 1.237924e-09
VII shows the p-values of the Shapiro-Wilk test. All of them Medium 2.214018e-11
are lower than the significance threshold, thus we can reject the High 1.886828e-06
null hypothesis that the distribution of the data is normal. The
skewness of each group is also calculated, and we obtained The Levene’s Test for homogeneity of variance is also
the following results: idle=2.80, low=0.98, medium=3.45, and applied to check the homoscedasticity of data. The p-value
high=1.08. In fact, if we refer to Figure 5, we can observe of the Levene’s test is 6.928e-08, which is less than our
that the density of the energy consumption has a peak at the significance threshold, so it can be deducted that the variance
lower values of the data. across the treatments is statistically significantly different, and
Moreover, the normality check for the distribution of resid- the assumption of homoscedasticity is not met. In conclusion,
uals is conducted. The p-value of the Shapiro-Wilk normality given that (i) our data is not normally distributed in all of thefour treatments, (ii) the residuals are not normally distributed
either, and (iii) the variance is not homogeneous, we apply the
Kruskal-Wallis statistical test for RQ1.
75
The application of the Kruskal-Wallis test produced a p-
Energy consumption (J)
value of 2.2e-16, which is lower than our significance thresh-
old (i.e., 0.05). Therefore, we can reject the null hypothesis
H0RQ1 , which states that the energy consumption of the 50
Android device is the same for all treatments can be rejected.
This result provides evidence that receiving instant messages at
different frequencies has an impact on the energy consumption 25
of Android devices.
TABLE VIII: Adjusted p-values of the Dunn’s test
0
Treatments p-value Significance Burst Even
Distribution of arrival
idle - low 9.683172e-09
idle - medium 8.001321e-21
Fig. 6: Energy Consumption for each treatment in RQ2
idle - high 9.994922e-22
low - medium 3.501339e-04
low - high 1.396984e-04 TABLE X: Energy Consumption for each treatment in RQ2
medium - high 7.753923e-01 -
Energy Consumption (Joules)
Treatment
Min Median Mean Max
In order to identify the frequencies of message arrival with Even 4.249 22.525 30.058 80.191
Burst 7.641 22.171 21.142 90.999
higher impact on energy consumption, we apply the Dunn’s
test for the non-parametric pairwise multiple comparison be-
tween the four different treatments. The p-value adjustment
with Benjamini-Hochberg method is also applied to avoid burst messages distributions. The median values of the two
the higher probability of getting statistically significant results treatments are similar. This could be the result of the same
when doing multiple comparisons. As shown in Table VIII, total message amount for each treatment. The mean value of
almost all pairs of treatments exhibit a statistically significant the even treatment is higher than the mean value of the burst
difference, with the exception of the medium-high pair. treatment, due to the presence of more outliers and more data
Effect size estimation. Effect size is a quantitative measure points in the first quartile.
of the magnitude of the difference among groups, which can Hypothesis testing. In order to apply the (parametric) t-test,
help us to acknowledge the strength of a phenomenon. An we need to check if the data meets its assumptions. The first
effect size can be used to explain how important a difference assumption of the t-test is about the normal distribution of
is: large effect sizes mean the difference is important, while the data to be analyzed. Figure 7 presents the density of the
small effect sizes mean the difference is unimportant [30]. energy consumption of the device for each treatment. From a
visual inspection, the data belonging to both treatments seems
TABLE IX: Effect size measures for RQ1 to be not normally distributed.
Treatments Effect size
idle - low 0.866 (large)
idle - medium 0.951 (large) 0.03
Burst
idle - high 0.834 (large)
Even
low - medium 0.591 (large)
low - high 0.452 (medium)
medium - high -
0.02
As shown in Table IX, we found a large effect size between
Density
all pairs involving the baseline (i.e., the idle treatment). When
considering the low treatment we found a large effect size with
0.01
respect to the medium treatment and a medium effect size with
respect to the high treatment. Finally, as expected, we found a
small effect size when considering the medium - high pair (it
was already exhibiting a statistically insignificant difference 0.00
according to our Dunn’s test). 0 25 50 75
Energy consumption (J)
B. Impact of receiving IMs with different distributions (RQ2)
Data exploration. Figure 6 and Table X give an overview Fig. 7: Density plots of the treatments of the distribution
of the measurement data we collected across the even and variableWe statistically assess the normality of the data via to develop new features for their IM applications, such as
the Shapiro-Wilk normality test. The obtained p-values are: an advanced “do not disturb” mode which does not let the
7.379e-05 for the even treatment and 8.303e-07 for the burst messages go through until it is turned off, without impacting
treatment. This means that we can reject the null hypothesis the energy consumption.
that our collected data lies within a normal distribution, in Our answers to the two research questions of this study
turn providing statistical evidence that our collected data is can guide Android users in using their device in a more
not normally distributed. efficient way, specially when they need to save energy or
Since the assumption of normal distribution is not met, we when their battery is low. For example, users can turn off the
need to apply a non-parametric statistical test. As discussed notifications of their IM applications when the battery of the
in Section III-E, we apply the Wilcoxon Rank-Sum test. We device is low. Also, our findings might help the developers
obtained a p-value of 0.061, which is slightly higher than the acknowledge the energy consumption of devices when the
significance level of 0.05. Thus, we cannot reject the null hy- messaging applications are working, and also provide insights
pothesis H0RQ2 and we cannot claim that different distributions about the energy efficient design of messaging applications
of the arrival of instant messages impact differently the energy on the Android platform (e.g., by providing mechanisms for
consumption of an Android device. automatically turning off the notifications of IM apps when
Effect size estimation. As expected, the value of Cliff’s the battery is low).
Delta measure is small (0.244), meaning that the energy VII. T HREATS T O VALIDITY
consumption of the Android device is similar across the even
and burst frequencies of arrival of instant messages. A careful analysis of the threats to validity of an experiment
is essential to assess its scientific validity and to contextualize
VI. D ISCUSSION it to other experiments [32]. Every design choice can bring an
With the help of statistical tests and the data analysis, our array of threats which must be identified and clearly presented
two research questions can be answered. The conclusion for alongside the experiment results. Therefore, in this section, we
the first research question is that generally the energy con- discuss some possible threats to the validity of our study.
sumption grows with the number of received instant messages; A. External Validity
nevertheless, such growth is not obvious when considering The experiment we conducted considers two subjects –
the medium and high treatments. Although it is a natural WhatsApp and Telegram. This can be considered too lit-
outcome that energy consumption increases with message tle subjects to generalise our conclusions on all messaging
load, it is important to validate it through statistical analysis. applications. However, those two applications are amongst
These results also set the stage for future research which can the most used instant messaging apps in the Google Play
further investigate the rate of increase in power consumption Store and our experiment can be replicated on other subjects
compared to the message load. As presented in our experiment with relatively low effort. Future experiments may include
results, there is no significant difference between the medium additional subject such as Facebook Messenger or WeChat,
and high workload, indicating there might be a cut-off point such that the subjects are more representative of the general
at which additional messages do not add relevant overhead for population of IM applications.
Android systems. Further investigations are needed to provide The frequency (i.e., 0, 10, 25, and 50 per minute) and
evidence about this specific point. For developers, there might distribution of arrival (even and burst) of IMs have been
be an opportunity to reduce energy consumption of messages defined so to facilitate the execution and reporting of the
by investigating this cut-off point. experiment, and its replication by third parties. Clearly, in a
For the second research question, our study does not provide realistic scenario, users might not receive messages exactly at
evidence that the distribution of messages received on the An- those intervals. Although the definition and usage of realistic
droid device has a significant impact on energy consumption. intervals is out of the scope of this study, this design decision
Nevertheless, in Figures 6 and 7 we can observe that evenly can have an impact on the external validity since the obtained
receiving messages impacts energy consumption slightly more results might not directly generalize to real usages of IM apps.
than receiving messages in bursts. We conjecture that this As hardware device, we used an HTC Nexus 9, which is
slight difference might be due to tail energy consumption, a relatively modern device with common hardware specifica-
i.e.,, the phenomenon where components such as the network tions. With this choice we can be reasonably sure to have
card remain in high power states after completing a task a realistic experiment that can directly translate into a real
(e.g., receiving a push notification) [28], [8]. Techniques for world scenario. Nevertheless, newer devices running newer
mitigating this possible cause of energy drain exist, such as Android releases may lead to different energy measurements;
the batch operation pattern presented in [14]. The results we further replications of the performed experiments can help in
obtained for RQ2 include valuable information for end users mitigating this potential threat to validity.
and developers alike. On the one hand, end users can trust
the Android platform when dealing with sudden bursts of B. Internal Validity
messages, which might not drain the battery of their devices. There is a very small chance that measurements across trials
On the other hand, developers could use this information vary due to external factors that change slightly between trials,such as a background processes running sporadically in the goal of our experiment as well as the questions related to
operating system, garbage collection, etc. We applied several this goal and the metrics that are relevant to answer those
strategies to mitigate this effect, such as: we randomized the questions have been formalized in a GQM-tree (it is part of
order of subjects and treatments for each trial, we completely the replication package). Using the GQM method, we also
reset the subjects of the experiment at every run, we impose formulated the hypotheses to address the research questions
a cool-down period of 2 minutes between each run, etc. and identified the independent and dependent variables for our
Therefore, the risk of a previous trial or a random background experiment.
process affecting the measurements of a run of the experiment When answering RQ2, we are always sending 50 messages
are greatly reduced. per minute. This design decision is due to the need of
The energy consumption measures were done using a single clearly observe possible effects of the distribution of arrival of
method, namely Trepn. This means the measurement of this messages. A potentially interesting future work of this study
tool could not be corroborated with a second tool. Neverthe- would include the investigation of how different frequencies
less, we are reasonably confident about the reliability of our of messages (i.e.,, 0, 10, 25, 50) might correlate with the
measures since Trepn is well-accepted and used power profiler distribution of arrival of messages (e.g., a burst of 50 messages
in the software engineering community and its measurements might behave differently from an energy point of view with
accuracy has been shown to be accurate when compared to respect to a burst of 10 messages).
hardware-based profilers [18]. Finally, a complete replication package is publicly available
The reliability of the measures can be affected by various for independent verification and inspection of each step of the
factors, such as the brightness of the display, the network performed experiment.
conditions, etc.. In order to mitigate possible biases, we fixed
those external factors. For example, the brightness of the VIII. C ONCLUSIONS
screen of the device was always set to the minimum, the In this article we measure the energy impact of the messag-
distance from the WiFi access point was kept constant, etc. ing applications notifications on a mobile device running the
Finally, being the two experimental subjects commercial Android operating system. In our experiment we compared
(closed-source) apps, we do not have any indication about the energy consumption of the device while running the
whether they are implementing some message bundling tech- WhatsApp and Telegram apps. Our empirical variables are
niques. The existence of internal message bundling techniques two, namely: the frequency of the received messages (i.e., 0,
might potentially influence the results of our experiment, 10, 25, 50 per minute) and (ii) the distribution of messages
specially the ones related to RQ2. Nevertheless, given the long arrival (i.e., evenly or in bursts). The response variable of the
execution time of our runs and the relatively large resolution experiment is the energy consumed by the Android device
of considered time slots (i.e., 1 minute), we are reasonably in Joules. Each run of the experiment lasts 5 minutes and is
confident that our even and burst treatments predicate on a executed on a Nexus 9 Android device. The main result of the
more large grain with respect to the (possibly micro-)bundling experiment is the statistically significant difference in energy
techniques of Telegram and WhatsApp. We leave the study of consumption when receiving small/medium/large numbers of
the internal bundling mechanisms of IM apps for future work. instant messages for both WhatsApp and Telegram; however,
C. Conclusion Validity there is no significant difference when receiving them either
To mitigate this type of threats, we used a fixed number evenly per minute or in bursts.
of treatments for our experiments, with 2 subjects. Overall, 2 This study provides evidence that receiving instant messages
messaging applications were executed 30 times per messaging can largely reduce the battery life of a user’s Android device,
app and per treatment. As a result, we have total sample size even when the number of received messages is relatively low
of 360, which is relatively large for a measurement-based (i.e., 10 messages per minute). Moreover, receiving messages
experiment. in bursts does not lead to significant changes in terms of energy
Moreover, before performing the statistical analysis, we consumption.
made sure to check whether the assumptions of the used As future work, we are planning to carry out the following
statistical tests are met (e.g., data normality). This helped us activities: (i) to replicate the study targeting a higher number
to ensure that the appropriate tests are performed on the data. of subject apps and performing a per-app statistical analysis,
Finally, it is important to note that in our hypothesis testing (ii) to conduct an experiment targeting additional open-source
we combined the data for WhatsApp and Telegram. If on one apps (like Signal5 and inspecting how they internally man-
side this allows us to mitigate the risk of fishing, on the other age the reception of instant messages (e.g., micro-bundling
side it might have masked a potential phenomenon happening messages), and (iii) to investigate how push notifications are
only for one of the two apps. We leave a more fine-grained managed at the OS level in Android, how the used mechanisms
statistical analysis for future work. can be linked to the results we obtained in this study, and
how such knowledge might help in improving the energy
D. Construct Validity
consumption of Android devices.
We used the Goal-Question-Metric method [6], [31] to
define a priori the main components of the experiment. The 5 https://signal.orgR EFERENCES
[19] Y. Hu, J. Yan, D. Yan, Q. Lu, and J. Yan. Lightweight energy
[1] Push notifications mechanism for ios and android. Accessed 21 October consumption analysis and prediction for android applications. Science
2020. https://idapgroup.com/blog/push-notifications-mechanism-for-ios- of Computer Programming, 162:132–147, 2018.
android/. [20] W. H. Kruskal and W. A. Wallis. Use of ranks in one-criterion variance
[2] Notifications overview in android plat- analysis. Journal of the American statistical Association, 47(260):583–
form. Accessed 25 September 2020. 621, 1952.
https://developer.android.com/guide/topics/ui/notifiers/notifications,
[21] D. Li, S. Hao, J. Gui, and W. G. Halfond. An empirical study of the
2020.
energy consumption of android applications. In 2014 IEEE International
[3] U. Acer, A. Mashhadi, C. Forlivesi, and F. Kawsar. Energy efficient
Conference on Software Maintenance and Evolution, pages 121–130.
scheduling for mobile push notifications. In proceedings of the 12th EAI
IEEE, 2014.
International Conference on Mobile and Ubiquitous Systems: Comput-
ing, Networking and Services on 12th EAI International Conference on [22] D. Li, S. Hao, J. Gui, and W. G. J. Halfond. An empirical study of the
Mobile and Ubiquitous Systems: Computing, Networking and Services, energy consumption of android applications. In 2014 IEEE International
pages 100–109, 2015. Conference on Software Maintenance and Evolution, pages 121–130,
[4] L. Ardito, R. Coppola, M. Morisio, and M. Torchiano. Methodological 2014.
guidelines for measuring energy consumption of software applications. [23] D. Li, S. Hao, W. G. Halfond, and R. Govindan. Calculating source
Scientific Programming, 2019, 2019. line level energy information for android applications. In Proceedings
[5] L. Baresi, W. G. Griswold, G. A. Lewis, M. Autili, I. Malavolta, and of the 2013 International Symposium on Software Testing and Analysis,
C. Julien. Trends and challenges for software engineering in the mobile pages 78–89. ACM, 2013.
domain. IEEE Software, 38(1):88–96, 2020. [24] D. Li, Y. Lyu, J. Gui, and W. G. Halfond. Automated energy optimization
[6] C. G. R. H. Basili, V.R. Encyclopedia for Software Engineering. J. of http requests for mobile applications. In 2016 IEEE/ACM 38th
Marciniak (ed.), 1994. International Conference on Software Engineering (ICSE), pages 249–
[7] D. Burgstahler, N. Richerzhagen, F. Englert, R. Hans, and R. Steinmetz. 260. IEEE, 2016.
Switching push and pull: An energy efficient notification approach. In [25] I. Malavolta, E. M. Grua, C.-Y. Lam, R. de Vries, F. Tan, E. Zielinski,
2014 IEEE International Conference on Mobile Services, pages 68–75. M. Peters, and L. Kaandorp. A framework for the automatic execution of
IEEE, 2014. measurement-based experiments on android devices. In 35th IEEE/ACM
[8] H. Cai, Y. Zhang, Z. Jin, X. Liu, and G. Huang. Delaydroid: reducing International Conference on Automated Software Engineering Work-
tail-time energy by refactoring android apps. In Proceedings of the 7th shops (ASEW-ĂŹ20), pages 61–66.
Asia-Pacific Symposium on Internetware, pages 1–10, 2015.
[26] I. Malavolta, G. Procaccianti, P. Noorland, and P. Vukmirovic. Assessing
[9] Y. Choi, C.-h. Yoon, Y.-s. Kim, S. W. Heo, and J. A. Silvester. The
the impact of service workers on the energy efficiency of progressive
impact of application signaling traffic on public land mobile networks.
web apps. In 2017 IEEE/ACM 4th International Conference on Mobile
IEEE Communications Magazine, 52(1):166–172, 2014.
Software Engineering and Systems (MOBILESoft), pages 35–45. IEEE,
[10] S. Chowdhury, S. Di Nardo, A. Hindle, and Z. M. J. Jiang. An
2017.
exploratory study on assessing the energy impact of logging on android
applications. Empirical Software Engineering, 23(3):1422–1456, 2018. [27] A. A. Nacci, M. Mazzucchelli, M. Maggio, A. Bonetto, D. Sciuto, and
[11] J. Clement. Most popular global mobile messaging apps 2020. Accessed M. D. Santambrogio. Morphone. os: context-awareness in everyday life.
11 September 2020. https://www.statista.com/statistics/258749/most- In 2013 Euromicro Conference on Digital System Design, pages 779–
popular-global-mobile-messenger-apps/, 2020. 786. IEEE, 2013.
[12] N. Cliff. Dominance statistics: Ordinal analyses to answer ordinal [28] A. Pathak, Y. C. Hu, M. Zhang, P. Bahl, and Y.-M. Wang. Fine-
questions. Psychological bulletin, 114(3):494, 1993. grained power modeling for smartphones using system call tracing. In
[13] M. Couto, J. Saraiva, and J. P. Fernandes. Energy refactorings for Proceedings of the sixth conference on Computer systems, pages 153–
android in the large and in the wild. In 2020 IEEE 27th Interna- 168, 2011.
tional Conference on Software Analysis, Evolution and Reengineering [29] J. Rosenberg. Statistical methods and measurement. In Guide to
(SANER), pages 217–228. IEEE, 2020. Advanced Empirical Software Engineering, pages 155–184. Springer,
[14] L. Cruz and R. Abreu. Catalog of energy patterns for mobile applica- 2008.
tions. Empirical Software Engineering, 24(4):2209–2235, 2019.
[30] T. Schafer and M. A. Schwarz. The meaningfulness of effect sizes
[15] O. J. Dunn. Multiple comparisons among means. Journal of the
in psychological research: Differences between sub-disciplines and the
American statistical association, 56(293):52–64, 1961.
impact of potential biases. Frontiers in Psychology, 10:813, 2019.
[16] R. J. Grissom and J. J. Kim. Effect sizes for research: A broad practical
approach. Lawrence Erlbaum Associates Publishers, 2005. [31] B. E. van Solingen, R. A Practical Guide for Quality Improvement and
[17] M. Hollander, D. A. Wolfe, and E. Chicken. Nonparametric statistical Software Development. McGraw-Hill International, London/Chicago,
methods, volume 751. John Wiley & Sons, 2013. 1999.
[18] M. A. Hoque, M. Siekkinen, K. N. Khan, Y. Xiao, and S. Tarkoma. [32] C. Wohlin, P. Runeson, M. Höst, M. C. Ohlsson, B. Regnell, and
Modeling, profiling, and debugging the energy consumption of mobile A. Wesslén. Experimentation in software engineering. Springer Science
devices. ACM Computing Surveys (CSUR), 48(3):1–40, 2015. & Business Media, 2012.You can also read