THE MECHANICS AND POLITICS OF CHANGING A SPEED LIMIT - ViaStrada
←
→
Page content transcription
If your browser does not render page correctly, please read the page content below
THE MECHANICS AND POLITICS OF CHANGING A SPEED LIMIT

Author:       Glen Koorey
              PhD, ME(Civil), BE(Hons), BSc, CMEngNZ
              Principal – Senior Traffic Engineer & Transportation Planner
              ViaStrada Ltd
              Contact: glen@viastrada.nz

ABSTRACT
With a new government pushing a greater emphasis on road safety, attention is increasing on the
role that speed plays in our safety record. For both urban and rural settings, there has been a
growing clamour by some elected officials, safety advocates, and the general public for greater use
of lower speed limits. Yet, at the same time such changes remain polarising, with other people
sceptical of their effect on safety and wary about their impact on network efficiency. The relatively
cumbersome process of changing existing speed limits has also been cited as a hurdle to
implementing fast change (although others might argue that is an important handbrake in a
democratic society).
This paper will investigate the current state of play around setting and changing speed limits in
New Zealand. A review of research literature, both here and overseas, will summarise the
generally observed effects of changing speed limits (often with little other changes to the road
environment or enforcement) in terms of both travel speeds and safety outcomes, whilst also
identifying some of the caveats and limitations of this evidence. The paper will also explore some
of the current challenges with the existing speed limit legislation in New Zealand (e.g. consultation
requirements, default speeds, alignment with observed speeds), and debate some common
arguments and concerns raised by people about speed limit changes. Finally, an attempt will be
made to identify a productive way forward for all interested parties regarding the use of speed
limits.
The Mechanics and Politics of Changing a Speed Limit G. Koorey Page 1 1 INTRODUCTION A road network needs to have an appropriate balance between providing an efficient system for moving people and goods to various destinations, and a safe system that protects road users and other people nearby. It also needs to take into account other considerations such as amenity, environment, travel behaviour change, and the overall views of the local community. One of the key inputs to help achieve many of these objectives are the regulatory speed limits on the network. The new Labour-led government is promoting a greater emphasis on road safety in its transport policy (NZ Government 2018), and attention is increasing on the role that speed plays in NZ’s safety record. For both urban and rural settings, there has been a growing clamour by some elected officials, safety advocates, and the general public for greater use of lower speed limits (e.g. Littlewood 2018). Yet, at the same time, such reductions in limits remain polarising, with other people sceptical of their effect on safety and wary about their impact on network efficiency. Previous surveys of public preference for lower speed limits have been relatively muted (Turner et al 2014). By contrast, recent proposals to increase some speed limits to 110 km/h, for example, received relatively little public backlash (Wilson 2017). The relatively cumbersome process of changing existing speed limits, and attempting to comply with subsequent engineering requirements for observed speeds, has also been cited as a hurdle to implementing fast change (although others might argue that is an important handbrake in a democratic society). This paper will investigate the current state of play around setting and changing speed limits in New Zealand, particularly with regard to the more vexing challenge of lowering speed limits. It will explore some of the current challenges with the existing speed limit legislation in New Zealand, and debate some common arguments and concerns raised by people about speed limit changes. Finally, an attempt will be made to identify a productive way forward for all interested parties regarding the use of speed limits. 2 THE ARGUMENTS FOR LOWER SPEED LIMITS 2.1 The link with safety The “power” relationship between observed mean speeds and crash outcomes has been well documented previously. Nilsson (2004) confirmed earlier studies of his that found that the injury crash rate changes approximately with the square of the change in mean speed, with even higher exponents (typically about 3-4) valid for serious and fatal injuries. So, assuming that a reduction in speed limits led to even a 1% reduction only in observed mean speeds, one would still expect to see approximately a 4% reduction in fatalities, a 3% reduction in serious injuries, and a 2% reduction in other injuries. As well as many studies overseas demonstrating good safety outcomes from lower speeds (e.g. ITF 2017), there are a number of NZ studies that also show such effects. For example, Koorey & Frith (2017) investigated the effects of reducing the NZ open road speed limit in 1973 and then subsequently raising it again in 1985. Although the vagaries of the available data at the time made it slightly difficult to tease out all the relative changes in rural vs urban and fatal vs injury casualties, the overall findings indicated the 1973 limit reduction was accompanied by a notable reduction in rural fatalities and injuries (relative to their urban counterparts), while the 1985 limit increase was accompanied by a notable increase in rural fatalities and injuries. In 2016, Christchurch introduced a 30km/h lower speed zone within a large part of the central city area, as part of the “Accessible City” transport rebuild plan. This has generated some controversy amongst residents and businesses who feel that it is greatly restricting access to and through central Christchurch. However, analysis of crash data two years before and after suggests that Transportation Group 2019 Conference, Te Papa, 3-6 March 2019
The Mechanics and Politics of Changing a Speed Limit        G. Koorey                                Page 2

there have been considerable reductions in crash numbers (-25%) and injuries (-36%) since its
implementation, despite growing numbers of traffic and people returning to the city (Koorey 2018).

2.2   The effect on vulnerable road users
Many studies of speed limit reductions, particularly in urban areas, have cited the particular
benefits to more vulnerable road users such as those walking and cycling. This effect can also
manifest itself into seeing increases in the numbers of people using these modes, as a result of
reduced traffic speeds, and reduced injury and fatality rates.
An often-cited relationship is the link between impact speed and likelihood of pedestrian death if
hit; traditionally the data (based on the likes of Wramborg 2005 or Anderson 1997) suggests that at
30 km/h the likelihood of death is only 10% whereas at 50 km/h the likelihood is closer to 90%.
However, more recent research by Rosén et al (2011) has identified methodological flaws in the
earlier work that resulted in a bias to more severe injuries; also, modern motor vehicle designs and
medical care are now somewhat better at minimising the injuries of externally struck people
(notwithstanding the fact that the vehicle fleet in New Zealand is relatively old compared with many
countries).
Scott & Mackie (2014) analysed more recent pedestrian injury studies and estimated a much lower
likelihood of fatality for pedestrians until speeds rise to about 60 km/h (with the caveat that some
heavy vehicle impacts or collisions with more vulnerable pedestrian groups may still result in more
fatalities at lower speeds). Although the absolute percentages may have come down (see Figure
1), it is clear that the relative fatality risk as speeds go up is still a considerable increase. In the
case of typical urban impact speeds, it is pertinent to note that the risk of pedestrian fatality if
struck at 50 km/h is still twice that at 40 km/h and five times that at 30 km/h.

      Figure 1: Fatal Injury Risk vs Impact Speed for Pedestrians (Scott & Mackie 2014)
Trumper (2013) compared perceptions of two similar streets in Christchurch, one with a slow zone
installed and one left untreated. This was evaluated by interviewing residents and asking them how
traffic noise, air pollution from traffic, their safety and the speed of traffic influenced their decisions
to walk there. Traffic speed and safety had little to some influence on the average resident when
deciding to walk; however, when it came to their children, parents were more protective with
regards to the speed of traffic and safety of their children.

Transportation Group 2019 Conference, Te Papa, 3-6 March 2019
The Mechanics and Politics of Changing a Speed Limit G. Koorey Page 3 2.3 The effects on observed speeds Koorey & Frith (2017) noted that studies in New Zealand and elsewhere have fairly consistently found small changes in observed mean speeds following a posted speed limit change, in the absence of any change in road environment, enforcement, or road user motivation. For example, a meta-analysis of over 200 speed limit change studies worldwide (Elvik et al 2004) found the average observed speed change to be 2.5 km/h for every 10 km/h of posted speed limit change. These may be higher-end estimates of what has happened, owing to publication bias, but they are still real changes happening in real situations. Other local studies have also found similar average changes per 10 km/h change in limit. For example, Hamilton’s Safer Speed Areas project introduced 40 km/h speed limits to some 50 km/h residential areas with only some threshold treatments installed on the actual streets, resulting in 0- 3km/h changes in mean speeds (Hamilton City Council 2012). A basic explanation for this is that drivers base their decision on what speed to travel at from a combination of the posted speed limit (or their assumption of what it is) and the “environmental speed” of the road (Koorey & Frith 2017 explains the theory in more detail). The latter measure is based on the design of the road (e.g. horizontal curvature, road width, surface texture, traffic calming features) and the surrounding environment (e.g. adjacent land uses, road user activity, frequency of parking, weather, trees and vegetation). The degree to which posted speeds are accepted and adhered to by drivers, rather than being influenced by the environmental speed more, is a function of both the level of enforcement (e.g. presence of traffic police and speed cameras, penalties for speeding) and the degree of compliance (e.g. general societal/cultural norms for respecting laws, perceived appropriateness of the speed limit). 2.4 Other observed impacts of lower speeds Williams (2013) investigated how lower traffic speeds can result in a range of sustainable transport outcomes. She noted that, while commonly recognised elsewhere in the world, lowering speed limits was not well understood in New Zealand as a mechanism for improvements in active mode use, public health, accessibility, integrated urban form, environmental sustainability and economic development. While a lot of focus on lower speeds comes from the expected safety benefits of changing existing limits (especially if there is already identified a known safety problem), it’s important to remember that there may be other (non-safety) reasons why a local jurisdiction wishes to change speed limits. For example, there may be a desire to improve the attractiveness of a local shopping precinct. A “neighbourhood greenway” cycling route may require a lower speed limit to improve the safety of interactions between drivers and cyclists (Koorey 2012). Another reason may be a desire for consistency of speed limits between similar adjacent roads, even when their safety records vary. 3 THE ARGUMENTS AGAINST LOWER SPEED LIMITS 3.1 The effect on travel time Anyone with a basic grasp of kinematics will associate going at a slower speed with taking a longer time to travel the same distance. It is not surprising therefore that many people cite the increased travel time from a lower speed limit as having a major impact on network productivity (e.g. Persico 2018). Interestingly, this increased travel time has also been blamed by some commentators for increasing driver fatigue and thus increasing crash risk. While it is hard to deny the laws of physics, many people mistakenly over-estimate the impact of this change based on the relative change in speed limits (e.g. a 20% reduction in the posted speed limit is assumed to lead to a 20% increase in travel time). Rowland & McLeod (2017) investigated time savings as a motivation for New Zealand drivers’ speeding behaviour, and also the effect of education designed to improve people’s understanding Transportation Group 2019 Conference, Te Papa, 3-6 March 2019
The Mechanics and Politics of Changing a Speed Limit G. Koorey Page 4
of the costs and benefits of speeding. While some drivers surveyed sped to save time, drivers
more strongly agreed they chose not to speed due to the safety risk and penalties if caught.
Interestingly, respondents tended to overestimate the time savings at high speeds and
underestimate the time savings at lower speeds. Most drivers were aware that increasing speed
above 100km/h would use more fuel and the majority gave estimates of the fuel savings close to
the correct amount.
The reasoning behind why actual time differences are generally overestimated is due to the limited
amount of time that one is usually able to travel at the theoretical maximum speed. These delays
may arise from road geometric constraints (e.g. tight horizontal curves), other traffic (e.g. urban
congestion), point restrictions (e.g. intersections, railway crossings), or section restrictions (e.g.
road works, lower speed towns along a journey). In all of these cases, the time travelled through
these sections will be unaffected by what the open road limit is. Because sections of road travelled
at lower speeds take a longer time to be travelled, they get over-weighted when determining the
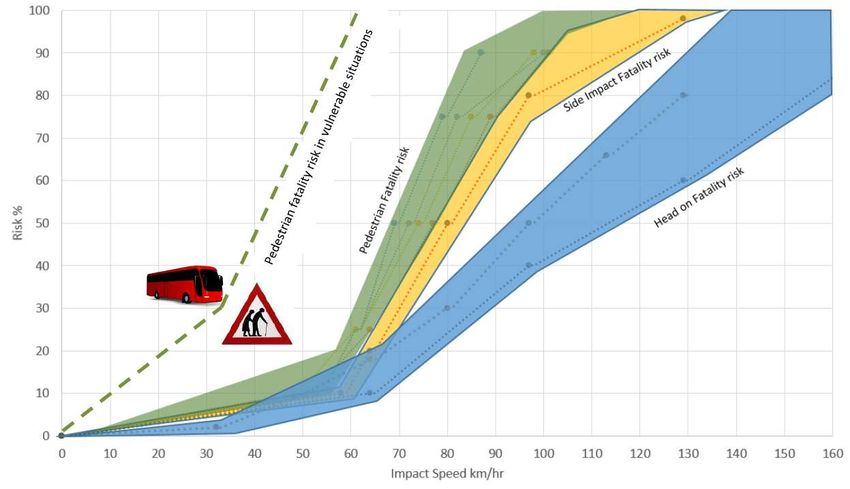
overall average speed. For example, 100 km driven at 100 km/h followed by 100 km driven at
50 km/h results in an average speed driven over the total length of 66.7 km/h, not 75 km/h as is
commonly assumed (see Figure 2). It should be noted too that reducing the maximum speed in the
first section to 80 km/h would only reduce the average travel speed in this example by 5 km/h.
100 km @ 100 km/h 100 km @ 50 km/h
= 1 hr travel = 2 hrs travel
Total: 200 km over 3 hrs = 66.7 km/h average speed
Figure 2: Effect of partly travelling at lower speeds
3.2 The impact of only changing the speed limit
It is often claimed that simply changing posted speed limits in the absence of any other
engineering, education or enforcement measure will have no effect on travel speeds (and hence
safety). However, as explained in section 2.3, there is still likely to be some influence on observed
speeds, albeit less than the change in posted limit (typically 2-3 km/h per 10 km/h change in limit).
Whether it is sufficient alone to just change the speed limit will depend on the site context. For
example, if a 50 km/h road already has mean speeds of 43 km/h, then changing the posted speed
limit to 40 km/h may also result in similar observed post-implementation speeds of around 40 km/h.
However, if the road starts with mean speeds closer to 50 km/h, then additional treatments (e.g.
traffic calming) may be required to achieve 40 km/h post-implementation mean speeds. Thus, in
both cases, “self-explaining roads” can be achieved.
3.3 Having to “watch the speedo”
An interesting argument raised by some people in regard to both reduced speed limits and reduced
speed enforcement tolerances is that drivers will have to concentrate more frequently on their
speedometer to ensure that they stay within the prescribed limit. As a result, drivers will have less
time to concentrate on the road itself, thus increasing their crash risk. Recent evidence is cited
from Western Australia (Bowden et al 2017), where drivers using a simulator with varying speed
limit tolerances had poorer peripheral object detection and higher workload when the tolerance
was stricter, with the suggestion that this may impair driver hazard detection. However, it was also
noted that lowering enforcement tolerances reduced the average speed travelled by participants,
by over 4 km/h on average when the tolerance was reduced by 10 km/h.
Transportation Group 2019 Conference, Te Papa, 3-6 March 2019The Mechanics and Politics of Changing a Speed Limit G. Koorey Page 5 There also appears to be some inconsistency in this argument, in that only some combinations of [speed limit + tolerance] are deemed to require additional scanning of the speedometer. One would have thought that in any situation, a driver (having determined what is the maximum acceptable travel speed they are willing to drive at) would need to regularly check that they were being compliant with the current speed restrictions. The advent of more cars with cruise control speed management also negates some of this concern as well. 3.4 Enforcement and “revenue gathering” Perhaps the most cited concern about enforcement of speed limits by the general public is that it is all part of an exercise designed to collect as much revenue as possible for the Government from speeding fines. That accusation is also often targeted at the Police themselves or local Councils, even though speeding fine revenue does not directly benefit either party. Some commentators have also felt that the Police focus on speed enforcement has not worked, given that the road safety statistics have worsened in recent times. This ignores the fact that Police can only enforce the speed limits officially designated, and in most cases (as indicated by NZTA’s own speed management data) they are set too high. Van Lamoen (2016) analysed the three summers where a reduced 4 km/h enforcement threshold was in place by the NZ Police. The first summer (2013/14) saw a >20% reduction in the numbers observed speeding, which was matched with a 22% reduction in fatal crashes. The following summer saw lesser reductions, while the third summer (2015/16) saw no improvement. The latter result was attributed to diminishing Police Officer buy-in (e.g. a big drop in
The Mechanics and Politics of Changing a Speed Limit        G. Koorey                             Page 6

speeds on motorways are sometimes used to prevent traffic flow breakdown. For New Zealand,
such fully congested flows are not typically that common away from urban peak hours anyway.

4 CHALLENGES WITH THE EXISTING SPEED LIMIT SETTING PROCESS
While the technical arguments behind changing speed limits, discussed above, are well
understood, another challenge at least in New Zealand remains some of the practical issues for
roading authorities in trying to make legal changes to existing speed limits (although the new
setting speed limit process is somewhat improved over the previous process, as described by
Koorey 2011). Some of these issues are discussed below.

4.1       Consultation requirements
The Setting of Speed Limits Rule (NZ Govt 2017) imposes certain statutory requirements for
consultation on any roading authority wishing to change speed limits. This includes specific
requirements to consult with local communities affected, the Police, the Automobile Association
and Road Transport Forum NZ (although oddly not with national groups for other modes like
walking and cycling). There is also a catch-all to consult with “any other organisation or road user
group that the road controlling authority considers to be affected by the proposed speed limit”,
which is probably interpreted in different ways by different jurisdictions.
To date, it appears that different roading authorities have taken different approaches to how
consultation is undertaken; while some have presented whole areas as a single “package” for
consultation, others have consulted on each street individually in isolation of each other. It is also
not clear how much authorities are taking into account the feedback from different groups of
stakeholders. For example, while on an arterial road the views of motorists regularly using that
route are very pertinent, for a local residential street they are arguably less important compared
with the views of local residents or active mode users along that route.
For a specialist technical issue such as speed limits, it is worth considering how much the process
should be so reliant on input from both the general public and elected members. This is not to deny
the important role of democracy in making societal decisions, but it does appear that sometimes
unsubstantiated concerns are holding up technically sound proposals for speed changes. It may
simply be that technical staff have to do a better job of presenting the case to stakeholders,
although that also highlights a lack of specialist industry training in this area.

4.2       Default speed limits
New Zealand currently operates on a system of two default speed limits (50 km/h in urban areas
and 100 km/h in rural areas), with the ability via the Setting of Speed Limits Rule to invoke other
limits as required. This approach has been criticised by various observers from a number of
perspectives:
      •    The default limits are deemed as too high for typical roads. For example, in many countries,
           the default limit for two-lane rural roads would be no more than 80 km/h, while most urban
           (non-arterial) streets would be 30-40 km/h. NZ Transport Agency’s own data has identified
           that over 80% of the country’s roads have calculated “safe and appropriate speeds” (a
           useful starting indicator for determining speed limits) below their currently posted speed
           limit.
      •    Institutional inertia (e.g. consultation requirements discussed above) makes it difficult for
           roading authorities to change large portions of the road network from the default speeds
           quickly. NZTA’s own speed management data initially only highlighted the “top 10%” of the
           road network warranting speed change, although the latest data now shows the top 20%
           (NZTA 2018a).
      •    A focus on a simple two-tier “default value” system makes it hard to have public
           conversations about using a wider range of speed limits as appropriate. For example, an

Transportation Group 2019 Conference, Te Papa, 3-6 March 2019
The Mechanics and Politics of Changing a Speed Limit G. Koorey Page 7
international report recommending 70 km/h limits for rural undivided roads was widely
panned in NZ (and mistakenly seen as a Government proposal by some), partly out of
concern that it might apply to all existing 100 km/h roads (Daly 2018, Quinlivan 2018). It is
notable that a survey of NZ Automobile Association members found 87% opposed lowering
the open road limit to even 90kmh.
In effect, this situation means that roading authorities have to go to considerable effort to change
existing speed limits from the defaults to lower values (especially on a large scale); in some cases,
the technical resources or political will to do so are lacking. By contrast, Sweden’s default rural
speed limit is 70 km/h and authorities must demonstrate that a road has the necessary safety
features (e.g. barriers, grade-separated intersections) to justify higher speed limits (Vadeby &
Forsman 2014).
An interesting consideration is whether a wider range of default limits should be instituted in New
Zealand, based on the characteristics of different roads. For example, it is probably inappropriate
for any unsealed road to have a posted limit higher than 80 km/h; similarly, urban local (non-
arterial) streets could be 40km/h by default.
4.3 Alignment with observed speeds
Currently the Setting of Speed Limits Rule requires jurisdictions to select speed limits where mean
operating speeds will be less than 10% above the new posted limit (e.g.The Mechanics and Politics of Changing a Speed Limit G. Koorey Page 8
• Areas in close proximity to schools, playgrounds and other higher-risk locations.
• Unsealed, narrow and/or winding rural roads
In this way, jurisdictions are more likely to bring the public along the way, by pointing out the
inherent dangers of each scenario. Assuming that positive safety results (and other relevant
metrics like public support) can be subsequently demonstrated, this provides impetus to then
consider more “difficult” locations.
A similar approach may be to “work with the willing” by seeking expressions of interest from
communities wanting lower speeds in their area and implementing them first; this approach was
successfully done for Hamilton’s Safer Speed Areas project, which introduced a number of 40 km/h
speed limits to selected residential areas based on local feedback (Hamilton City Council 2012).
5.2 Provide common material to pre-empt the concerns
A number of the arguments discussed above (and others) are regularly cited by stakeholders when
lower speed limits are proposed; at present it seems that each roading authority has to construct
its own case for the proposed changes addressing the concerns raised, with varying degrees of
effort and subsequent success.
A far more consistent and cost-effective approach would be for the NZ Transport Agency to
prepare comprehensive material that all roading authorities can use to pre-empt the likely
concerns. These could include:
• "Reduced speeds will mean longer travel times"
• “Reducing speed limits has no effect on safety”
• "Simply changing the posted limit has no effect on speed"
• “It’s just an excuse for revenue gathering”
(other common arguments are also discussed in Koorey 2011)
Some material of this nature is starting to be provided on NZTA’s website (NZTA 2018b) but needs
to cover even more discussion points and be more widely promulgated.
5.3 Use the One Network Road Classification as a speed tool
The One Network Road Classification (ONRC) system divides all of New Zealand’s roads into eight
categories (from high-volume National roads to low-volume Access streets) based on how busy
they are and what they connect to. ONRC was developed by the NZ Transport Agency initially as a
mechanism for consistent allocation of maintenance funding nationally; however, its potential as a
tool for other corridor management functions is beginning to be recognised. This includes the
ability to use the ONRC classifications as a starting point for determining appropriate (or default)
speed limits.
For example, it might be expected that most high-volume National routes (typically expressways or
motorways) should warrant at least a 100 km/h speed limit. Conversely, generally it will not be
appropriate for most urban Access streets to have higher than a 40 km/h limit. By establishing
some default speed limits based on the various ONRC categories, a more nuanced approach to
setting speed limits can be achieved, while also reducing the effort needed to make a business
case for changing some of the existing limits.
5.4 Mix in a few speed increases with the decreases
It may be politically astute to consider how to implement “packages” of speed limit changes that
don’t appear to be simply about speed reductions (unfortunately that is where the greatest need for
speed reform currently lies in NZ). For example, at the same time that a series of local urban
streets are being proposed for change down to 40 km/h, a nearby four-lane divided arterial could
be proposed to have its limit increased to 60 km/h (as with the speed reductions, it would be
Transportation Group 2019 Conference, Te Papa, 3-6 March 2019The Mechanics and Politics of Changing a Speed Limit G. Koorey Page 9 prudent to consider whether appropriate engineering treatments are in place first to safely support such a speed increase). Sweden adopted a similar approach when rationalising their rural speed limits (Vadeby & Forsman 2014). Their process contained a mixture of speed limit increases and decreases, although in practice there were seven times as many decreases as there were increases. While it is not always possible to present this kind of “balanced” package of speed measures, in practice it is a useful way to get across the message of appropriate limits for appropriate roads. 5.5 Try posted limit changes first, then treat where necessary Greater leeway needs to be given when considering whether a reduction in speed limit will have the desired effect on its own; at present a fairly sceptical approach is taken to whether such measures alone will have any effect on travel speeds (or a sufficiently strong effect to meet the compliance requirements of the Setting Speed Limits Rule). If there is doubt, then require some ongoing monitoring, and the ability to introduce additional speed management treatments to help achieve the target speed or to further amend the limit (including possibly reverting to the original limit). For example, at present there is some resistance to having local authorities trial using 30 km/h permanent or variable speed limits (e.g. around schools), out of concern that the measure won’t result in mean traffic speeds close to 30 km/h but it would be politically difficult to come back later and remove such a limit. This seems to be a defeatist argument that doesn’t allow the possibility of introducing such a limit to start with, and then introducing additional calming measures later if the speeds haven’t dropped sufficiently (and continuing to do so until the desired speeds are achieved). 6 CONCLUSIONS Overall, the evidence is generally rather compelling that lowering speed limits have considerable benefits for road safety, as well as other positive outcomes for amenity and active travel. Many of the commonly cited concerns about reduced speed limits are not well founded on evidence or of minimal impact. On this basis, it could certainly be argued that a widespread programme of speed limit reductions would have considerable benefit to our society. However, the political toll of a simple “dictatorial” approach (at least in the short term) may be too much for many elected officials. Therefore, pragmatics may win the day by using many of the techniques from the previous section to wean the sceptical parts of the public onto a lower speed regime. One way or the other, the resulting outcome is likely to be of great benefit to New Zealand. 7 REFERENCES ANDERSON R.W.G., MCLEAN A.J., FARMER M.J., LEE B.H., BROOKS C.G. (1997). Vehicle Travel Speeds and the Incidence of Fatal Pedestrian Crashes, Accident Analysis and Prevention, No. 29, pp.667-674, Elsevier. BOWDEN V.K., LOFT S., TATASCIORE M., VISSER T.A.W. (2017). Lowering thresholds for speed limit enforcement impairs peripheral object detection and increases driver subjective workload. Accident Analysis & Prevention, Volume 98, January 2017, pp.118-122, Elsevier. DALY M. (2018). What are the chances of a 70kmh open road speed limit? Stuff NZ, 3 Apr 2018. https://www.stuff.co.nz/national/politics/102775576/what-are-the-chances-of-a-70kmh-open- road-speed-limit ELVIK R., CHRISTENSEN P., AMUNDSEN A.H. (2004). Speed and Road Accidents. An Evaluation of the Power Model. TØI Report 740/2004, Institute of Transport Economics, Oslo, Norway. Transportation Group 2019 Conference, Te Papa, 3-6 March 2019
The Mechanics and Politics of Changing a Speed Limit        G. Koorey                     Page 10

FRIEDMAN L.S., HEDEKER D., RICHTER E.D. (2009). Long-Term Effects of Repealing the
National Maximum Speed Limit in the United States. American Journal of Public Health,
September 2009, Vol 99, No. 9, pp.1626-1631.
HAMILTON CITY COUNCIL (2012). Safer Speed Areas – Urban: Progress and Monitoring Report,
May 2012.
INTERNATIONAL TRANSPORT FORUM (ITF, 2017). Speed and Crash Risk. International Traffic
Safety Data and Analysis Group.
KLOEDEN CN, MCLEAN AJ, MOORE VM, PONTE G (1997). Travelling Speed and the Risk of
Crash Involvement. Volume 1: Findings. Federal Office of Road Safety contractor report CR172,
Canberra.
KOOREY G. (2011). Implementing Lower Speeds in New Zealand, IPENZ Transportation Group
Conference, Auckland, 27-30 Mar 2011, 15pp.
KOOREY G. (2012), Neighbourhood Greenways: Invisible Infrastructure for Walking and Cycling,
2Walk&Cycle Conference, Hastings, 22-24 Feb 2012, 12pp.
KOOREY G. (2018). Has the Christchurch Central City 30km/h Zone worked? NZ Transport
Knowledge Conference, Wellington, 15 Nov 2018.
KOOREY G., FRITH W. (2017). Changing Rural Speed Limits – Learning from the Past, NZ
Transportation Conference, Hamilton, 29 – 31 Mar 2017.
LAVE C., ELIAS P. (1994). Did the 65 mph speed limit save lives? Accident Analysis & Prevention,
Volume 26, Issue 1, February 1994, pp.49-62.
LITTLEWOOD M. (2018). Reduce rural road speed limit call, Timaru Herald, 2 Mar 2018.
https://www.stuff.co.nz/timaru-herald/101919410/reduce-rural-road-speed-limit-call
McLACHLAN G. (2018). Lower rural speed limits often worsen congestion, NZ Herald, 12 Oct
2018. https://www.nzherald.co.nz/nz/news/article.cfm?c_id=1&objectid=12140650
NILSSON G. (2004). Traffic safety dimensions and the power model to describe the effect of speed
on safety. Bulletin 221, Lund Institute of Technology, Lund, Sweden.
NZ GOVERNMENT (2017). Land Transport Rule: Setting of Speed Limits. Rule 54001, Wellington.
NZ GOVERNMENT (2018). Government Policy Statement on Land Transport 2018/19 – 2027/28.
Wellington.
NZ TRANSPORT AGENCY (NZTA, 2011). Variable Speed Limit in School Zones. New Zealand
Gazette, No. 55, 21 April 2011, pp.1284-85.
NZ TRANSPORT AGENCY (NZTA, 2016). Speed Management Guide. First Edition, Nov 2016.
NZ TRANSPORT AGENCY (NZTA, 2018a). Safer Journeys Risk Assessment Tool (Mega Maps)
Edition II: Using and Interpreting the Tool.
NZ TRANSPORT AGENCY (NZTA, 2018b). Better Conversations on Road Risk.
https://www.nzta.govt.nz/safety/speed-management-resources/better-conversations-on-road-
risk/
PERSICO C. (2018). Potential speed limit drop will cast Taranaki further adrift, says mayor,
Taranaki   Daily   News,       6    Jul     2018.     https://www.stuff.co.nz/taranaki-daily-
news/news/105277046/potential-speed-limit-drop-will-cast-taranaki-further-adrift-says-mayor
QUINLIVAN M. (2018). Mackenzie mayor Graham Smith says a 70kmh open road speed limit
would be 'a bit ridiculous', Timaru Herald, 9 Apr 2018. https://www.stuff.co.nz/timaru-
herald/news/102810105/mackenzie-mayor-graham-smith-says-a-70kmh-open-road-speed-
limit-would-be-a-bit-ridiculous

Transportation Group 2019 Conference, Te Papa, 3-6 March 2019
The Mechanics and Politics of Changing a Speed Limit        G. Koorey                    Page 11

ROSÉN E., STIGSON H., SANDER U. (2011). Literature Review of Pedestrian fatality risk as a
function of car impact speed. Accident Analysis and Prevention, No. 43, pp.25-33, Elsevier.
ROWLAND T., MCLEOD D. (2017). Travel time savings and speed: actual and perceived. NZ
Transport Agency research report No. 568. 97pp.
SCOTT R., MACKIE H. (2014). Speed/injury Risk Curves: Analysis of evidence and considerations
for updated curves, Report for Ministry of Transport.
TRUMPER H. (2013). Slow Zones: The Pedestrian Experience. Masters of Engineering in
Transport report, University of Canterbury.
TURNER S., LOGAN D., KHOO J., BOSHER S., TRUMPER H. (2014) Safer speeds: public
acceptance and compliance. NZ Transport Agency research report No. 563. 147pp.
VADEBY A., FORSMAN A. (2014) Evaluation of New Speed Limits in Sweden: A Sample Survey,
Traffic Injury Prevention, 15:8, pp.778-785, http://dx.doi.org/10.1080/15389588.2014.885650
VAN LAMOEN N. (2016). Estimating the effects of a reduced speed enforcement threshold:
Strengths, limitations and where to from here. Transport Safety Knowledge Hub seminar,
Wellington, Apr 2016.
WILLIAMS L.M. (2013). Lowering Urban Traffic Speeds to Achieve Sustainable Land Transport
Outcomes In New Zealand. Masters of Engineering in Transport thesis, University of Canterbury.
WILSON L. (2017). High interest in 110kmh speed limit consultation for Cambridge and Tauranga
roads. Stuff NZ, Oct 30 2017. https://www.stuff.co.nz/motoring/news/98248977/high-interest-
in-110kmh-speed-limit-consultation-for-cambridge-and-tauranga-roads
WRAMBORG P. (2005). A New Approach to a Safe and Sustainable Road Structure and Street
Design for Urban Areas. 13th International Road Safety on Four Continents Conference, Warsaw
Poland, Oct 2005.

Transportation Group 2019 Conference, Te Papa, 3-6 March 2019
You can also read