The response of annual minimum temperature on the eastern central Tibetan Plateau to large volcanic eruptions over the period 1380-2014 CE
←
→
Page content transcription
If your browser does not render page correctly, please read the page content below
Clim. Past, 17, 241–252, 2021
https://doi.org/10.5194/cp-17-241-2021
© Author(s) 2021. This work is distributed under
the Creative Commons Attribution 4.0 License.

The response of annual minimum temperature on the eastern
central Tibetan Plateau to large volcanic eruptions over the
period 1380–2014 CE
Yajun Wang1,3,4 , Xuemei Shao1,2 , Yong Zhang1 , and Mingqi Li1
1 Key  Laboratory of Land Surface Pattern and Simulation, Institute of Geographic Sciences and Natural Resources,
Chinese Academy of Sciences (CAS), Beijing, 100101, China
2 College of Resources and Environment, University of Chinese Academy of Sciences, Beijing, 100049, China
3 CAS Center for Excellence in Tibetan Plateau Earth Sciences, Chinese Academy of Sciences (CAS), Beijing, 100101, China
4 Institute of Tibetan Plateau Research, Chinese Academy of Sciences (CAS), Beijing, 100101, China

Correspondence: Yong Zhang (zhangyong@igsnrr.ac.cn)

Received: 15 July 2020 – Discussion started: 10 August 2020
Revised: 13 November 2020 – Accepted: 7 December 2020 – Published: 26 January 2021

Abstract. Volcanic eruptions have a significant impact on           mospheric movement. These materials efficiently reflect in-
global temperature; their consequences are of particular in-        cident solar radiation, resulting in the cooling of the Earth’s
terest in regions that are especially sensitive to climate          surface. However, volcanic eruptions of similar magnitudes
change, like the Tibetan Plateau. In this study, we develop         do not necessarily result in cooling across all areas of the
a temperature-sensitive tree-ring-width standard chronology         world. For example, the 1991 eruption of Mount Pinatubo,
covering the period 1348–2014 CE using Qilian juniper               Philippines, caused summer cooling over much of the globe
(Sabina przewalskii (Kom.)) samples collected from the An-          in 1992, but the temperature in some areas was above aver-
imaqin Mountains on the Tibetan Plateau. We reconstruct the         age (Robock and Mao, 1992). Thus, it is not necessarily clear
annual (prior August to current July) mean minimum temper-          to what extent or in what manner a strong volcanic eruption
ature (Tmin ) since 1380 CE and show that our reconstruction        will influence temperature in a particular region.
explains 58 % of the variance during the 1960–2014 calibra-            Often referred to as the “third pole”, the Tibetan Plateau
tion period. Our results demonstrate that in 77.8 % of cases in     (TP) is especially sensitive to climate change (Yao et al.,
which a volcanic eruption with a Volcanic Explosivity Index         2012) and may therefore be more profoundly influenced
of 5 or greater occurs, temperature decreases in the year of        by volcanic eruptions. As early as 1985, studies of the re-
or the year following the eruption. The results of the super-       lationship between large volcanic eruptions (dust veil in-
posed epoch analysis also indicate that there is a high proba-      dex >1000 m3 ) and temperature variations from 1951 to
bility that the Tmin decreases for 2 years after a large volcanic   1980 in China (Zhang and Zhang, 1985) demonstrated that
eruption, especially when such eruptions occur in the North-        temperature on the northeastern TP decreased 8, 15, and
ern Hemisphere.                                                     18 months after eruptions. However, temperatures in the
                                                                    6 months immediately following an eruption were found to
                                                                    be relatively high. Jia and Shi (2001) studied climate signals
1   Introduction                                                    following volcanic eruptions from 1950 to 1997 and found
                                                                    that temperatures on the TP dropped for 2 years following
Large volcanic eruptions can affect the climate of the Earth        eruptions. However, new research focusing on regional dif-
(Robock, 2000) and have played a major role in past global          ferences over China found that winter volcanic eruptions oc-
temperature changes (Salzer and Hughes, 2007). Eruptions            curring between 1956 and 2005 led to extensive warming
emit large amounts of ash particles and gases into the at-          of winter temperatures over the Tibetan Plateau (Sun et al.,
mosphere, much of which is carried to other regions by at-

Published by Copernicus Publications on behalf of the European Geosciences Union.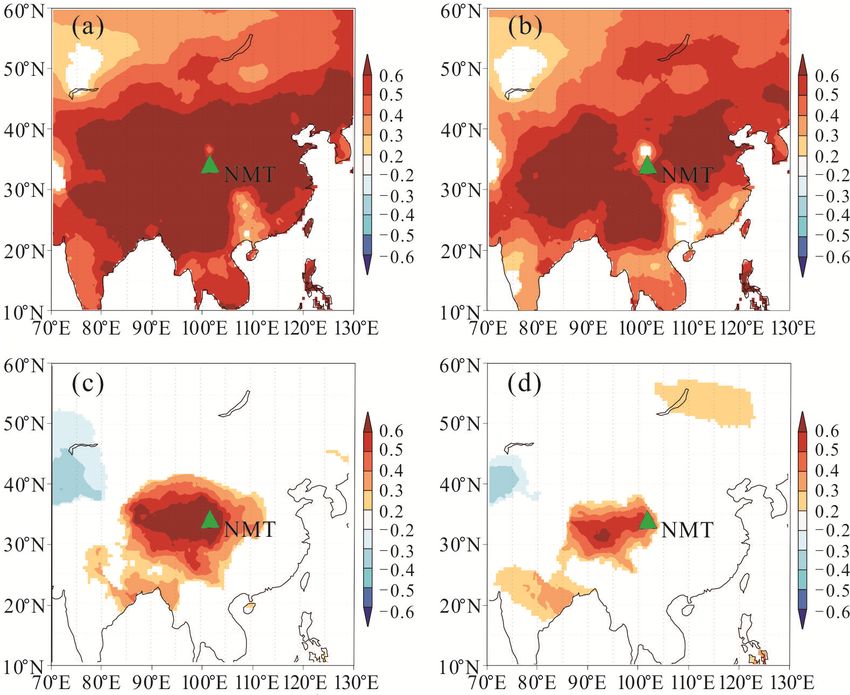
242 Y. Wang et al.: The response of annual minimum temperature on the eastern central Tibetan Plateau
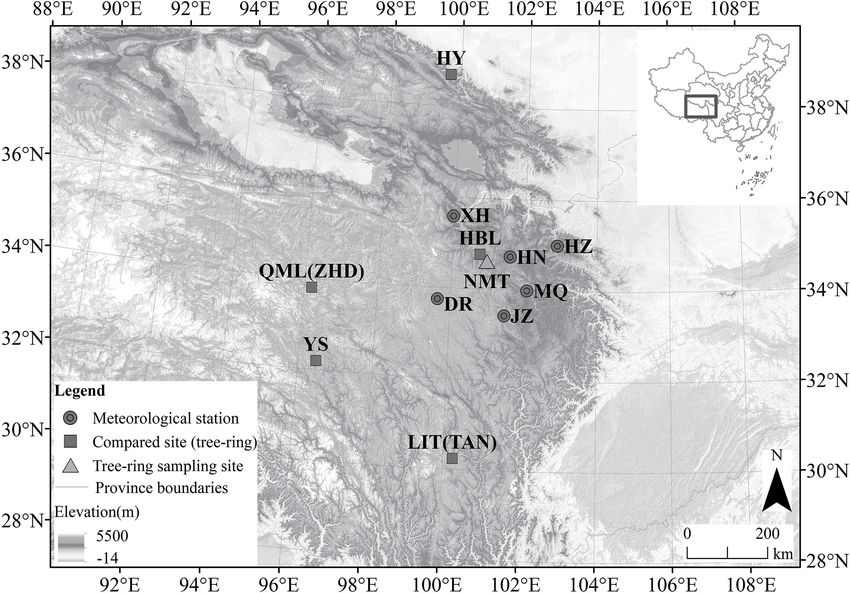
Figure 1. Locations of the sampling sites, meteorological stations, and compared sites. The digital elevation model is provided by the
Geospatial Data Cloud site, Computer Network Information Center, Chinese Academy of Sciences (http://www.gscloud.cn, last access:
10 December 2020).
2019). These studies show that temperature on the TP is af- provide a significant record of how tree growth responds to
fected by volcanic activity, but it is important to note that volcanic eruptions, but such studies are still rare across this
they are based on instrumental data, which covers a relatively area of the TP. Using tree-ring samples of Qilian juniper
short time span. Temperature changes caused by strong vol- (Sabina przewalskii (Kom.)) collected from a new sample
canic eruptions can affect tree growth (Tognetti et al., 2012). site in the southeastern part of the Animaqin Mountains, we
This influence that can be seen in the rings of certain trees develop a 667-year tree-ring-width chronology. We then use
(D’Arrigo et al., 2013; Filion et al., 1986; Lamarche and the chronology to reconstruct annual mean minimum tem-
Hirschboeck, 1984) and used to identify past volcanic ac- peratures (Tmin ) across the eastern central TP. Finally, we ex-
tivity (D’Arrigo et al., 2013; Filion et al., 1986; Lamarche plore the response of Tmin to strong volcanic eruptions (Vol-
and Hirschboeck, 1984). Especially when long-lived trees are canic Explosivity Index (VEI) >4) over the past 6 centuries.
available, tree rings can serve as temperature-sensitive prox-
ies for investigating climate responses to volcanic eruptions
that occurred prior to the instrumental record (D’Arrigo et 2 Data and methods
al., 2013; Salzer and Hughes, 2007).
Tree rings from the TP can potentially be used to study the 2.1 Tree-ring data
regional response of climate to volcanic activities. Previous
Qilian juniper samples were taken from a natural wood-
tree-ring-based studies have shown that some cold years are
land 35 km west of Ningmute town, Henan County, Qinghai
closely correlated with large volcanic events (Liang et al.,
Province, China (100.96◦ E, 34.62◦ N, 3806 m a.s.l.). This
2008, 2016; Zhang et al., 2014). Li et al. (2017a) quantita-
area is located in the sub-frigid zone and has a semi-humid
tively assessed the correlation between temperature changes
climate (Zheng et al., 2013). According to climate data of the
on the southeastern TP and volcanic eruptions and showed
Henan meteorological station (1960–2015; Table 1), mean
that most of the years of extreme cold in the past 304 years
annual temperature is 0.31◦ and mean annual precipitation is
occurred 1–2 years after major volcanic eruptions. However,
582 mm. Precipitation is mainly concentrated between May
the influence of volcanic eruptions on temperatures on the TP
and September. Because the site is close to the Yellow River
over the long term is less well understood due to the paucity
and the soil layer in the forest area is thick, the moisture con-
of data in this region.
ditions of the forest are good. The regional vegetation zone
The Animaqin Mountains are located on the northeast-
is coniferous forest and the main tree species include Sabina
ern TP and have yielded many long tree-ring series (Chen
przewalskii (Kom.), Picea crassifolia (Kom.), Betula spp.,
et al., 2016; Gou et al., 2007, 2008, 2010). These series can
and Salix cheilophila. The study area is located on the south-
Clim. Past, 17, 241–252, 2021 https://doi.org/10.5194/cp-17-241-2021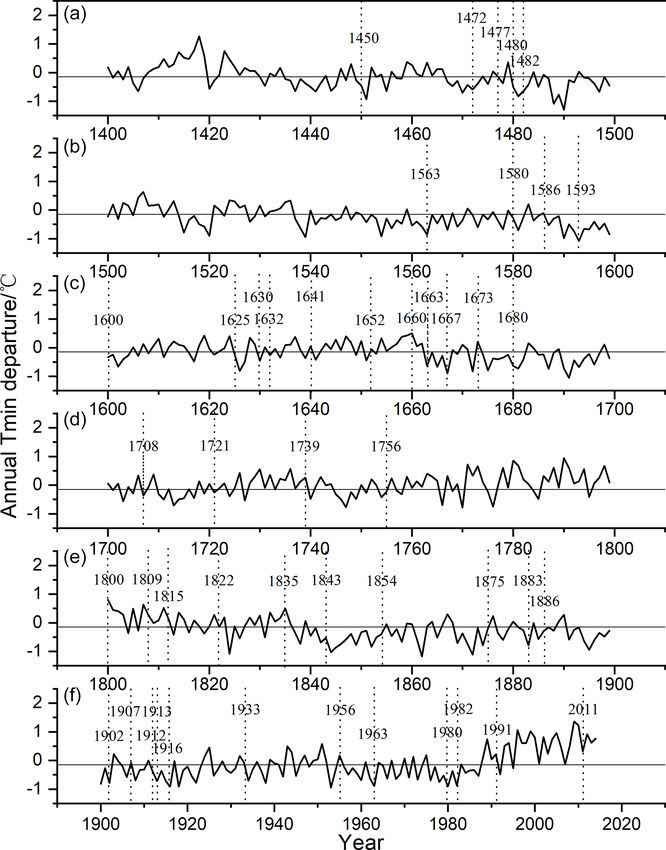
Y. Wang et al.: The response of annual minimum temperature on the eastern central Tibetan Plateau                                                   243

Table 1. Meteorological station details.

             Station      Longitude      Latitude      Elevation (m)       Observation       Annual        Annual        Annual        Annual
                                                                             time span       P (mm)      Tmean (◦ )     Tmax (◦ )     Tmin (◦ )
             ZXZ          99◦ 120        34◦ 160               4211.1       1959–1997          459.1         −3.85           3.94      −10.10
             DR           99◦ 390        33◦ 450               3967.5       1956–2015          551.7         −0.79           6.90       −6.88
             XH           99◦ 590        35◦ 350               3323.2       1960–2015          362.8          1.44           9.80       −5.79
             GL           100◦ 150       34◦ 280                 3719       1991–2015          512.4          2.25           9.07       −6.76
             TD           100◦ 390       35◦ 160               3289.4       1954–1998          424.2          0.51          10.00       −7.13
             GN           100◦ 450       35◦ 350                 3120       1999–2015          439.9          2.89          11.76       −3.81
             ZK           101◦ 280       35◦ 020               3662.8       1957–1990          476.0         −2.18           6.25       −9.15
             HN           101◦ 360       34◦ 440                 3500       1960–2015          581.7          0.31           8.98       −6.58
             JZ           101◦ 290       33◦ 260               3628.5       1959–2015          748.1          0.74           9.41       −5.71
             TR           102◦ 010       35◦ 310               2491.5       1991–2015          403.5          6.52           14.0       −1.01
             MQ           102◦ 050       34◦ 000               3471.4       1967–2015          600.4          1.71           9.13       −4.24
             LMS          102◦ 380       34◦ 050               3362.7       1957–1988          779.9          1.21           9.00       −4.49
             HZ           102◦ 540       35◦ 000                 2910       1957–2015          546.2          2.55          11.08       −3.57
            Note: ZXZ: Zhongxinzhan; DR: Dari; XH: Xinghai; GL: Guoluo; TD: Tongde; GN: Guinan; ZK: Zeku; HN: Henan; JZ: Jiuzhi; TR: Tongren; MQ:
            Maqu; LMS: Langmusi; HZ: Hezuo.

ern slope of the Animaqin Mountains and ranges in elevation                       2011qxfw/2011qsjgx, last access: 10 December 2020). De-
from 3523 to 3900 m a.s.l. (Fig. 1). The gradient of the slope                    tails are provided in Table 1.
is 30–40◦ . A total of 110 cores from 55 trees were drilled at                       Because the observation intervals of the stations shown in
chest height with an increment borer in 2015.                                     Table 1 differ, it was necessary to select the longest record
   The cores were air-dried, fixed to wooden mounts, pol-                         to ensure the stability of the correlation function. Seven sta-
ished, and cross-dated. The cores were then measured us-                          tions with instrumental data spanning 4) since 1380 CE. For this study, it is important to
ture (Tmax ) – were extracted from the China Meteorolog-                          note that eruptions that occurred in October, November, or
ical Data Sharing Service System (http://www.cma.gov.cn/                          December of a given year are marked as being a volcanic

https://doi.org/10.5194/cp-17-241-2021                                                                                 Clim. Past, 17, 241–252, 2021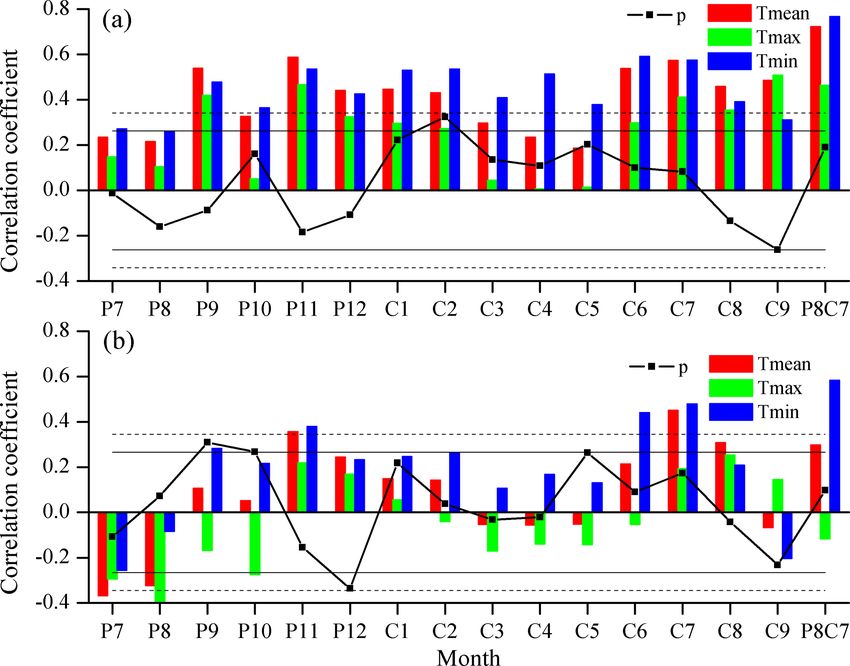
244                   Y. Wang et al.: The response of annual minimum temperature on the eastern central Tibetan Plateau

Figure 2. (a) Tree-ring-width chronology; (b) EPS and Rbar values. The dotted vertical line denotes the year 1380 CE, which is when the
EPS value exceeds the 0.85 threshold.

event in the following year. This is because tree radial growth       was analyzed by comparing differences in temperature in the
mostly stops in October on the TP. We developed seven sets            years leading up to and following an eruption. The signifi-
of volcanic data for further analysis based on geography: (a)         cance of responses was determined by a Monte Carlo resam-
global; (b) Northern Hemisphere; (c) Southern Hemisphere;             pling procedure (10 000 iterations) (Adams et al., 2003).
(d) low latitude 30◦ S–30◦ N; (e) Northern Hemisphere mid-
latitude 30–60◦ N; (f) Southern Hemisphere midlatitude 30–
                                                                      3     Results
60◦ S; and (g) Northern Hemisphere high latitude.
                                                                      3.1    Statistical characteristics of the chronology
2.4   Methods
                                                                      The tree-ring-width chronology covers the time period from
The correlation function was used to analyze the relation-            1348 to 2014 CE (Fig. 2a) and has an average length of
ship between the tree-ring-width index and climatic factors.          325.1 years. The average sensitivity is 0.171; the first-order
A fitted equation was then established using a simple lin-            autocorrelation coefficient is 0.261. The signal-to-noise ra-
ear regression and verified by the cross-validation method            tio is 21.870, the EPS is 0.956, and the Rbar ranges be-
(Michaelsen, 1987) and by split-period calibration or veri-           tween 0.31 and 0.489. The chronology is considered reliable
fication analysis (Meko and Graybill, 1995). Several statis-          (EPS >0.85) from 1380 CE, at which point the sample depth
tical tests (sign test, product mean value, reduction error,          is 9.
and coefficient of efficiency) were utilized. The split peri-
ods for calibration were 1960–1991 and 1984–2014. The cor-            3.2    Correlations between the tree-ring-width index and
relations between the observed and reconstructed series and                  climate factors
the gridded dataset (TS3.22; Mitchell and Jones, 2005) from
the University of East Anglia Climatic Research Unit (CRU)            Figure 3a shows that the tree-ring-width index correlates pos-
were analyzed using the KNMI Climate Explorer research                itively and significantly with precipitation in February and
tool (http://climexp.knmi.nl, 10 December 2020). The super-           has a positive correlation with Tmean , Tmax , and Tmin , most
posed epoch analysis (SEA) method (Haurwitz and Brier,                notably with Tmean and Tmin . For the 15-month period from
1981) was used to analyze the influence of volcanic activity          previous July to current September, the tree-ring-width in-
on regional temperature. SEA is a statistical method used to          dex correlates significantly and positively with the monthly
resolve significant signal-to-noise problems and is often used        Tmin except during previous August. Correlation with annual
to study the link between climate and discrete events such as         Tmin (from previous August through current July; hereafter
solar activity, fire events, and volcanic activity (Adams et al.,     referred to as Tmin 87) is at the 0.01 significance level.
2003; Singh and Badruddin, 2006; Swetnam, 1993; Esper et                 The first-differenced correlations between the tree-ring-
al., 2013). In this study, the year of a volcanic eruption is re-     width index and climate data are weak; in some months,
garded as year 0. The years before the volcanic eruption are          the first-order correlations are even negative (Fig. 3b). The
denoted as −1, −2, −3, and so forth, whereas the years af-            first-differenced chronology correlates significantly and pos-
ter the eruption are expressed as 1, 2, 3, etc. The impact of         itively with precipitation of the previous September and the
volcanic eruptions on temperature on the eastern central TP           current May but negatively with precipitation of the previous

Clim. Past, 17, 241–252, 2021                                                             https://doi.org/10.5194/cp-17-241-2021
Y. Wang et al.: The response of annual minimum temperature on the eastern central Tibetan Plateau 245 Figure 3. Correlations between (a) the tree-ring width index and climate data and (b) the first-differenced tree-ring-width index and climate data. The horizontal solid lines indicate the 0.05 significance level; the horizontal dashed lines show the 0.01 significance level. Annu. represents the entire period from previous August to current July. December. For temperature, the tree-ring-width index shows or FST are also significant for the split periods 1960–1991 clear correlations with Tmean and Tmin and correlates signif- and 1984–2014, indicating that the reconstructed Tmin 87 icantly and positively with Tmin of previous September and is in good agreement with the instrumental values for the November and current February, June, and July. The positive split periods and for the overall period. The product mean correlation with the annual Tmin is at the 0.01 significance value of 5.13 (p
246                       Y. Wang et al.: The response of annual minimum temperature on the eastern central Tibetan Plateau

Figure 4. (a) Scatterplot of the tree-ring index and the instrumental annual Tmin . (b) Instrumental (black line) and reconstructed (gray line)
annual Tmin . (c) Changes in annual Tmin since 1380 CE and the 11-year moving average (black solid line).

Table 2. Statistics of cross-validation and split-period calibration or verification.

                Calibration              r       2
                                                Radj              F           p      Verification       ST or FST               PMT            RE            CE
                period                                                                     period
                1960–1991          0.470       0.194        8.228       0.008        1992–2014          22+∗∗ /18+∗∗            3.651       0.743       0.017
                1984–2014          0.740       0.532       35.166       0.000        1960–1983          22+∗∗ /17+∗             2.945       0.677      −0.589
                1960–2014          0.767       0.580       74.187       0.000        1960–2014          45+∗∗ /38+∗∗            5.130       0.557       0.557
                                                    2 : variance after adjusting; ST or FST: sign test or first-difference sign test; PMT: product mean test; RE:
              r : Pearson correlation coefficient; Radj
              reduction error; CE: coefficient of efficiency. ∗ p
Y. Wang et al.: The response of annual minimum temperature on the eastern central Tibetan Plateau 247
sphere midlatitude eruptions occur at greater distances from
the TP and therefore have a weaker influence on Tmin .
Tmin in the study area decreases significantly in the years
following volcanic activity at low latitudes (Fig. 7d). Erup-
tions in the midlatitudes of the Northern Hemisphere clearly
coincide with drops in temperature, but the decreases are not
statistically significant (Fig. 7e). Eruptions in the midlati-
tudes of the Southern Hemisphere and in the high latitudes
of the Northern Hemisphere also coincide with reduced Tmin
in the year of the eruption and in the following year, but the
decreases are not statistically significant (Fig. 7f and g).
4 Discussion
4.1 Reliability of the Tmin reconstruction
The correlation between the tree-ring-width index and cli-
mate factors shows that the relationship between tree radial
Figure 5. Correlations of CRU Tmin 87 with Tmin 87: (a) instru-
mental; (b) reconstructed; (c) first-differenced instrumental; and (d) growth and precipitation is not statistically significant ex-
first-differenced reconstructed. cept in February. With the thick topsoil and humid climate in
spring and summer, the study area meets the moisture needs
of trees for radial growth. However, according to instrumen-
tal data from the GL weather station (Table 1), the elevation
of which is close to that of the sampling site, the annual Tmean
and Tmin are 2.25 and −6.76◦ , respectively. These tempera-
tures are quite low for tree growth, and the statistically sig-
nificant positive correlation between growth and temperature
shows that tree radial growth in this area is restricted by tem-
perature, especially Tmin . Tmin before and during the grow-
ing season may affect tree growth in several ways. In winter
and early spring, warmer Tmin protects roots from cold dam-
age and triggers earlier snowmelt. Warmer Tmin may there-
fore result in a longer growing season, and trees may experi-
ence increased growth during the subsequent growing season
(Pederson et al., 2004; Fu et al., 2012; Hollesen et al., 2015;
Williams et al., 2015). On the other hand, Tmin is known to
positively affect conifer tracheid division and enlargement
by controlling the onset and conclusion of xylogenesis dur-
ing the growing season (Deslauriers et al., 2003; Rossi et
al., 2008; Li et al., 2017b; Hosoo et al., 2002; Steppe et al.,
2015).
It should be mentioned that the CE value of the validation
period remains negative for the period from 1960 to 1983
even though we tested different meteorological stations and
different observation intervals in the analysis process. One
reason for this could be a distortion of the meteorological
data due to the poor management and/or the relocation of me-
teorological stations during the 1950s and 1960s on the TP.
Figure 6. Plot of Tmin reconstruction since 1400 CE. The x axis in However, the cross-validation results indicate that the equa-
each sub-figure indicates the year from the 15th century (a) to the tion is otherwise reliable. The negative CE value should not
20th century (f). The dotted lines and the numbers indicate the years influence our analysis of the high-frequency climate response
in which the 46 volcanic events used in this study occurred. to volcanism.
The correlations of the reconstructed series with CRU Tmin
reflect the regional significance of the reconstruction in gen-
eral. However, the consistent warming trend in Tmin over
https://doi.org/10.5194/cp-17-241-2021 Clim. Past, 17, 241–252, 2021248 Y. Wang et al.: The response of annual minimum temperature on the eastern central Tibetan Plateau Figure 7. SEA results of our reconstructed Tmin 87 with large volcanic eruptions in different areas: (a) global; (b) Northern Hemisphere; (c) Southern Hemisphere; (d) low latitudes 30◦ S–30◦ N; (e) Northern Hemisphere midlatitudes 30–60◦ N; (f) Southern Hemisphere midlat- itudes 30–60◦ S; and (g) Northern Hemisphere high latitudes. 0: year of volcanic eruption; −1: year before eruption; 1: year after eruption. The solid lines represent the 95 % confidence limits using Monte Carlo-type block bootstrapping (Adams et al., 2003). most of Asia (Dong et al., 2017) may result in a large area periods at the end of the 16th century and from the 1670s of significant positive correlations. For this reason, the re- to the 1720s. Although it is located further from the study sults of our first-order correlation analysis are therefore more area, the HY reconstruction also shows cold periods in the dependable; i.e., our reconstruction reliably reflects tempera- late 15th century, at the end of the 16th century, at the be- ture variations in the Animaqin Mountains and in the area to ginning of the 18th century, and in the middle of the 19th the west. century (Fig. 8a). Similarly, the low-temperature periods in The reconstructed Tmin 87 was further compared with min- the late 15th and late 16th centuries, the 1670s to 1720s, imum temperature reconstructions from other regions of the and the 1960s to 1980s are in agreement with those in the TP, including HY (northeastern TP; Zhang et al., 2014), QML(ZHD) reconstruction (Fig. 8b). The low-temperature QML(ZHD) (central TP; He et al., 2014), HBL (eastern TP; interval in the 1960s–1980s coincides with the cold inter- Gou et al., 2007), YS (southern central TP; Liang et al., val in the YS reconstruction (Fig. 8e). Finally, although the 2008), and LIT(TAN) (southeastern TP; Li and Li, 2017). LIT(TAN) reconstruction is located in a more distant region As a result of differences in reconstruction factors, study of the TP, its low-temperature intervals are consistent with regions, and methods of chronology establishment, there those in our reconstruction (e.g., the end of the 15th cen- are some differences between the chronologies. For exam- tury, 1670s–1720s, 1900s–1920s, and 1960s–80s) (Fig. 8f). ple, there are significant regional differences in Tmin recon- It is interesting that higher Rbar values appear in some spe- structions over the past 100 years. However, there is also cial intervals, i.e., the cold intervals of the 1460s–1500s and notable consistency at the interannual–multidecadal scale. 1800s–1820s and the warmest period of 1980–2014. These The correlation coefficients between our reconstruction and higher Rbar values indicate a good consistency among tree- each sequence are 0.227 (HY; p
Y. Wang et al.: The response of annual minimum temperature on the eastern central Tibetan Plateau                                  249

Figure 8. Comparison of our reconstructed Tmin 87 with other Tmin reconstructions from the TP for the period 1380–2014 CE. (a) HY,
January–August Tmin on the northeastern TP (Zhang et al., 2014); (b) QML(ZHD), January–December Tmin on the central TP (He et al.,
2014); (c) our study; (d) HBL, October–April Tmin on the eastern TP (Gou et al., 2007); (e) YS, June–August Tmin on the southern central
TP (Liang et al., 2008); (f) LIT(TAN), April-March Tmin on the southeastern TP (Li and Li, 2017). Columns with slash marks indicate warm
periods in our reconstruction; solid gray columns indicate cold periods.

other stratospheric eruption in 1809) (Cole-Dai et al., 2009).        on the TP is affected by strong volcanic eruptions, especially
Similarly, the warming in 1980–2014 is closely related to the         those occurring in the Northern Hemisphere and at low lati-
influence of human activities. These responses are indicative         tudes, and that cooling occurs in the study area within a year
of the consistent response of tree growth to strong external          or two of a major eruption.
forcing factors and of the reliability of our reconstruction.            Studies have shown that some cold intervals on the east-
                                                                      ern and southern TP may be influenced by large volcanic
                                                                      eruptions in low-latitude regions (Bi et al., 2020; Duan et
4.2   The effect of volcanic activity on the reconstructed
                                                                      al., 2019a; Krusic et al., 2015). Oman et al. (2005) used an
      Tmin 87
                                                                      ensemble simulation of the climate response to high-latitude
As shown in Fig. 6, the cooling probability in the year of            volcanic eruption to show the surface air temperature in the
or the year following a large volcanic eruption is very high.         TP were cooling in the first winter. Using the fully cou-
The effects of the Tambora volcano in 1815 (VEI = 7) were             pled NCAR Community Climate System Model (CCSM3),
recorded in many parts of the world. Our reconstruction in-           Schneider et al. (2009) found that there is significant summer
dicates that temperatures on the TP dropped by about 0.5◦ C           cooling over the continents in the case of both tropical and
in 1816, the year following the eruption. On the southeastern         high-latitude volcanism for the period 1250–1300 CE. New
TP, the cold period from 1816 to 1822 may have also been              research by Toohey et al. (2019) demonstrated that explosive
related to the Tambora eruption (Liang et al., 2008). Other           extratropical eruptions since 750 CE have produced stronger
research in the northeastern TP has shown that cold years can         hemispheric cooling than tropical eruptions. These results
be matched with known tropical volcanic events in 15 of 21            are in alignment with ours, which show that strong eruptions
cases (Zhang et al., 2014). We compared the years of cooling          in both the Northern Hemisphere and the tropics can lead to
we identified in this study with those identified by Zhang et         decreases in Tmin in our study area. Our results suggest that
al. (2014) and found that the cooling years are either the same       the effects of volcanic eruptions in the Northern Hemisphere
or within a year of each other. Liang et al. (2016) showed that       are more pronounced. It should be mentioned that a one-to-
on the southeastern TP, the 15 coldest years of the past 304          one correspondence between large eruptions and cooling is
years occurred mostly within 1–2 years of a major volcanic            not observed; temperature variability is also driven by fac-
eruption; 9 of those years are also seen in our study. The re-        tors such as circulation patterns like El Niño–Southern Os-
sults of SEA analysis further confirm that the temperature            cillation (ENSO) (Breitenmoser et al., 2012; D’Arrigo et al.,

https://doi.org/10.5194/cp-17-241-2021                                                               Clim. Past, 17, 241–252, 2021
250 Y. Wang et al.: The response of annual minimum temperature on the eastern central Tibetan Plateau
2011; Duan et al., 2019b). Cooling on the TP as a result and the National Natural Science Foundation of China (grant nos.
of large volcanic eruptions may be weakened or masked by 41630529 and 41430528).
other influencing factors (Duan et al., 2018). Establishing a
deeper understanding of the relationship between eruptions
and cooling will depend on expanding the spatial network of Review statement. This paper was edited by Kevin Anchukaitis
long-term, temperature-sensitive chronologies from the TP. and reviewed by two anonymous referees.
5 Conclusions
References
This study establishes a 667-year-long tree-ring-width
Adams, J. B., Mann, M. E., and Ammann, C. M.: Proxy evidence
chronology for the eastern central TP. The anomaly sequence for an El Niño-like response to volcanic forcing, Nature, 426,
of the annual Tmin (Tmin 87) was reconstructed for the period 274–278, 2003.
1380–2014 CE. The lowest temperatures with the longest du- Bi, Y. F., Cory, W., Fan, Z. X., Yang, J. C., Wu, Z. K., Huang, W., Li,
ration occurred in 1586–1602; the longest and warmest inter- J. W., and Yang, X. F.: Ring-widths of Abies at tree-line ecotone
val was 1991–2009. The Tmin on the TP has been increasing, reveal three centuries of early winter season temperature changes
most notably since the 1980s. The SEA analysis shows that in Yunnan, China, Clim. Dynam., 55, 945–959, 2020.
Tmin decreases in the year following strong volcanic activ- Breitenmoser, P., Beer, J., Broennimann, S., Frank, D.,
ity in the Northern Hemisphere. Thus, the climate across the Steinhilber, F., and Wanner, H.: Solar and volcanic
eastern central TP is sensitive to large-scale background cli- fingerprints in tree-ring chronologies over the past
matic factors such as volcanic activity. Further investigations 2000 years, Palaeogeogr. Palaeocl., 313–314, 127–139,
https://doi.org/10.1016/j.palaeo.2011.10.014, 2012.
are needed to fully understand the connection between vol-
Chen, F., Zhang, Y., Shao, X. M., Li, M. Q., and Yin, Z. Y.: A 2000-
canic eruptions and temperature on the TP and to incorpo- year temperature reconstruction in the Animaqin Mountains of
rate this information into regional predictions of annual and the Tibet Plateau, China, Holocene, 26, 1904–1913, 2016.
decadal temperatures. Cole-Dai, J., Ferris, D., Lanciki, A., Savarino, J., Baroni,
M., and Thiemens, M.: Cold decade (AD 1801–1819)
caused by Tambora (1815) and another (1809) strato-
Data availability. The data generated for this study are available spheric volcanic eruption, Geophys. Res. Lett., 36, L22703,
from the corresponding author. https://doi.org/10.1029/2009GL040882, 2009.
D’Arrigo, R., Seager, R., Smerdon, J. E., LeGrande, A.
N., and Cook, E. R.: The anomalous winter of 1783–
Supplement. The supplement related to this article is available 1784: was the Laki eruption or an analog of the 2009–
online at: https://doi.org/10.5194/cp-17-241-2021-supplement. 2010 winter to blame?, Geophys. Res. Lett., 38, L5706,
https://doi.org/10.1029/2011GL046696, 2011.
D’Arrigo, R., Wilson, R., and Anchukaitis, K. J.: Volcanic cooling
Author contributions. YZ and XS designed this study and took signal in tree ring temperature records for the past millennium, J.
the tree-ring samples; YW and YZ analyzed the data and prepared Geophys. Res.-Atmos., 118, 9000–9010, 2013.
the paper. ML prepared the volcanic data and took the tree-ring sam- Deslauriers, A., Morin, H., and Begin, Y.: Cellular phenology of
ples. annual ring formation of Abies balsamea in the Quebec boreal
forest (Canada), Can. J. For. Res., 33, 190–200, 2003.
Dong, S., Sun, Y., Aguilar, E., Zhang, X., Peterson, T. C., Song,
L., and Zhang, Y.: Observed changes in temperature extremes
Competing interests. The authors declare that they have no con-
over Asia and their attribution, Clim Dynam., 51, 339–353,
flict of interest.
https://doi.org/10.1007/s00382-017-3927-z, 2017.
Duan, J. P., Li, L., Ma, Z. G., Esper, J., Büntgen, U., Xo-
plaki, E., Zhang, D. J., Wang, L., Yin, H., and Luter-
Special issue statement. This article is part of the special issue bacher, J.: Summer cooling driven by large volcanic erup-
“Interdisciplinary studies of volcanic impacts on climate and soci- tions over the Tibetan Plateau, J. Climate, 31, 9869–9879,
ety”. It is not associated with a conference. https://doi.org/10.1175/JCLI-D-17-0664.1, 2018.
Duan, J. P., Ma, Z. G., Yuan, N. M., Li, L., and Chen, L.: Extremes
in the magnitude of annual temperature cycle on the Tibetan
Acknowledgements. We thank two anonymous reviewers and Plateau over the past three centuries, Clim. Dynam., 52, 3599–
the guest editor Kevin Anchukaitis for their helpful comments. 3608, 2019a.
Duan, J. P., Wu, P. L., and Ma, Z. G.: Reconciling the discrepancy
of post-volcanic cooling estimated from tree-ring reconstructions
Financial support. This research has been supported by the Na- and model simulations over the Tibetan Plateau, Atmosphere, 10,
tional Key R&D Program of China (grant no. 2016YFA0600401) 738, https://doi.org/10.3390/atmos10120738, 2019b.
Clim. Past, 17, 241–252, 2021 https://doi.org/10.5194/cp-17-241-2021Y. Wang et al.: The response of annual minimum temperature on the eastern central Tibetan Plateau 251 Esper, J., Schneider, L., Krusic, P. J., Luterbacher, J., Büntgen, Li, T. and Li, J. B.: A 564-year annual minimum temperature re- U., Timonen, M., Sirocko, F., and Zorita, E.: European sum- construction for the east central Tibetan Plateau from tree rings, mer temperature response to annually dated volcanic erup- Global Planet. Change, 157, 165–173, 2017. tions over the past nine centuries, Bull. Volcanol, 75, 736, Li, M. Q., Huang, L., Yin, Z. Y., and Shao, X. M.: Temperature https://doi.org/10.1007/s00445-013-0736-z, 2013. reconstruction and volcanic eruption signal from tree-ring width Filion, L., Payette, S., Gauthier, L., and Boutin, Y.: Light rings and maximum latewood density over the past 304 years in the in subarctic conifers as a dendrochronological tool, Quaternary southeastern Tibetan Plateau, Int. J. Biometeorol., 61, 2021– Res., 26, 272–279, 1986. 2032, https://doi.org/10.1007/s00484-017-1395-0, 2017a. Fu, Y. H., Campioli, M., Deckmyn, G., and Janssens, I. Li, X., Liang, E., Gričar, J., Rossi, S., Čufar, K., and Ellison, A. M.: A.: The impact of winter and spring temperatures on Critical minimum temperature limits xylogenesis and maintains temperate tree budburst dates: results from an exper- treelines on the southeastern Tibetan Plateau, Sci. Bull., 62, 804– imental climate manipulation, PLoS One, 7, e47324, 812, 2017b. https://doi.org/10.1371/journal.pone.0047324, 2012. Liang, E. Y., Shao, X. M., and Qin, N. S.: Tree-ring based summer Gou, X. H., Chen, F. H., Jacoby, G., Cook, E., Yang, M. X., Peng, temperature reconstruction for the source region of the Yangtze J. F., and Zhang, Y.: Rapid tree growth with respect to the last river on the Tibetan Plateau, Global Planet. Change, 61, 313– 400 years in response to climate warming, northeastern Tibetan 320, 2008. Plateau, Int. J. Climatol., 27, 1497–1503, 2007. Liang, H. X., Lyu, L., and Wahab, M.: A 382-year reconstruction Gou, X. H., Peng, J. F., Chen, F. H., Yang, M. X., Levia, D. F., and of August mean minimum temperature from tree-ring maximum Li, J. B.: A dendrochronological analysis of maximum summer latewood density on the southeastern Tibetan Plateau, China, half-year temperature variations over the past 700 years on the Dendrochronologia, 37, 1–8, 2016. northeastern Tibetan Plateau, Theor. Appl. Climatol., 93, 195– Meko, D. and Graybill, D. A.: Tree-ring reconstruction of upper gila 206, https://doi.org/10.1007/s00704-007-0336-y, 2008. river discharge, J. Am. Water Resour. As., 31, 605–616, 1995. Gou, X. H., Deng, Y., Chen, F. H., Yang, M. X., Fang, K. Y., Gao, Melvin, T. M. and Briffa, K. R.: A “signal-free” approach to dendro- L. L., Yang, T., and Zhang, F.: Tree ring based streamflow re- climatic standardisation, Dendrochronologia, 26, 71–86, 2008. construction for the upper Yellow River over the past 1234 years, Michaelsen, J.: Cross-validation in statistical climate forecast mod- Chin. Sci. Bull., 55, 4179–4186, 2010. els., J. Appl. Meteorol., 26, 1589–1600, 1987. Haurwitz, M. W. and Brier, G. W.: A critique of the superposed Mitchell, T. D. and Jones, P. D.: An improved method of construct- epoch analysis method: its application to solar–weather relations, ing a database of monthly climate observations and associated Mon. Weather. Rev., 109, 2074–2079, 1981. high-resolution grids, Int. J. Climatol., 25, 693–712, 2005. He, M. H., Yang, B., and Datsenko, N. M.: A six-hundred-year an- Oman, L., Robock, A., Stenchikov, G., Schmidt, G. A., and Ruedy, nual minimum temperature history for the central Tibetan Plateau R.: Climatic response to high-latitude volcanic eruptions, J. derived from tree-ring width series, Clim. Dynam., 43, 641–655, Geophys. Res., 110, 13, https://doi.org/10.1029/2004JD005487, 2014. 2005. Holmes, R. L.: Computer-assisted quality control in tree-ring dating Pederson, N., Cook, E. R., Jacoby, G. C., Peteet, D. M., and Grif- and measurement, Tree-Ring Bull., 44, 69–75, 1983. fin, K. L.: The influence of winter temperatures on the annual Hollesen, J., Buchwal, A., Rachlewicz, G., Hansen, B. U., Hansen, radial growth of six northern range margin tree species, Den- M. O., Stecher, O., and Elberling, B.: Winter warming as an drochronologia, 22, 7–29, 2004. important co-driver for Betula nana growth in western Green- Robock, A.: Volcanic eruptions and climate, Rev. Geophys., 38, land during the past century, Glob. Change Biol., 21, 2410–2423, 191–219, 2000. https://doi.org/10.1111/gcb.12913, 2015. Robock, A. and Mao, J.: Winter warming from large volcanic erup- Hosoo, Y., Yoshida, M., Imai, T., and Okuyama, T.: Diurnal dif- tions, Geophys. Res. Lett., 19, 2405–2408, 1992. ference in the amount of immunogold-labeled glucomannans de- Rossi, S., Deslauriers, A., Gricar, J., Seo, J. W., Rathgeber, C. B. K., tected with field emission scanning electron microscopy at the Anfodillo, T., Morin, H., Levanic, T., Oven, P., and Jalkanen, R.: innermost surface of developing secondary walls of differentiat- Critical temperatures for xylogenesis in conifers of cold climates, ing conifer tracheids, Planta, 215, 1006–1012, 2002. Global. Ecol. Biogeogr., 17, 696–707, 2008. Huang, R., Zhu, H., Liang, E., Liu, B., Shi, J., Zhang, R., Yuan, Salzer, M. W. and Hughes, M. K.: Bristlecone pine tree rings and Y., and Grießinger, J.: A tree ring-based winter temperature re- volcanic eruptions over the last 5000 yr, Quaternary Res., 67, construction for the southeastern Tibetan Plateau since 1340 CE, 57–68, 2007. Clim. Dynam., 53, 3221–3233, https://doi.org/10.1007/s00382- Shi, C., Sun, C., Wu, G., Wu, X., Chen, D., Masson-Delmotte, V., 019-04695-3, 2019. Li, J., Xue, J., Li, Z., Ji, D., Zhang, J., Fan, Z., Shen, M., Shu, Jia, P. Q. and Shi, G. Y.: Study on the effects of volcanic eruption L., and Ciais, P.: Summer Temperature over the Tibetan Plateau and solar activity on climate in China in recent 50 years, Plateau Modulated by Atlantic Multidecadal Variability, J. Climate, 32, Meteorology, 20, 225–233, 2001 (in Chinese). 4055–4067, 2019. Krusic, P. J., Cook, E. R., Dukpa, D., Putnam, A. E., Rupper, S., Singh, Y. P. and Badruddin: Statistical considerations and Schaefer, J.: Six hundred thirty-eight years of summer tem- in superposed epoch analysis and its applications in perature variability over the Bhutanese Himalaya, Geophys. Res. space research, J. Atmos. Sol.-Terr. Phy., 68, 803–813, Lett., 42, 2988–2994, 2015. https://doi.org/10.1016/j.jastp.2006.01.007, 2006. Lamarche, V. C. and Hirschboeck, K. K.: Frost rings in trees as Schneider, D. P., Ammann, C. M., Otto-Bliesner, B. L., records of major volcanic eruptions, Nature, 307, 121–126, 1984. and Kaufman, D. S.: Climate response to large, high- https://doi.org/10.5194/cp-17-241-2021 Clim. Past, 17, 241–252, 2021
252                     Y. Wang et al.: The response of annual minimum temperature on the eastern central Tibetan Plateau

   latitude and low-latitude volcanic eruptions in the Commu-             Yao, T. D., Thompson, L. G., Mosbrugger, V., Zhang, F., Ma, Y. M.,
   nity Climate System Model, J. Geophys. Res., 114, D15101,                Luo, T. X., Xu, B. Q., Yang, X. X., Joswiak, D. R., and Wang,
   https://doi.org/10.1029/2008JD011222, 2009.                              W. C.: Third pole environment (TPE), Environ. Dev., 3, 52–64,
Steppe, K., Sterck, F., and Deslauriers, A.: Diel growth dynamics           2012.
   in tree stems: linking anatomy and ecophysiology, Trends Plant         Williams, C. M., Henry, H. A., and Sinclair, B. J.: Cold
   Sci., 20, 335–343, 2015.                                                 truths: how winter drives responses of terrestrial or-
Sun, D., Zheng, J. Y., Zhang, X. Z., and Hao, Z. X.: The relationship       ganisms to climate change, Biol. Rev., 90, 214–235,
   between large volcanic eruptions in different latitudinal zones          https://doi.org/10.1111/brv.12105, 2015.
   and spatial patterns of winter temperature anomalies over China,       Zhang, X. G. and Zhang, F. G.: The relationship between large vol-
   Clim. Dynam., 53, 6437–6452, 2019.                                       canic eruptions and the dryness/wetness and cold/warm in China,
Swetnam, T. W.: Fire history and climate change                             Acta Meteorol. Sin., 3, 196–207, 1985 (in Chinese).
   in giant Sequoia Groves, Science, 262, 885–889,                        Zhang, Y., Shao, X. M., Yin, Z.-Y., and Wang, Y.: Millen-
   https://doi.org/10.1126/science.262.5135.885, 1993.                      nial minimum temperature variations in the Qilian Mountains,
Tognetti, R., Lasserre, B., Battipaglia, G., Saurer, M., Cherubini, P.,     China: evidence from tree rings, Clim. Past, 10, 1763–1778,
   and Marchetti, M.: Tree-ring responses in Araucaria araucana to          https://doi.org/10.5194/cp-10-1763-2014, 2014.
   two major eruptions of Lonquimay Volcano (Chile), Trees, 26,           Zheng, J. Y., Bian, J. J., and Ge, Q. S.: The climate regionalization
   1805–1819, 2012.                                                         in China for 1981-2010, Chin. Sci. Bull., 58, 3088–3099, 2013.
Toohey, M., Krüger, K., Schmidt, H., Timmreck, C., Sigl, M., Stof-
   fel, M., and Wilson, R.: Disproportionately strong climate forc-
   ing from extratropical explosive volcanic eruptions, Nat. Geosci.,
   12, 100–107, 2019.

Clim. Past, 17, 241–252, 2021                                                                   https://doi.org/10.5194/cp-17-241-2021
You can also read