AMMA-MODEL INTERCOMPARISON PROJECT
←
→
Page content transcription
If your browser does not render page correctly, please read the page content below
AMMA-Model
Intercomparison Project
by Frédéric Hourdin, Ionela Musat, Françoise Guichard, Paolo Michele Ruti, Florence Favot,
Marie-Angèle Filiberti,* Maï Pham, Jean-Yves Grandpeix, Jan Polcher, Pascal Marquet,
A aron Boone, Jean-Philippe L afore, Jean-Luc Redelsperger, Alessandro Dell’aquila,
Teresa Losada Doval, Abdoul Khadre Traore, and Hubert Gallée

                   A meridional cross-section analysis provides the framework to assess regional
                   and global model skill at simulating seasonal and intraseasonal variations of the
                       West African monsoon, and thus mechanisms for the region’s rainfall.

T
     HE AMMA-MIP BACK-
     GROUND. The African
     monsoon is characterized
by a well-defined meridion-
al structure of surface albedo
and vegetation (Fig. 1a), with
relatively weaker longitudinal
variations. This structure is
tightly connected to that of the
mean rainfall (Fig. 1b), with
maximum rainfall occurring in
the Sudanian region (10°–13°N)
during the northern summer. In
addition, there is a sharp transi-
tion over the Sahel (13°–18°N),
which is a particularly sensi-
tive region that experienced a
significant drought in the late
1970s and 1980s (Hulme 1992).

F ig . 1. (a) A satellite-based image of
West African surface albedo [source:
European Organisation for the
Exploitation of Meteorological Satellites
( E U M E T S AT ) ; w w w. e u m e t s a t . i n t /
HOME/Main/Access_to_Data/Meteosat_
Meteorological_Products/Product_List/
SP_1125489019643, Pinty et al. (2005)]
and (b) GPCP accumulated rainfall for
the year 2000 (mm). The red rectangle
corresponds to the zone retained for the
AMMA-CROSS section, and the green
rectangles corresponds to the mesoscale
AMMA sites.

     AMERICAN METEOROLOGICAL SOCIETY                                                       january 2010   |   95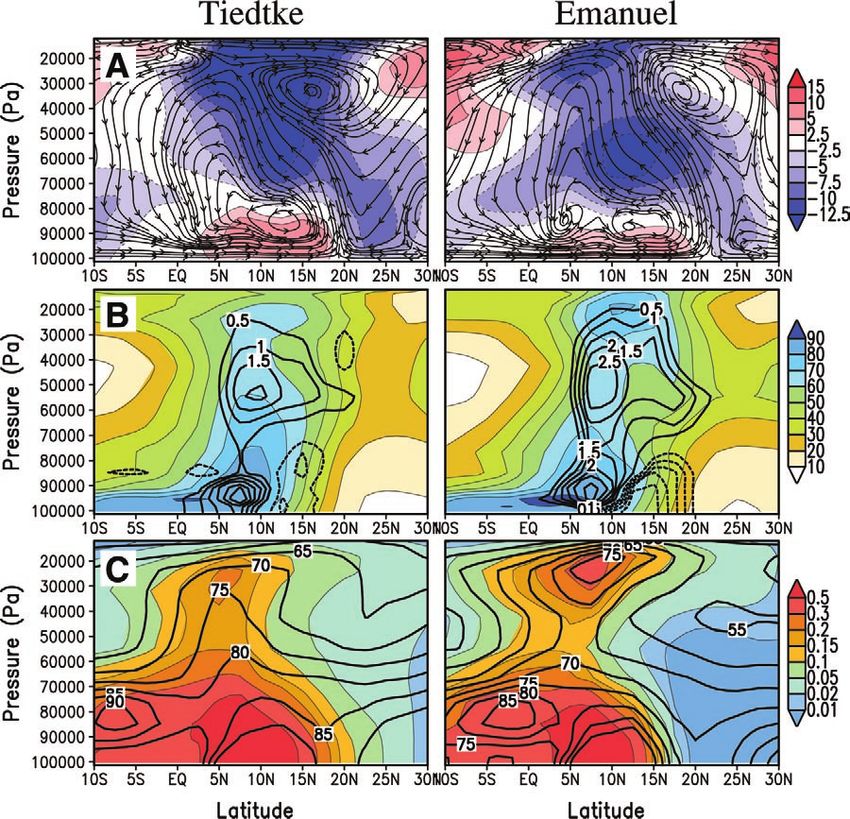
The meridional structure
       of the mean rainfall is itself
       related to the mean me-
       ridional circulation (Fig. 2),
       characterized by a near-
       surface monsoon flow that
       brings water evaporated
       over the Gulf of Guinea
       over the African continent.
       This monsoon f low con-
       verges with a southward
       dry airflow coming from
       the Sahara at the “inter-
       tropical discontinuity” in
       the region of the Saharan
       heat low where dry con-
       vection occurs. The return
       branch of this Hadley cir-
       culation at around 600 hPa
       is associated through the
       angular momentum budget
                                                 Fig. 2. Mean meridional circulation (stream lines) and associated mean zonal
       and thermal wind balance
                                                 wind (m s−1, contours). Mean Jul–Sep (JAS) conditions are from the NCEP
       with the African easterly jet             reanalyses.
       (AEJ), which, in turn, trans-
       ports additional moisture from the Indian Ocean. The vective systems or squall lines (Mathon et al. 2002).
       intertropical convergence zone (ITCZ) is positioned at The interaction between the tropical waves and the
       around 10°N, where most of the convective rainfall oc- convection plays a dominant role at both synoptic (the
       curs, with a mean upward motion that reaches 200 hPa main convective activity typically develops ahead of
       where the tropopause easterly jet is located.                    or within the trough of the African easterly waves)
            The relative zonal symmetry of the climate means and intraseasonal (very important for agriculture)
       does not account for the strong longitudinal varia- time scales. At intraseasonal and interannual time
       tions taking place on a daily basis. The accumulated scales, the African monsoon is also influenced by
       rainfall is the result of successive convective events, regional and global patterns of the sea surface tem-
       which are either local or organized as mesoscale con- perature (SST) and local coupling with surface pro-
                                                                        cesses, but the amplitude and mechanisms of those
                                                                        couplings are still very uncertain.
AFFILIATIONS: Hourdin, M usat, Grandpeix, and Polcher—
                                                                           The last Intergovernmental Panel on Climate
LMD/IPSL, UPMC, Paris, France; Guichard, Favot, Marquet,
Boone, L afore, and Redelsperger—CNRM/GAME (CNRS and                    Change   (IPCC) report (Solomon et al. 2007) con-
Météo-France), Toulouse, France; Ruti and Dell’aquila—ENEA,             firms that coupled atmosphere–ocean models poorly
Rome, Italy; Pham —SA/IPSL, UPMC, Paris, France; Losada                 simulate the West African climate (Cook and Vizy
Doval—Departamento de Geofisica y Meteorologia, Facultad de             2006). As for climate change projections, the models
Ciencias Fisicas, UCM, Madrid, Spain; Traore —LPAOSF, UCAD,             disagree even on the sign of the expected trend in the
Dakar, Senegal; Gallée —LGGE, CNRS, Grenoble, France                    mean rainfall on that region. Atmospheric models
*Deceased.
                                                                        forced by observed SSTs also fail to reproduce some
CORRESPONDING AUTHOR: Frédéric Hourdin, Laboratoire de
Météorologie Dynamique du CNRS, UPMC, Tr 45-55, 3et, BP 99,
                                                                        important aspects of the monsoon system.
75252 Paris CEDEX 05, France                                               The African Monsoon Multidisciplinary Analyses
E-mail: hourdin@lmd.jussieu.fr                                          (AMMA) project was designed in a large part to ad-
                                                                        dress the main uncertainties in atmospheric processes
The abstract for this article can be found in this issue, following the
table of contents.
                                                                        controlling the monsoon system and to contribute
DOI:10.1175/2009BAMS2791.1                                              to the evaluation and improvement of climate and
                                                                        weather forecast models in that respect. The obser-
In final form 29 June 2009
©2010 American Meteorological Society                                   vational strategy included both reinforcement of
                                                                        the operational network of surface stations and of

96   |      january 2010
soundings on a long-term basis, and an intensive field     West African monsoon system, the jumps and breaks
campaign during the monsoon (northern summer)              of the monsoon rainfall, and their relation with, in
season in 2006 (Redelsperger et al. 2006). Recognizing     particular, the mean meridional circulation, the pen-
the meridional stratification of the monsoon system,       etration of the monsoon flow, and the strength of the
a large part of the observations were focused on           Saharan heat low or the surface fluxes. The idea of the
a latitudinal transect located at approximately 0°         cross section is inherited from the Pacific cross sec-
longitude, in particular over Benin, Niger, and Mali.      tion mentioned earlier. It also has been found to be a
Three “mesoscale sites,” corresponding to three typi-      suitable framework for more academic investigations
cal climates, were equipped to document the land–          (e. g., Zheng and Eltahir 1998; Peyrillé et al. 2007).
atmosphere interactions along the transect.                    In the second part, AMMA-MAPS, a subset of
    The coordinated intercomparison and evaluation         variables (on a few standard pressure levels for 3D
of global and regional atmospheric models started at       fields) are provided over the region 10°S–30°N, 35°W–
the beginning of the AMMA project. This led to the         30°E. The focus of AMMA-MAPS is on the African
creation of AMMA-Model Intercomparison Project             easterly jet and easterly waves, in conjunction with
(AMMA-MIP), a light, focused, and process-oriented         rainfall, the location of convection, and surface fluxes
intercomparison exercise. The models, either global        or orography.
or regional, are evaluated in terms of their ability to        The exercise is focused on the atmospheric com-
reproduce the mean West African climate and, in            ponent and its coupling with continental surfaces.
particular, the seasonal and intraseasonal variations      Only atmospheric models with imposed SSTs are
of rainfall and associated dynamical structures.           considered, because the biases of coupled models are
    The exercise is “light” in the sense that the mod-     generally related to large biases of the SST. Therefore,
eling teams are only requested to provide relevant         they are not suitable for regional studies over West
subsets of the full model outputs made available on        Africa. Years 2000 (a dry summer during which the
an FTP site. A parallel effort is also carried out for     JET2000 campaign was conducted; Thorncroft et
observational datasets. A series of graphics are made      al. 2003) and 2003 (a wetter year) were selected for a
available through a Web interface (http://amma-mip.        first approach.
lmd.jussieu.fr). In this sense, AMMA-MIP is more
comparable to exercises organized within the frame-        Models involved. So far, six teams have contributed to
work of the Global Energy and Water Cycle Experi-          the AMMA-MIP. Four global models are involved:
ment (GEWEX) Cloud System Study (GCSS) group—              Action de Recherche Petite Echelle Grande Echelle
such as the eastern Pacific cross section (Siebesma et     (ARPEGE)-Climat, run at the Centre National de
al. 2004)—than to the classical model intercomparison      Recherches Météorologiques (CNRM), ECHAM4,
projects developed in the climate community.               run at the Italian National Agency for New Technolo-
    The design of the AMMA-MIP is presented herein.        gies, Energy and Sustainable Economic Development
Next, some results for two contrasting years (2000         (ENEA; Ruti et al. 2006), the University of California,
and 2003) are shown, which were selected prior to the      Los Angeles, version 7.3 (UCLA7.3) GCM (Mechoso
campaign. This first intercomparison is also aiding        et al. 2000), run at the Universidad Complutense de
in the preparation for the next phase of this project,     Madrid (UCM), and the Laboratoire de Météorologie
which will include the 2006 intensive field campaign       Dynamique model (LMDZ4), run at the L’Institut
experiment.                                                Pierre-Simon Laplace (IPSL; Hourdin et al. 2006). A
                                                           limited-area simulation with Modèle Atmosphérique
THE AMMA-MIP STATUS. AMMA-MIP design.                      Régional (MAR; Gallée et al. 2004) was provided
AMMA-MIP is made of two parts, corresponding to            by the Laboratoire de Glaciologie et Géophysique
two types of output files, both of which are provided      de l’Environmement (LGGE). The LMDZ4 model
at daily frequency for a full seasonal cycle. (For those   is also run with a refined grid over West Africa
who would like to contribute, a full description of        (zoom) that provides another approach to regional
AMMA-MIP is available online at http://amma-mip.           climate modeling. Two configurations of this zoomed
lmd.jussieu.fr/description.html.)                          version are tested at IPSL and the Laboratoire de
    The first part, the AMMA cross section (AMMA-          Physique de l’Atmosphère et de l’Océan Simeon
CROSS), is a latitude–altitude cross section made of       Fongang (LPAOSF). (Descriptions of the various
10°W–10°E zonally averaged variables (red boxes            models are available at http://amma-mip.lmd.jussieu.
in Fig. 1) over the region of 20°S–40°N. AMMA-             fr/MODELS/Welcome.html.) Two teams provided
CROSS is focused on the latitudinal extent of the          ensemble simulations of 5 (IPSL) and 10 (UCM)

AMERICAN METEOROLOGICAL SOCIETY                                                              january 2010         |   97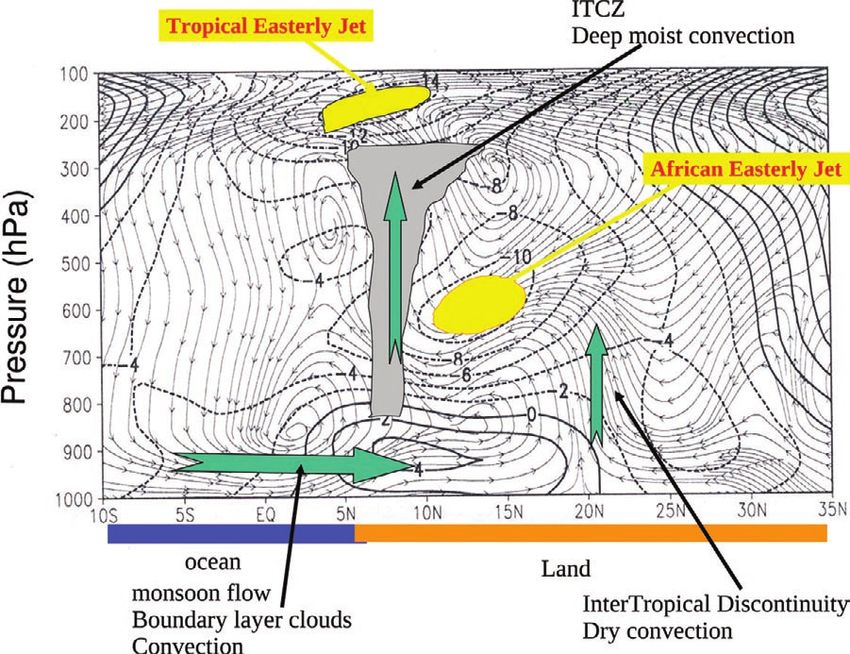
members, respectively, performed with the same                    (10°W–10°E) on the one hand and 2D horizontal maps
     boundary conditions but different initial states. Two             on the other (data are available by anonymous ftp at
     teams also provided sensitivity experiments to model              cnrm-ftp.meteo.fr in the pub-moana/amma-cross
     parameterized convection [LMDZ was run at IPSL                    directory.)
     either with the Tiedtke (1989) convection scheme                     Here we used the Global Precipitation Clima-
     or with the Emanuel (1993) convection scheme] and                 tology Project (GPCP; daily and 1° resolution;
     vertical resolution (ECHAM4 was run at ENEA with                  Huffman et al. 1997) and the Climate Prediction
     19 or 42 layers). Additional details on the model con-            Center Merged Analysis of Precipitation (CMAP;
     figurations are given in Table 1.                                 pentad, monthly, and 2.5° resolution; Xie and Arkin
                                                                       1997) rainfall climatologies, and the following vari-
     Observations. An effort has been carried out in parallel          ous reanalysis products available: National Centers
     with respect to observational products, and the most              for Environmental Prediction–National Center
     relevant sources of data have been identified. As was             for Atmospheric Research (NCEP–NCAR) 40-yr
     done for the simulation outputs, the observations                 Reanalysis (Kalnay et al. 1996), NCEP/Department
     are preprocessed in the form of mean cross section                of Energy Global Reanalysis 2 (NCEP-2; Kanamitsu

 Table 1. Details on the AMMA-MIP model configurations are given together with some diagnostics. The
 simulations are titled with the name of the corresponding institute followed by the number of the run for
 the ensemble runs or by the number of vertical levels for the ENEA runs. Most models use the AMIP SSTs
 (Taylor et al. 2000) except for ARPEGE, which uses the Reynolds OIv2 weekly SSTs (Reynolds et al. 2002)
 and the MAR model, which uses the SST derived from ECMWF operational analysis (ECOA). For the vari-
 ous models, we show for the JJAS season of year 2000: the AEJ latitude; the zonal wind root-mean-square
 error when compared with ERA-40; the mean rainfall over a West African box (0°–18°N, 10°W–10°E), a
 Sahelian box (13°–18°N, 10°W–10°E), a Sudanian box (10°–13°N, 10°W–10°E), a continental Guinean box
 (5°–10°N, 10°W–10°E), and a Gulf of Guinea box (0°–5°N, 10°W–10°E) for all of the AMMA-MIP simula-
 tions and observation datasets. For the IPSL and UCM ensemble runs, we show the lowermost and the
 uppermost limit within the members. For the observed AEJ latitude, the first number corresponds to
 ERA-40 and the second to the maximum latitude between the NCEP–NCAR and NCEP-2 reanalyses. For
 the “observed” zonal wind rms, the two values correspond to NCEP–NCAR and NCEP-2 reanalyses com-
 pared with ERA-40. For the observed rainfall, the two values correspond to th GPCP and CMAP datasets.
 Institute              CNRM        ENEA         UCM          IPSL          IPSLTI        IPSLWA   LPAOSF       LGGE        Obs.
 Model                 ARPEGE     ECHAM4        UCLA7.3      LMDZ4         LMDZ4          LMDZ4    LMDZ4        MAR          —
 Mesh size (km)          300         370          220          300           300            80       140         40          —
 No. layers
 total                   31         19–42          29          19             19            19        19         40          —
 Surface–800 hPa          7         5–11           3            5             5             5         5           11         —
 800–200 hPa             15         7–18           9            6             6             6         6          28          —
 SST                   Reynolds     AMIP         AMIP         AMIP          AMIP          AMIP      AMIP        ECOA         —
                                                                          Convection                            Limited
                                                                                          Zoom      Zoom
                       climate     2 vertical   Ensemble    Ensemble       Tiedtke                                area
 Specificity                                                                              West      West                     —
                       version    resolution      (10)         (5)          versus                              ECOA
                                                                                          Africa    Africa
                                                                           Emanuel                             Boundary
                                                        JJAS mean zonal wind
 AEJ lat (°N)            13.3     12.9–14.8     15.2–15.8   10.9–12.5        11.6          16.1    13.6-13.9     13.1     12.8-12.2
 RMS error (m s ) −1
                         4.4       3.8–4.6       4.1–4.4     3.5– 3.8        3.8           4.5     4.0–4.2       3.2      2.9– 3.0
                                                  JJAS mean rainfall (mm day )       −1

 West Africa             3.0       3.4–3.0      5.6–6.0      2.6–3.0         3.2           5.3     4.6–4.3       5.9      4.2–4.4
 Sahel, 13°–18°N         1.8       2.6–2.2       5.7–6.0     0.8–1.1         0.6           4.5     2.7–2.4       2.6      2.2–2.8
 Sudan, 10°–13°N         4.4       4.9–4.4      9.9–10.4     3.3–3.9         3.6           8.9     7.0–6.5       8.0      5.1–6.6
 Guinea, 5°–10°N         4.6       5.0–4.2      5.8–6.4      5.3–6.2         7.2           7.6     7.8–7.5       8.8      6.2–6.4
 Atlantic, 0°–5°N        1.8       1.8–1.7      2.5–2.9      1.1–1.3         1.6           1.5     1.7–1.7       5.1      3.6–2.8

98   |         january 2010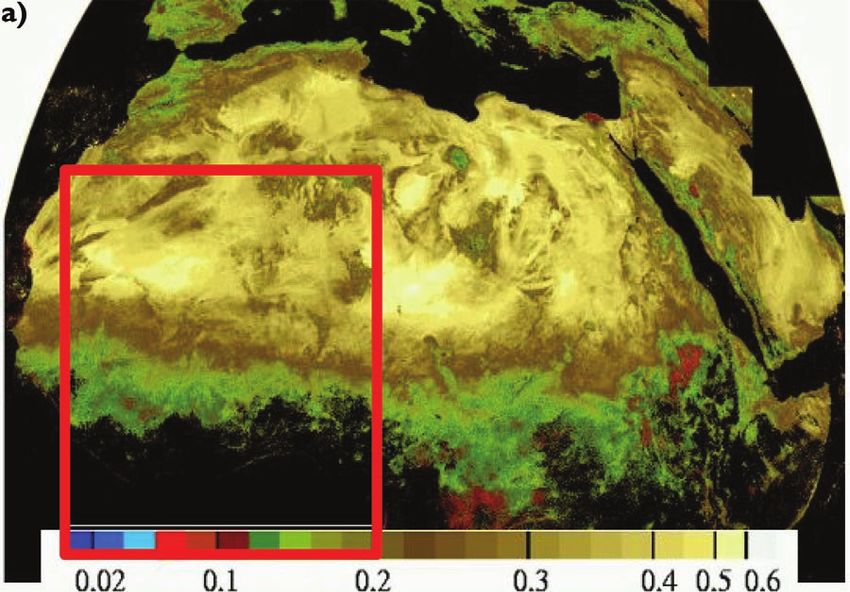
et al. 2002), 40-yr European Centre for Medium-          in the midtroposphere. However, important differ-
Range Weather Forecasts (ECMWF) Re-Analysis              ences are observed. The monsoon flow is too strong
(ERA-40; Uppala et al. 2005), and ERA-Interim            for some simulations [IPSL model using the Tiedke
(Simmons et al. 2006).                                   convection scheme (IPSLTI), CNRM, UCM, and
                                                         LGGE] and is somewhat too weak for others [ENEA
AMMA-MIP: FIRST RESULTS. Preliminary                     model run with 19 vertical layers (ENEAL 19) and 42
results presented here illustrate 1) the current skill   vertical layers (ENEAL42)]. ENEA, IPSL, and LGGE
of atmospheric models to reproduce the African           correctly simulate an isolated AEJ. Differences are
monsoon; 2) the relevance of the AMMA-MIP frame-         also seen above 400 hPa, with, for instance, too strong
work; and 3) the strategy foreseen for the use of the    westerlies in the ENEA simulations. Those differences
AMMA observations. Additional results are available      are quantified for all the simulations in Table 1 by
on the AMMA-MIP Web site.                                computing the root-mean-square difference between
                                                         the mean JJAS zonal wind over the cross section and
Mean dynamical structure. The June–September (JJAS)      that obtained in ERA-40 for the year 2000.
conditions for AMMA-CROSS mean zonal wind                   The comparison between the two ENEA simula-
are presented for the AMMA-MIP models and for            tions gives an idea of the effect of the vertical resolu-
NCEP-2 and ERA-40 in Fig. 3. The various models          tion; the comparison of IPSL1–IPSLTI documents the
capture the main elements of the zonal circulation,      major effect of parameterized convection, whereas
such as the westerlies (positive contours and red        that of UCM1 and UCM2 illustrate the internal (not
colors) near the surface within the monsoon flow         forced by SST variability) interannual variability as
(equator–20°N) or the predominance of easterlies         produced by GCMs. LPAOSF, IPSL model run with a

Fig. 3. Latitude–pressure cross section (averaged between 10°W and 10°E) of the zonal wind (m s−1) for
the various configurations (see Table 1) and for NCEP-2 and ERA-40 reanalyses; year 2000, JJAS.

AMERICAN METEOROLOGICAL SOCIETY                                                             january 2010         |   99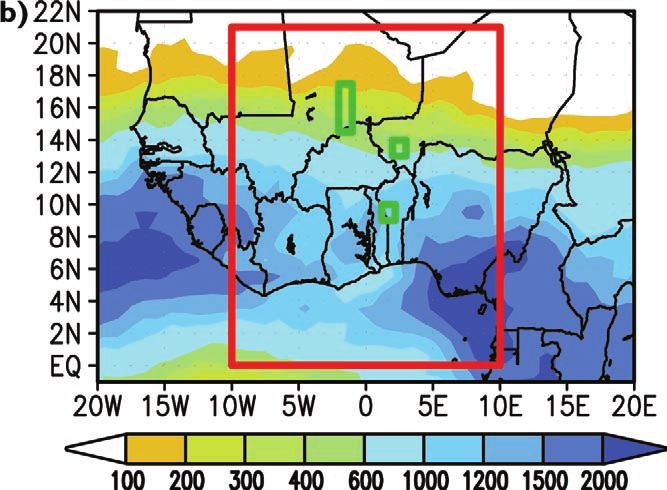
Fig. 4. The seasonal evolution of the 10-day running mean of the 10°W–10°E averaged rainfall (mm
    day−1) for simulations CNRM, ENEAL19, ENEAL42 , LPAOSF2, IPSLTI, IPSL1, IPSLWA, LGGE, and
    UCM1, as well as for NCEP-2 reanalysis, CMAP and GPCP observations; year 2000.

    zoom over West Africa (IPSLWA), and IPSL1 are run                   the Guinean Gulf, most models underestimate the
    with LMDZ4 model versions that are very similar but                 rainfall; only one model is giving about the right
    have different horizontal grids.                                    value (UCM) and one model clearly overestimates
                                                                        it (LGGE). All of the models show active sequences
    Rainfall. A comparison of the seasonal cycle of rainfall            and breaks, although the intraseasonal variability is
    is shown in Fig. 4 for the year 2000. The simulations               probably too weak in some models (LPAOSF) and too
    displayed are the same as those in Fig. 3. The models               strong in others (CNRM; not shown).
    generally capture the latitudinal migration of the ITCZ                 The rainfall and dynamical structures are expected
    from south of the equator over the ocean (the Guinean               to be related. In particular, the accumulated rainfall
    coast is located at about 5°N) during northern winter               over the Sahelian band is expected to be related to
    to West Africa during the monsoon season.                           the depth of the penetration of the monsoon flow
        However, the rainfall intensity over the Sahel                  toward the Sahara, and potentially to the position of
    (around 15°N in Fig. 4 ) is very different in the vari-             the easterly jet and easterly waves, which are known
    ous models. The simulated mean rainfall rate for JJAS               to modulate the convective activity over Sahel.
    over the Sahel box in Table 1 (13°–18°N, 10°W–10°E)                     A positive correlation between the AEJ core latitude1
    varies from 0.6 (IPSLTI) to 6 mm day−1 (UCM). Over                  and the Sahelian mean rainfall is indeed visible in the

    1
        The AEJ core latitude is defined here as a weighted latitude in the region where the zonal wind is δu (2 m s–1) larger than the
        minimum value ∫5N 24N
                              max(umin+δu – u,0)ϕdϕ/∫5N24N
                                                           max(umin+δu – u,0)dϕ. The computation is done at the pressure level of the
        jet maximum.

100 |          january 2010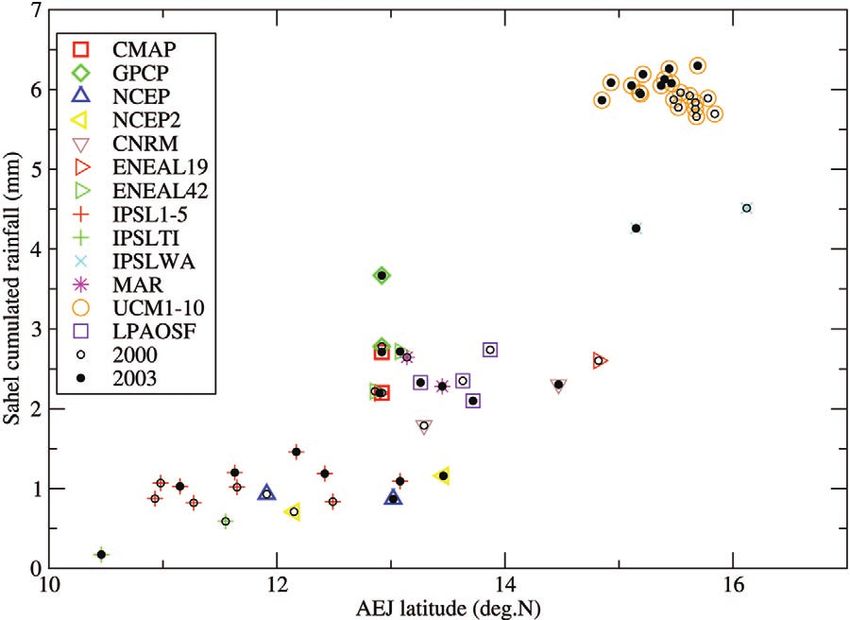
Notice also that the re-
analyses are in rather good
agreement with each other
for the jet core location but
are quite far from observa-
tion for the Sahelian accu-
mulated rainfall, making
the reanalysis similar to
rather bad climate models
in that respect.
Surface fluxes. The latitudi-
nal gradients of moist static
energy have been shown to
play a key role in the control
of the African monsoon
(Eltahir and Gong 1996).
This latitudinal gradient is
forced at first order by the
thermal contrasts between
Fig. 5. Latitude of AEJ (°N) versus mean rainfall over a Sahelian box (13°–18°N,
the Gulf of Guinea (which
10°W–10°E) for all of the AMMA-MIP simulations; for the CMAP and GPCP
observations; and NCEP–NCAR, and NCEP-2 reanalyses for JJAS season, is relatively cool at that
and 2000 (empty circle) and 2003 (filled circle) years. The AEJ latitude for time) and the Sahara. The
CMAP and GPCP corresponds to the ERA-40 reanalyses for year 2000 and aerosols and clouds signifi-
to ERA-Interim reanalyses for year 2003. cantly modulate the latitu-
dinal contrasts of top of the
multimodel multirun AMMA-MIP database, as illus- atmosphere and surface radiative fluxes. The surface
trated in Fig. 5, which suggests that a large part of the albedo can be an important source of discrepancy
biases comes from a shift in the whole monsoon system between the various models. Surface hydrology also
in latitude. For a particular model configuration (see plays a key role through the partitioning of sensible
figure), the dispersion either as a result of the internal and latent heat fluxes (e.g., Fontaine et al. 2002).
variability (as given by the ensemble runs when avail- Validation of climate models in terms of surface
able) or the boundary conditions [2000 (empty circles) fluxes is one of the expected important outcomes of
versus 2003 (filled circles) SSTs] is generally smaller the campaign. Data are currently being processed
than the typical difference between two models or be- in a form usable for model validation. In addition to
tween one model and observations. This can be assessed direct observations, the AMMA Land Surface Model
further by looking at the results in Table 1. Intercomparison Project (ALMIP; Boone et al. 2009)
Most simulations show a somewhat larger rain- provides a collection of simulated surface fields built
fall when forced by 2003 rather than by 2000 SSTs. using so-called soil–vegetation–atmosphere transfer
However, the difference is not much larger than models forced by a combination of observed, satellite-
the internal variability given by the UCM and IPSL based, and forecast meteorological fields.
ensemble simulations for given SST conditions, sug- First analyses (not shown) revealed the large
gesting that even the larger observed rainfall in 2003 dispersion between the various AMMA-MIP
could be due to internal variability rather than being models in terms of cloud forcing, and latent and
forced by SSTs. The NCEP–NCAR reanalysis and sensible heat fluxes, a point which merits further
ERA-40 suggest a jet farther north by about 1° in 2003 investigations.
(Grist and Nicholson 2001); however, no systematic
correlation is found between a northward migration Parameterized convection and meridinal transport.
of the jet and larger rainfall in 2003 with respect to The parameterized convection is a key issue for
2000 when looking at the models. It must be kept in climate modeling, in particular over tropical conti-
mind that a displacement by 1° is a displacement by nents. This aspect is illustrated based on results of
less than one grid point for most models and reanaly- the LMDZ4 model with the two deep convection
sis products. schemes (corresponding to simulations IPSL1 and
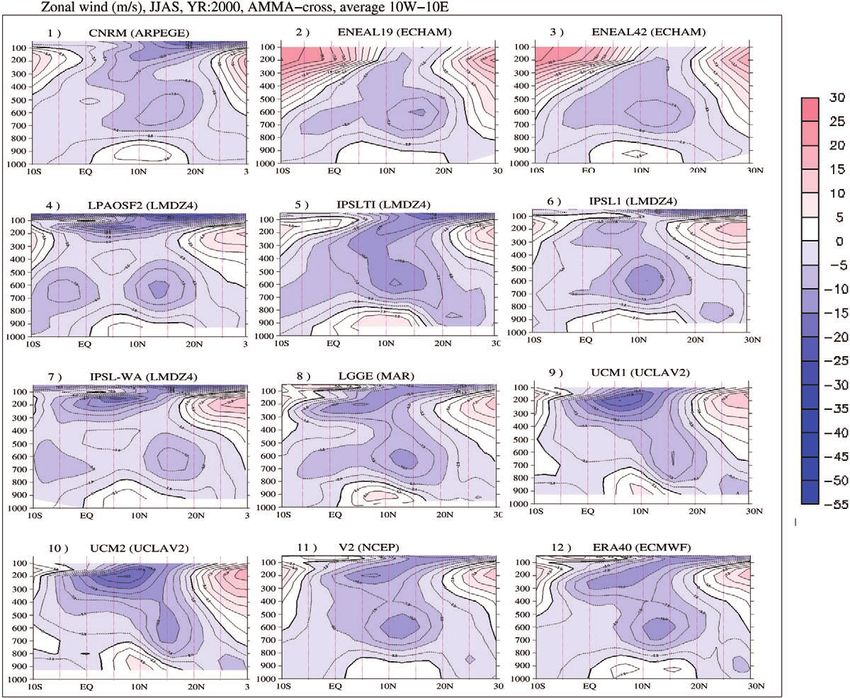
AMERICAN METEOROLOGICAL SOCIETY january 2010 | 101IPSLTI in Fig. 3). With the
Emanuel (1993) convec-
tive scheme (Fig. 6), the
convective heating [Fig. 6b,
contours (K day−1)] peaks
higher up in the atmo-
s phe re , w it h s t ron ge r
heating rates than for the
Tiedtke (1989) scheme. The
cooling (dashed contours)
in the lower atmosphere
over Sahel due to the evap-
oration of convective rain-
fall is also stronger with
Emanuel. Those differenc-
es have a strong effect on
the large-scale dynamics:
the African easterly jet
(Fig. 6a, colors) is much
better represented with the
Emanuel scheme (shown
in Fig. 3); in the ITCZ re-
gion (5°–15°N), the ascent
of the mean meridional
circulation (streamlines)
penetrates much higher in
Fig. 6. Illustration of the effect of (left) parameterized convection (Tiedtke
the Emanuel case. Notice
1989) versus (right) Emanuel (1993) schemes in the AMMA-CROSS frame-
that part of the changes work for July: (a) mean meridional circulation (streamlines) and mean zonal
obtained over West Africa wind (colors, m s−1); (b) relative humidity (colors %) and parameterized con-
may come from the effect vective heating rate (contours, K day−1); and (c) CO concentrations (contours,
of the convective scheme ppmv) and idealized tracer emitted in the boundary layer over the African
at larger scales, such as continent, south of 10°N (colors, arbitrary units).
for the upper-level easter-
lies. The relative humidity
(Fig. 6b, colors) shows a signature of this different and coupled chemistry–climate models, comparing
transport with, in particular, a local maximum that both realistic chemical tracers and tracers emitted
is stronger and higher in the ITCZ for the Emanuel in latitude bands close to the surface, either over the
scheme. An additional interest of the AMMA cam- continent or the ocean.
paign for model evaluation is the joint observation of
atmospheric composition and dynamics. The links CONCLUSIONS AND EXTENSION. Some
between composition and dynamics is illustrated for conclusions can been retained from this first phase
carbon monoxide (CO) with the climate–chemistry of the AMMA-MIP exercise:
model LMDZ-Interaction of Chemistry and Aero-
sols (INCA; Hauglustaine et al. 2004) as well as with 1) Climate models, when forced by observed SSTs,
an idealized tracer emitted in the boundary layer succeed in simulating the main characteristics
(between the surface and 850 hPa) over the African of the West African monsoon as the AEJ and the
continent south of 10°N, experiencing a radioactive latitudinal migration of the rainfall band with the
decay with a lifetime of a few days (Fig. 6c). Tracers season.
are pumped higher by the more penetrative Emanuel 2) However, huge errors remain when looking in
scheme, consistent with what is seen in the other more detail.
panels. On the basis of those considerations, it was 3) The accumulated rainfall over Sahel, one key vari-
decided to extend the AMMA-CROSS framework to able in terms of social effect, varies by a factor of
the intercomparison of chemistry transport models 10 for the models available in the database.
102 | january 20104) The accumulated rainfall over Sahel is not better agencies, especially from France, the United Kingdom,
represented in the available reanalysis (NCEP-2 the United States, and Africa. It has been the benefi-
or ERA-40) than in current climate models. ciary of a major financial contribution from the European
5) A larger rainfall over Sahel is generally associated Community’s Sixth Framework Research Programme.
with an AEJ location farther north, suggesting Detailed information on scientific coordination and fund-
that part of the discrepancies come from a general ing is available on the AMMA International Web site (www.
shift of the whole system in latitude. amma-international.org). NCEP–NCAR 40-yr reanalysis
6) The parameterized convection has also a major and NCEP-2 data were provided by the NOAA–CIRES
effect. Climate Diagnostics Center, Boulder, Colorado. GPCP data
7) No model is able to simulate correctly all the were provided by the NOAA/OAR/ESRL/PSD, Boulder,
aspects of the monsoon system (ECHAM4 shows Colorado (www.cdc.noaa.gov). ERA-40 and ERA-Interim
probably the best compromise at this stage.). data used in this study/project have been obtained from the
8) The model-specific bias errors for Sahel rainfall, ClimServ IPSL data center (http://climserv.ipsl.polytech-
dynamical structures, or surface fluxes are con- nique.fr/). The IPSL numerical simulations were performed
sistent across the year, completely overwhelming on the NEC-SX8 of the IDRIS/CNRS computer center.
interannual differences in the experiments. This
is a strong argument for supporting the value
of the AMMA field campaign—focused on one REFERENCES
particular year—to importantly constrain climate Boone, A., and Coauthors, 2009: The AMMA Land
models. Surface Model Intercomparison Project (ALMIP).
Bull. Amer. Meteor. Soc., 90, 1865–1880.
The next phase of the AMMA-MIP exercise will Cook, K. H., and E. K. Vizy, 2006: Coupled model
focus on 2005/06, the year of the intensive phase of simulations of the West African monsoon system:
the AMMA field experiment (Janicot et al. 2008). Twentieth- and twenty-first-century simulations. J.
Some model results are already available on the data- Climate, 19, 3681–3703.
base. Contributions from other modeling teams are, Eltahir, E. A. B., and C. Gong, 1996: Dynamics of
of course, welcome. As for observations, particular wet and dry years in West Africa. J. Climate, 9,
care will be given to the compilation of AMMA 1030–1042.
soundings (classical soundings, dropsondes sent Emanuel, K. A., 1993: A cumulus representation based
from aircrafts or balloons; Parker et al. 2008) and on the episodic mixing model: The importance of
boundary fluxes measurements along the AMMA mixing and microphysics in predicting humidity. The
transect, obtained either from dedicated aircraft Representation of Cumulus Convection in Numerical
measurements or at the mesoscale sites with flux Models of the Atmosphere, Meteor. Monogr., No. 46,
towers. The ALMIP database should also yield Amer. Meteor. Soc., 185–192.
some clues to assess the representation of coupled Fontaine, B., N. Philippon, S. Trzaska, and P. Roucou,
processes at the surface. 2002: Spring to summer changes in the West
The AMMA-MIP project, and in particular the African monsoon t hrough NCEP/NCAR re-
AMMA cross-section analysis, provides a relevant analyses (1968–1998). J. Geophys. Res., 107, 4186,
framework for focusing on the climate feedbacks doi:10.1029/2001JD000834.
and on the interactions between climate components, Gallée, H., and Coauthors, 2004: A high-resolution
such as atmosphere, land surface, and chemistry. It is simulation of a West African rainy season using a
a unique framework, allowing the study of the effect regional climate model. J. Geophys. Res., 109, 5108,
of different climatic components on the hydrological doi:10.1029/2003JD004020.
cycle, and it could be a good candidate for a GCSS. Grist, J., and S. E. Nicholson, 2001: A study of the dy-
It is also envisaged for the future to analyze in the namic factors influencing the rainfall variability in
AMMA-MIP framework the simulations made avail- the West African Sahel. J. Climate, 14, 1337–1359.
able in the West African Monsoon Model Evaluation Hauglustaine, D. A., F. Hourdin, L. Jourdain, M.-A.
program. This framework may help evaluate the bi- Filiberti, S. Walters, J.-F. Lamarque, and E. A.
ases of numerical weather forecast models as well. Holland, 2004: Interactive chemistry in the Labora-
toire de Météorologie Dynamique general circulation
ACKNOWLEDGMENTS. On the basis of a French model: Description and background tropospheric
initiative, AMMA was built by an international scien- chemistry evaluation. J. Geophys. Res., 109, D04314,
tific group and is currently funded by a large number of doi:10.1029/2003JD003957.
AMERICAN METEOROLOGICAL SOCIETY january 2010 | 103Hourdin, F., and Coauthors, 2006: The LMDZ4 general Reynolds, R., N. Rayner, T. Smith, D. Stokes, and
circulation model: Climate performance and sen- W. Wang, 2002: An improved in situ and satellite SST
sitivity to parametrized physics with emphasis on analysis for climate. J. Climate, 15, 1609–1625.
tropical convection. Climate Dyn., 27, 787–813. Ruti, P. M., D. di Rocco, and S. Gualdi, 2006: Impact of
Huffman, G., and Coauthors, 1997: The Global Precipita- increased vertical resolution on simulation of tropi-
tion Climatology Project (GPCP) combined precipita- cal climate. Theor. Appl. Climatol., 85, 61–80.
tion dataset. Bull. Amer. Meteor. Soc., 78, 5–20. Siebesma, A. P., and Coauthors, 2004: Cloud representa-
Hulme, M., 1992: Rainfall changes in Africa: 1931-1960 tion in general-circulation models over the northern
to 1961-1990. Int. J. Climatol., 12, 685–699. Pacific Ocean: A EUROCS intercomparison study.
Janicot, S., and Coauthors, 2008: Large-scale overview Quart. J. Roy. Meteor. Soc., 130, 3245–3267.
of the summer monsoon over West Africa during Simmons, A., S. Uppala, D. Dee, and S. Kobayashi, 2006:
the AMMA field experiment in 2006. Ann. Geophys., ERA-Interim: New ECMWF reanalysis products
26, 2569–2595. from 1989 onwards. ECMWF Newsletter, No. 110,
Kalnay, E., and Coauthors, 1996: The NCEP/NCAR ECMWF, Reading, United Kingdom, 25–35.
40-Year Reanalysis Project. Bull. Amer. Meteor. Soc., Solomon, S., D. Qin, M. Manning, M. Marquis, K. B.
77, 437–471. Averyt, M. M. B. Tignor, H. L. Miller Jr., and Z. Chen,
Kanamitsu, M., W. Ebisuzaki, J. Woollen, S.-K. Yang, Eds., 2007: Climate Change 2007: The Scientific Basis.
J. J. Hnilo, M. Fiorino, and G. L. Potter, 2002: NCEP– Cambridge University Press, 996 pp.
DEO AMIP-II Reanalysis (R-2). Bull. Amer. Meteor. Taylor, K. E., D. Williamson, and F. Zwiers, 2000: The
Soc., 83, 1631–1643. sea surface temperature and sea-ice concentration
Mathon, V., H. Laurent, and T. Lebel, 2002: Mesoscale boundary conditions for AMIP II simulations.
convective system rainfall in the Sahel. J. Appl. Program for Climate Model Diagnosis and Inter-
Meteor., 41, 1081–1092. comparison Rep. 60, 28 pp.
Mechoso, C. R., J.-Y. Yu, and A. Arakawa, 2000: A Thorncroft, C. D., and Coauthors, 2003: The JET2000
coupled GCM pilgrimage: From climate catas- project: Aircraft observations of the African easterly
trophe to ENSO simulations. General Circulation jet and African easterly waves. Bull. Amer. Meteor.
Model Development: Past, Present, and Future, D. A. Soc., 84, 337–351.
Randall, Ed., International Geophysics Series, Vol. Tiedtke, M., 1989: A comprehensive mass flux scheme
70, Academic Press, 539–575. for cumulus parameterization in large-scale models.
Parker, D. J., and Coauthors, 2008: The AMMA radio- Mon. Wea. Rev., 117, 1179–1800.
sonde program and its implications for the future Uppala, S. M., and Coauthors, 2005: The ERA-40
of atmospheric monitoring over Africa. Bull. Amer. Re-Analysis. Quart. J. Roy. Meteor. Soc., 131,
Meteor. Soc., 89, 1015–1027. 2961–3012.
Peyrillé, P., J.-P. Lafore, and J.-L. Redelsperger, 2007: An Xie, P., and P. A. Arkin, 1997: Global precipitation: A
idealized two-dimensional framework to study the 17-year monthly analysis based on gauge observa-
West African monsoon. Part I: Validation and key tions, satellite estimates, and numerical model out-
controlling factors. J. Atmos. Sci., 64, 2765–2782. puts. Bull. Amer. Meteor. Soc., 78, 2539–2558.
Redelsperger, J.-L., C. D. Thorncroft, A. Diedhiou, Zheng, X. and E. A. B. Eltahir, 1998: The role of vegeta-
T. Lebel, D. J. Parker, and J. Polcher, 2006: African tion in the dynamics of West African monsoons. J.
Monsoon Multidisciplinary Analysis: An interna- Climate, 11, 2078–2096.
tional research project and field campaign. Bull.
Amer. Meteor. Soc., 87, 1739–1746.
104 | january 2010You can also read