Genomic prediction for growth using a low density SNP panel in dromedary camels - Nature
←
→
Page content transcription
If your browser does not render page correctly, please read the page content below
www.nature.com/scientificreports
OPEN Genomic prediction for growth
using a low‑density SNP panel
in dromedary camels
Morteza Bitaraf Sani1*, Javad Zare Harofte1, Mohammad Hossein Banabazi2,
Saeid Esmaeilkhanian3, Ali Shafei Naderi1, Nader Salim4, Abbas Teimoori4, Ahmad Bitaraf1,
Mohammad Zadehrahmani5, Pamela Anna Burger6, Vincenzo Landi7, Mohammad Silawi8,
Afsaneh Taghipour Sheshdeh8 & Mohammad Ali Faghihi8,9
For thousands of years, camels have produced meat, milk, and fiber in harsh desert conditions. For
a sustainable development to provide protein resources from desert areas, it is necessary to pay
attention to genetic improvement in camel breeding. By using genotyping-by-sequencing (GBS)
method we produced over 14,500 genome wide markers to conduct a genome- wide association
study (GWAS) for investigating the birth weight, daily gain, and body weight of 96 dromedaries in
the Iranian central desert. A total of 99 SNPs were associated with birth weight, daily gain, and body
weight (p-value < 0.002). Genomic breeding values (GEBVs) were estimated with the BGLR package
using (i) all 14,522 SNPs and (ii) the 99 SNPs by GWAS. Twenty-eight SNPs were associated with
birth weight, daily gain, and body weight (p-value < 0.001). Annotation of the genomic region (s)
within ± 100 kb of the associated SNPs facilitated prediction of 36 candidate genes. The accuracy of
GEBVs was more than 0.65 based on all 14,522 SNPs, but the regression coefficients for birth weight,
daily gain, and body weight were 0.39, 0.20, and 0.23, respectively. Because of low sample size, the
GEBVs were predicted using the associated SNPs from GWAS. The accuracy of GEBVs based on the 99
associated SNPs was 0.62, 0.82, and 0.57 for birth weight, daily gain, and body weight. This report is
the first GWAS using GBS on dromedary camels and identifies markers associated with growth traits
that could help to plan breeding program to genetic improvement. Further researches using larger
sample size and collaboration of the camel farmers and more profound understanding will permit
verification of the associated SNPs identified in this project. The preliminary results of study show that
genomic selection could be the appropriate way to genetic improvement of body weight in dromedary
camels, which is challenging due to a long generation interval, seasonal reproduction, and lack of
records and pedigrees.
For thousands of years’ camels have produced meat, milk, and fiber in harsh desert conditions. There are 35
million camels globally (FAO, 2019), 95% of which are d romedaries1. The innate characteristics of adaptability
and sustainability of the productions can be in antagonism as already proven for example in the bovine species2.
Thus, the development of a modern genetic improvement program for the productivity of the dromedary should
be accompanied by a profound understanding of its genome and the mechanisms of inheritance of the char-
acters of interest3. The ability to blend together the adaptability to hot climates and its innate rusticity with an
efficient production capacity would make this animal an excellent alternative in marginal environments3. In
local population, the lack of phenotypic records and pedigrees, small herd size and missing connectedness, and
1
Animal Science Research Department, Yazd Agricultural and Natural Resources Research and Education Center,
Agricultural Research, Education & Extension Organization (AREEO), 8915813155 Yazd, Iran. 2Department of
Biotechnology, Animal Science Research Institute of IRAN (ASRI), Agricultural Research, Education & Extension
Organization (AREEO), 3146618361 Karaj, Iran. 3Department of Biotechnology, Animal Science Research Institute
of IRAN (ASRI), Agricultural Research, Education and Extension Organization (AREEO), 3146618361 Karaj,
Iran. 4Organization of Agriculture - Jahad -Yazd, Ministry of Agriculture-Jahad, 8916713449 Yazd, Iran. 5Yazd
Dar Al-Elm Higher Education Institute, Yazd, Iran. 6Research Institute of Wildlife Ecology, Vetmeduni Vienna,
1160 Vienna, Austria. 7Departement of Veterinary Medicine, Università Di Bari “Aldo Moro”, Bari, Italy. 8Persian
BayanGene Research and Training Center, 7134767617 Shiraz, Iran. 9Center for Therapeutic Innovation and
Department of Psychiatry and Behavioral Sciences, University of Miami, Miami, FL 33136, USA. *email:
m.bitaraf@areeo.ac.ir
Scientific Reports | (2021) 11:7675 | https://doi.org/10.1038/s41598-021-87296-7 1
Vol.:(0123456789)
www.nature.com/scientificreports/
genetic evaluations are the main limitations4. Genomic approaches can be beneficial to reduce the impact of
these problematic5.
Next-generation sequencing platforms have prepared suitable approaches for genome wide association studies
and genomic selection at the whole-genome level6. By using genotyping-by-sequencing (GBS) method can be
produced many genome wide markers, which is a that supports GWAS7,8. GBS has been widely used in plant and
animal breeding for genome-wide association analysis, genomic diversity studies, and genomic s election9. The
availability of reference genome assemblies coupled with GBS enables us to explore in greater detail of dromedary
populations and to identify genetic associations with different phenotypic t raits10. Genome-wide association
studies (GWAS) are used to screen the whole genome for target genes that correlate with phenotypic traits, using
SNPs and an important method for identifying candidate genes for important economic traits in livestock11.
GWAS have a greater capability than QTL mapping to detect causal SNPs in a smaller genetic range12. In recent
years, many genes and molecular markers, regulate important traits, were identified using GWAS in livestock
animals like pigs, cattle, sheep, and c hickens13,14. Despite its unique potential and increased contribution to food
security, comparatively less attention has been paid to camels compared to other livestock s pecies3.
Body growth is an economical important trait in dromedaries. The birth and weaning weight, gain per day,
and body weights at different ages are used to reflect the growth and development. Growth in weight is a herit-
able trait and an important index of s election17. Although meat production and its functionality are strategic
topics in camel breeding, which is reflected by the increasing interest of stakeholders and consumers in camel
products, few studies have been produced in this field.
In Iran, there are about 140,000 dromedary camels (FAO, 2019) that are divided into four basic types: meat
type, milk type, dual purpose and riding c amels18. Camels in the central desert of Iran usually belong to the
meat type with a large and heavy muscular head, short neck, large hump, wide posterior parts and firm b ody19.
The camels are kept by the villagers located around the desert. The camels are gathered usually in spring. While
the young camels are sold the remaining herds are returned to the desert. During the summer, the camels need
more water, so they return to the villages every day. The size of herds may vary from 4–5 up to 100–150 animals.
The present study has been designed to gain first knowledge on body weight traits at different age in the Ira-
nian dromedary population, and to understand their underlying genomic characteristics. We collected a large
number of phenotypic measurements in 96 dromedaries in the Central Desert of Iran as well as genotypes by
GBS approach. We applied GWAS to identify candidate genes for growth related traits and estimated GEBVs for
selected SNPs. This study is a first step towards systematic genomic breeding and selection in dromedaries for
the benefit of local communities depending on camels as resource for income and food.
Materials and methods
Ethics statement. All of the animal procedures were performed in strict accordance with the guidelines
and regulations proposed by the Animal Science Research Institute of Iran. All the animal experiments were
approved by ethics committee of the Animal Science Research Institute of Iran under the number ASRI-34–64-
1357–005-970,180. Blood samples were collected during qualified veterinary treatment within the framework of
governmental programs aimed at the animal identification, monitoring of health, and parentage confirmation of
the dromedary populations included in our study. No other kind of tissue was used in this study.
Animals and sample collection. Yazd province with the area of 129,285 km2 (49,917 sq mi) is situated
at an oasis where the Dasht-e Kavir desert and the Dasht-e Lut desert meet and located in 31° 53′ 41.28″ N, 54°
21′ 25.2″ E (31.8948, 54.357). Data on 51 herds of dromedaries were collected in 2018. The herd size mean was
89.90, range from 11 to 400 heads among 4279 camels, 16% were younger than one year, and named Hashi, while
12% were older than ten years. The proportion of females (Arvaneh), males (Lok), male calves (Hashi), and
female calves (Hashi) were 76%, 9%, 6%, and 9%, respectively. Among pregnant camels, 49% were older than ten
years. The ratio of pregnant camels to all female camels was 46%. A total of 964 calving was registered between
January to May 2018, distributed over 22% in January, 28% in February, 27% in March, 15% in April, and 8%
in May. Generation intervals in females and males were estimated at 7.84 and 5.91 years, respectively. Among
256 male calves, we recorded 96 samples from 5 regions including: Bafgh (n = 41) Bahabad (n = 8), Khatam
(n = 17), Mehriz (n = 8), and Ardakan (n = 22). Characteristics of the sampled herds and the rangeland plants are
presented in Table 1.
Phenotypic measurements. Data were recorded at the morning before grazing on the pasture. Camels
were kept in closed area at night, which is called Garch. The animal identification was inferred via three-digit
ear tags. Due to large distance in remote regions and transport difficulties, we constructed a portable weighting
scale, consisting of 13 pieces of iron, a digital scale for 2000 kg, and one chain crane (Fig. 1). The meta data col-
lected for any calf included: ID number, characteristics of owner, geographical region, recording date, birth date,
parental names, and body weight. We recording intervals were approximately three months, with the first record
starting in the calving season, the second during the summer, and the third at weaning season at the beginning
of autumn. We collected 252 body weight records from 96 calves in different times during 2018. The 18 calves
belong to National Research and Development Station on Dromedary Camel (Bafgh), measured in 8 -times, the
others were recorded 2 or 3-times including: Bafgh (n = 164), Bahabad (n = 8), Khatam (n = 26), Mehriz (n = 9),
Ardakan (45).
For adjusting the body weight trait, the growth trend was estimated using linear regression model (Eq. 1).
Analysis of covariance (ANCOVA) of body weight was did among five sampling regions using SPSS v.22
software20. The mean of differences was compared using LSD test. Daily weight gain was calculated by two or
three-times records.
Scientific Reports | (2021) 11:7675 | https://doi.org/10.1038/s41598-021-87296-7 2
Vol:.(1234567890)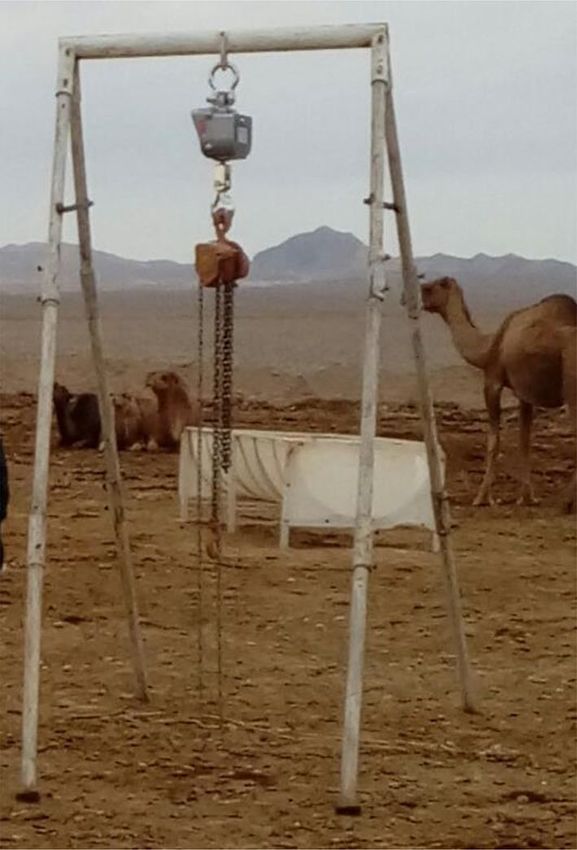
www.nature.com/scientificreports/
Region Herd size Sampling site n samples The rangeland plants
Seidlitzia Rosmarinus, Artemisia spp, Salsola yazdiana, Tamarix tetragyna, Alhagi camelorum, Calligonum como-
Bahabad 400 31°52′29.6"N 56°01′14.7"E 8
sum, Zygophyllum spp
Seidlitzia rosmarinus-Haloxylon ammodendron, Artemisia sieberi-Seidlitzia Rosmarinus, Tamarix tetragyna,
Khatam 112 30°28′42.4"N 54°12′36.7"E 17
Alhagi camelorum, Salsola yazdiana-Calligonum polygonoides, Zygophyllum atriplicoides
Ardakan 450 32°31′40.8"N 55°14′32.9"E 22 Salsola yazdiana, Haloxylon ammodendron, Artemisia sieberi , Zygophyllum spp
Mehriz 320 31°35′14.4"N 54°25′44.4"E 8 Haloxylon ammodendron-Zygophyllum atriplicoides, Artemisia sieberi-Salsola arbuscula,
Bafgh*
Herd1 117 31°37′05.0"N 55°24′26.9"E 23 Zygophyllum spp, Seidlitzia Rosmarinus, Artemisia sieberi, Zygophyllum spp, Salsola yazdiana
Herd2 100 18
Table 1. Characteristics of sampling herds and the rangeland plants. *Two herds in Bafgh were recorded (1:
local herd and 2: National Research and Development Station on Dromedary Camel herd).
Figure 1. The portable weighting scale (Company: Fuzhou Kejie Intelligent Technology Co.,Ltd. model:
OCS-XZ-2, 2000 Weigh Capacity (Kg), Accuracy Class III, + /- 1 division (least count).This were made from 13
pieces of iron, hanging digital scale 2000 kg, and one chain crane.
−
yij = µ + τi + β xij − x + ǫij (1)
yij : body weight; µ : Effect of mean; τi : sampling regions includes: (Bafgh, Bahabad, Khatam, Ardakan, and
−
Mehriz); β : The regression coefficient; xij : Age of recording; x : average of recording Ages.
DNA extraction, SNP discovery and genotyping. Blood samples were collected from the jugular vein
in EDTA tubes during routine veterinary treatment on the pasture. The genomic DNA was extracted using the
modified salting-out method21 and, after elution, was quantified using spectrophotometry and checked for qual-
ity on a 1% agarose gel. Finally, DNA samples were adjusted to a concentration of 50 ng/µl for subsequent steps.
The samples were genotyped-by-sequencing using two restriction enzymes combination, EcoR1 and HinF1
(New England Biolabs, Ipswich, MA, USA), and paired-end (150 bp) sequencing (10 X) on the Illumina HiSeq
2000 platform by Persian Bayangene Research and Training Center (Shiraz, Iran).
The sequence reads were mapped to the dromedary reference genome assembly on chromosome level
(GCA_000803125.3[1];) by using the BWA-MEM algorithm of Burrows–Wheeler Aligner (BWA)22;. PCR
duplicates were detected by utilizing Picard tools and disregarded in downstream analyses both by GATK23 and
SAMtools24. SNPs were called across the GBS data using GATK.
Scientific Reports | (2021) 11:7675 | https://doi.org/10.1038/s41598-021-87296-7 3
Vol.:(0123456789)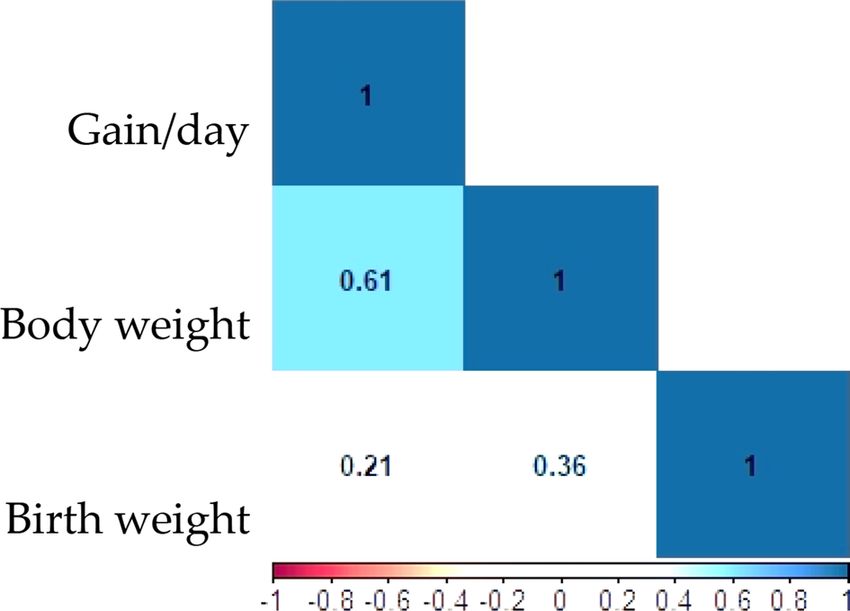
www.nature.com/scientificreports/
Population structure andd genetic diversity. A quality control (QC) steps, and genome-wide diversity
(observed and expected heterozygosity), as well as admixture analyses were performed using TASSEL V5.023.
Variants with a minor allele frequency (MAF) below 0.05 and call rate below 0.95 were removed. Of the 41,897
SNPs, 256 markers were monomorphic, and 27,375 markers were deleted because of MAF < 0.05. The final data
set consisted of 14,522 SNPs and 96 individuals. To investigate population structure, we used vcfR p ackage25 in
R for data manipulation and quality control as for producing input file objects for the other analysis, after that
using ape and poppr package26 we carried out K-means clustering and discriminant analysis of principal compo-
nents (DAPC), while all graphics were produced by means of RColorBrewer27.
Linkage disequilibrium analysis (LD) and SNP‑based haplotype blocks estimating. TASSEL
5.028 was used to calculate the linkage disequilibrium (LD) (r2) for all pairwise loci. Haplotype blocks (HAP)
were constructed in Haploview29.
Genome‑wide association studies and candidate genes prediction. The association between the
SNPs and the traits were tested using mixed linear models with PCA and kinship matrix in TASSEL software28.
The regions of this study and age at weighting date were used as a fixed and covariate effect, respectively.
The statistical analysis model, the MLM-PCA + K analysis, was expressed as:
y = αX + βP + UZ + e
where y was phenotype value; α was the vector of SNP effects; β was vector of population structure effects based
on PCA; u was vector of kinship background effects; e was vector of residual effects; X, P, Z were incidence matrix
relating the individuals to fixed marker effects α, fixed principal component (PC) effects β, random group effects
u, respectively. The suggestive significant Bonferroni P-value thresholds were set (−log p value > 3.9) using the
GEC software t ool30. The associated SNPs (−Log p value > 3) was traced in NCBI and the candidate genes were
detected by blasting to the dromedary camel’s genome (GCA_000803125.3). We considered genes associated
with the respective SNPs, if they were located either within the exon/ intron of a gene or within a flanking region
of 100 kb up- and downstream.
Bayesian genomic prediction. The estimation of Genomic Breeding values (GEBVs) was performed with
the BGLR package including BRR, Bayes A, B, and C approach (nIter = 100 k, Burn In = 5 k)31. two sets of SNPs
were used to predict GEBV: (1) all 14,522 SNPs and (2) the 99 associated SNPs (-Log p value ≥ 2.5 from GWAS).
The prediction accuracy was estimated using the average Pearson’s correlation (r) and regression (b) coefficient
between the GEBVs and observed v alues32–34. The replicated training—testing approach (10 replications) was
used for evaluation of the models. We also used 3:1 size ratio of training set and validation set randomly selected
from the 96 camels, which is a three-folds cross-validation, and repeated 100 times for evaluation of models by
the 99 associated SNPs35,36.
Result
Phenotypic statistics of body weight traits. The distribution of 252 body weight records is visualized
in Fig. 2. The growth trend of data suggested linear relationship between age and body weight (Radj2 = 0.63).
Analysis of covariance for body weight records showed significant (p < 0.05) differences among camels from five
sampled regions (Table 2). The body weight of camels in Ardakan was higher than the others (except Mehriz,
because camels in addition to grazing on the pasture were fed by hand. The camels of Bafgh and Bahabad didn’t
have significant differences. It is necessary to adjust the sampling region effect in GWAS and genomic selection.
The adjusted birth weight, daily weight gains and body weight of the 96 camels from five regions of the Iranian
central desert are shown in Table 2. The descriptive statistics including the mean, standard error (SE), coefficient
of variation (CV) are presented in Table 3. The Pearson correction between daily gain with body weight (r = 0.63)
was more than birth weight (r = 0.21). Also, the birth and body weight were correlated (r = 0.36) (Fig. 3).
Summary of genotyping data
A total of 14,522 SNPs resulted after filtering and were used for final analysis. The largest number of SNPs was
identified on chromosome 9 (n = 1829) followed by chromosome 19 (n = 1655), and the smallest number of SNPs
was found on chromosomes 22 (n = 20) and chromosomes 23 (n = 16) (Fig. 4). The average MAF of all SNPs was
0.19, after QC (MAF > 0.05) (Fig. 5). Average observed heterozygosity was 0.25 ± 0.03.
Genome wide association study. The MLM-PCA + K statistical model considering the covariates com-
posed of population structure and kinship matrix was used for GWAS to prevent false positivity. In GWAS, the
p value should be less than Bonferroni correction by using α/Me, where α = 0.05 and Me = effective number of
SNPs. After applying a Bonferroni correction (1.2 × 10⁻⁴), no SNPs correlated with the growth traits (Fig. 6).
However, this was expected given the limited number of samples used in our study (n = 96). A number of 28
SNPs were found to be associated with birth weight, daily gain, and body weight of dromedaries (p value < 0.001)
(Table 4). For birth weight, 12 correlated SNPs (p value < 0.001) were detected on the chromosomes 7, 8, 9,
11, 19, and 34 were annotated to 9 genes (Table 4). For daily gain, 7 correlated SNPs (p value < 0.001) on the
chromosomes 10, 16, 12, 19, and 14, were annotated to 11 genes (Table 4). For body weight, 9 correlated SNPs
(p value < 0.001) on the chromosomes 11, 8, 19, X, 14, and 18 were annotated to 16 genes (Table 4). The most
significant associated SNP with birth weight, daily gain, body weight, was located on chromosome 8, 10, and
11, respectively (-log p value = 3.81, 3.41, and 3.76, respectively). Out of the 36 genes potentially associated with
Scientific Reports | (2021) 11:7675 | https://doi.org/10.1038/s41598-021-87296-7 4
Vol:.(1234567890)www.nature.com/scientificreports/
Figure 2. Box plot of 255 body weight records (left plot) and growth trend (right plot) of 96 dromedary camels
in five regions of the central desert of Iran.
Region Mean* SE Confidence interval (95%) N records Radj2
Bafgh 82.90 1.68 79.58–86.22 156
Bahabad 82.57 8.12 66.55–98.58 7
Khatam 94.07 4.12 85.94–102.20 26 0.77
Ardakan 125.17 3.30 118.65–131.69 40
Mehriz 115.96 7.42 101.33–130.59 8
Table 2. ANCOVA of body weight (kg) among five regions of the central desert of Iran. *Age of recording
included as covariate and body weight are evaluated at the Age = 155.98 days-old.
Trait Mean SE CV
Birth Weight (Kg) 28.95 0.93 31%
Daily gain (gr) 511.38 12.25 23.6%
Body Weight (kg) (age as covariate): From the birth date to 272 days age 90.08 44 48%
Table 3. The descriptive statistics of body weight traits of dromedary camels.
peak SNPs [the genes listed in Table 4], two genes harboured the SNPs in their exon/ intron regions. Another
11 genes were detected in flanking regions of less than 30 kb up- and downstream of the respective SNP. Four
genes were identified in 30–50 kb regions and 12 genes lay 50–100 kb up- and downstream of the potentially
associated SNP.
A total of 99 SNPs were associated with the three traits (birth weight, daily gain, and body weight) at p
value < 0.002 (Table 5). Twelve haplotype blocks and 80 tag SNPs were predicted among the 99 associated SNPs
with LD (D́ > 0.8) (Fig. 7). Majority haplotype blocks contained two SNPs and only two blocks contain 4, and 6
markers. The haplotype-traits association analysis showed the haplotype 2, 3, 4, 5, 9, and 12 associated with birth
weight (Table 6), while four haplotypes of them associated with daily weight gain. The haplotype 8 containing
six SNPs didn’t associate with body weight, while The haplotype 4 was the most important haplotype associated
with body weight (Table 6).
Genomic Selection Based on BGLR. Based on BRR model in BGLR, the GEBVs of each trait (birth
weight, daily gain, and body weight) was estimated using all 14,522 SNPs. The GEBVs also were predicted using
the 99 associated SNPs based on BRR, Bayes A, B, and C models. The averaged correlation (r) and regression (b)
coefficient between the observed and the GEBVs predicted from two SNPs sets: (1) all 14,522 SNPs and (2) the
Scientific Reports | (2021) 11:7675 | https://doi.org/10.1038/s41598-021-87296-7 5
Vol.:(0123456789)www.nature.com/scientificreports/
Figure 3. Correlation coefficients among birth weight, daily gain, and body weight in dromedary camels.
Figure 4. Number of SNPs/Chromosome.
99 associated SNPs using BGLR package (BRR model). The accuracy of GEBVs were more than 0.65 base on all
14,522 SNPs, but the regression coefficients for birth weight, daily gain, and body weight were 0.39, 0.20, and
0.23, respectively (Table 7). the GEBVs was less biased based on the 99 associated SNPs. The accuracy of using
the 99 associated SNPs also evaluated by cross- validation (3 folds and 100 replications) (Table 8). The accuracy
of the BRR model was more than Bayes A, B, and C (r > 0.65) based on the 99 associated SNPs. the accuracy of
GEBVs of body weight was less than birth weight and daily gain based on the 99 associated SNPs (Fig. 8).
Discussion
In this project, we performed a GWAS for growth traits in dromedary camels using the genotypes of 96 calves of
the central desert of Iran. this is the first GWAS for birth weight, daily gain, and body weight of camels using GBS.
The final goal of genetic mapping is to identify associated markers with p henotype37,38. A number of 14,522 SNPs,
generated using GBS, prepared the GWAS in dromedary camels. We identified 36 candidate genes associated
Scientific Reports | (2021) 11:7675 | https://doi.org/10.1038/s41598-021-87296-7 6
Vol:.(1234567890)www.nature.com/scientificreports/
Figure 5. The Minor Allele Frequency distribution of 14,522 SNPs.
with camel’s growth using Annotation of the genomic region (s) within ± 100 kb of the associated 28 SNPs. The
candidate genes for birth weight of camels are ACTR3B, RPL32, XRCC2, SERAC1, TBX15, RNF114, IFNL1,
SPATA2, SNAI1. For daily gain trait, EFCAB5, NSRP1, Slc6a4, ITGA7, OR6C2, RIPOR3, PTPN1, PARD6B, BCAS4,
MOCS3, TRAPPC9 as candidate genes were identified. EMX2, FAM184A, MCM9, ASF1, CSE1L, ARFGEF2, TSR2,
WNK3, LPAR4, RTL3, PEG10, PBDC1, TRAPPC13, UNKNOWN, DEXI, TSPYL4, CIITA were for camel body
weight. The QTL regions and the genes: ADAMTSL3, CAPN2, CAPN2, FABP6, ZEB2 were detected using GWAS
in Colombian Brahman cattle that influencing growth and weight traits39. Lu et al.11 (2020) reported SLCO2A1,
LY6K, RALYL, AADACL3, C17H4orf45, BICC1, SHROOM2 as candidate genes for birth weight in Chinese Fine-
Wool Sheep11. The candidate genes for Dry Matter Intake, Average Daily Gain, and Metabolic Body Weight based
on the imputed 7.8 M WGS in chattels were reported: SNORA70, B3GALT1, DDR2, GPR37, SYT1, LYZL1, RGS2,
F13A1, SNORA31, LCORL, DPH6, PARD3, MOS, CRB1, CUL1, CCND2, ARRDC3, PLAG1, STC2, CARD11,
TMEM72, SCGB1A1, ERICH6, ARRDC3, GALNT14, PLAG1, ERGIC1, AP3S2, A1CF40. An, B. et al. (2020)41
identified the candidate genes for growth traits in Simmental beef cattle, including SOX2, SNRPD1, RASGEF1B,
EFNA5, PTBP1, SNX9, SV2C, PKDCC, SYNDIG1, AKR1E2, PRIM2, SLC37A1, LAP3, PCDH7, MANEA, LHCGR,
P2RY1, MPZL1, LINGO2, CMIP, and WSCD1. LOC101903200, PARP4, GPA33, NADK, PREX2, FRMD4B were
identified as candidate gene for carcass weight in commercial Hanwoo c attle42.
Performance of genomic selection was determined by the prediction accuracy43–45. Until now, Genomic
prediction has been conducted in many animal species. The accuracy of GEBVs for economic traits in beef cat-
tle was predicted range 0.38 to 0.4046,47. Also, ranged from 0.18 to 0.33 for growth traits in New Zealand sheep
breeds48 It was reported range from 0.40 to 0.50 for important traits in p ig49.
The statistical model, marker density, LD, and sample size influenced on selection accuracy 43. The accuracy of
GEBVs for growth traits was reported 0.391 (GBLUP) and 0.379 (Bayes Lasso) in Y ak50. Because of low samples
size in this research, it was suggested to predict unbiased GEBVs using the associated SNPs from GWAS. The
accuracy of GEBVs of birth weight, daily gain, and body weight based on the 99 associated SNPs was 0.62, 0.82,
and 0.57, respectively. Using the most significant associated SNPs, the reduced SNP panels were developed for
many traits51. It was resulted by the Bayes models, that some fraction of the SNPs has zero effect on the t rait51.
The beef industry has been focused on collections of informative SNPs for subsets of traits that have the most
economic effect and market o pportunity51. The 600 SNPs (20 markers / chromosome) in Bovine relatively had
the same predictive ability rather than 50 K S NP52, and 90% of 50 k SNPs had zero e ffect52. Garrick et al. 2011
reported that using only 384 SNPs by low costing can be achieved predictive ability for interest traits, so that
the accuracies were range from 0.30 to 0.60 for growth, meat quality, and carcass w eight53. The accuracies were
predicted 0.28, 0.29, 0.39, and 0.43 using 50, 100, 150 or 200 SNPs for marbling in A ngus52. the haplotype-traits
association analysis may also provide additional power54.
Phenotyping especially pedigree data is now the principal limitation in camel breeding. Genomic predic-
tions do not reliant on pedigree data55, therefore it can be suggested in camel breeding because of changing into
intensive farming. Establishing of training populations across countries provides an opportunity to increase
training data size and genomic data in dromedaries.
Scientific Reports | (2021) 11:7675 | https://doi.org/10.1038/s41598-021-87296-7 7
Vol.:(0123456789)www.nature.com/scientificreports/
Figure 6. Manhattan plots and q-q plots of birth weight, daily gain, and body weight traits for Dromedary
Camels. (A) birth weight; (B) daily gain; (C) body weight. The dotted horizontal line represents the set
significant threshold (–log10 p value = 3). Red dots in the q–q plots represent the -log p-value of the entire study
and the grey line represents the expected values under the null hypothesis of no association.
Conclusion
Body weight is a critical economic trait for camels and it is necessary to plan the breeding program. Detection of
the genomic regions associated with growth is important for MAS (marker assisted selection) or GS (genomic
selection). This is the first genome-wide association study using GBS on dromedary camels, and identifies
markers associated with growth traits. This could help to plan breeding programs for genetic improvement
in dromedary camels. Further studies using a larger sample size and collaboration of stakeholders will allow
confirmation of the associated SNPs and candidate genes identified in this project. Because of long generation
interval, no artificial insemination, and seasonal reproduction, genomic selection based on the 99 SNPs associ-
ated with growth trait could be a first step into the direction of genetic improvement for body weight in Iranian
dromedaries.
Scientific Reports | (2021) 11:7675 | https://doi.org/10.1038/s41598-021-87296-7 8
Vol:.(1234567890)www.nature.com/scientificreports/
Trait Chromosome pos MAF −log10 (p-Value) Candidate gene
7 82,483,685 0.09 3.29
ACTR3B, RPL32, XRCC2
7 82,483,675 0.08 3.10
8 72,594,633 0.11 3.81
8 72,594,548 0.09 3.77
8 72,594,549 0.09 3.77 SERAC1
8 72,594,593 0.13 3.51
Birth weight
8 72,594,639 0.08 3.12
9 22,550,930 0.15 3.47 TBX15
11 81,210,420 0.06 3.07 mRNA-hypothetical protein and KAB1271495.1
19 10,237,661 0.05 3.21
RNF114, IFNL1, SPATA2, SNAI1
19 10,237,641 0.05 3.18
34 6,774,561 0.06 3.54 UNKHOWN
10 13,892,353 0.06 3.41 UNKHOWN
16 34,483,240 0.39 3.38 EFCAB5, NSRP1, Slc6a4
12 5711 0.02 3.34 ITGA7, OR6C2
Gain/day 19 9,631,630 0.17 3.32 RIPOR3, PTPN1, PARD6B, BCAS4, MOCS3
14 31,371,259 0.11 3.29
14 30,865,065 0.23 3.23 TRAPPC9
14 30,854,110 0.37 3.07
11 72,356,401 0.30 3.76 EMX2, mRNA-hypothetical protein and KAB1271709.1
8 43,104,525 0.30 3.42 FAM184A, MCM9, ASF1
19 10,894,226 0.34 3.38 CSE1L, ARFGEF2
X 78,141,509 0.43 3.30 TSR2, WNK3
Body weight X 78,141,514 0.43 3.30 TSR2, WNK3
X 60,452,363 0.08 3.16 LPAR4, RTL3, PEG10
X 62,116,802 0.06 3.12 PBDC1, TRAPPC13
4 40,844,257 0.16 3.13 UNKNOWN
18 29,958,631 0.06 3.08 DEXI, TSPYL4, CIITA
Table 4. Genome-wide association studies (GWAS)-identified significant single-nucleotide polymorphisms
(SNPs) (− log p value > 3), associated traits, and candidate genes.
Scientific Reports | (2021) 11:7675 | https://doi.org/10.1038/s41598-021-87296-7 9
Vol.:(0123456789)www.nature.com/scientificreports/
SNP ID(Chr_pos) SNP ID(Chr_pos) SNP ID(Chr_pos) SNP ID(Chr_pos)
S1_63040824 S10_13608620 S14_31079196 S19_10894231
S1_63040834 S10_13608628 S14_31241609 S19_11030167
S1_63048213 S10_13608631 S14_31241643 S19_11148798
S1_63445934 S10_13608637 S14_31244620 S19_9631630
S2_14965 S10_13608647 S14_31359918 S21_31508895
S2_99932513 S10_13608655 S14_31371222 S25_262766
S4_40844257 S10_13892353 S14_31371235 S25_262898
S6_14654249 S11_70990227 S14_31371236 S25_263079
S6_24997291 S11_71992855 S14_31371259 S25_263086
S7_75108807 S11_72060113 S16_34358452 S29_10601495
S7_82468596 S11_72060113 S16_34483240 S31_16977384
S7_82483675 S11_72350029 S17_75949 S31_16998649
S7_82483685 S11_72356390 S18_29830420 S33_4467956
S8_43104525 S11_72356400 S18_29958631 S34_6774561
S8_59919313 S11_72356401 S18_29963432 S34_6774561
S8_72594548 S11_72356436 S18_29963702 S35_6600815
S8_72594549 S11_74288613 S18_29985605 S35_9257022
S8_72594593 S11_74292760 S18_30061144 S35_9290500
S8_72594633 S11_81210420 S18_30075711 SX_113249264
S8_72594639 S12_5711 S18_30105059 SX_60452363
S9_15226704 S13_50711877 S19_10237641 SX_62116802
S9_22550930 S14_30854110 S19_10237661 SX_6887230
S9_22738164 S14_30865065 S19_10328831 SX_78141509
S9_53275637 S14_30865085 S19_10433012 SX_78141514
S9_53275650 S14_30865111 S19_10894226
Table 5. List of SNP markers associated with camel growth at −Log p value ≥ 2.5.
Figure 7. the Haplotype Blocks of the 99 associated SNPs with birth weight, daily gain, and body weight.
Scientific Reports | (2021) 11:7675 | https://doi.org/10.1038/s41598-021-87296-7 10
Vol:.(1234567890)www.nature.com/scientificreports/
Trait Haplotype NSNP* NSIG ISIG EMP1 SNPS
Haplotype1 2 0 0 1 NaN**
Haplotype2 2 2 1 1.00E-04 S8_72594549
Haplotype3 2 2 1 0.0121 S9_53275650
Haplotype4 6 4 1 0.0413 S10_13608620
Haplotype5 2 2 1 0.0243 S11_72356401
Haplotype6 2 0 0 1 NaN
Birth Weight
Haplotype7 2 0 0 1 NaN
Haplotype8 4 0 0 1 NaN
Haplotype9 2 2 1 4.00E-04 S19_10237661
Haplotype10 2 0 0 1 NaN
Haplotype11 2 0 0 1 NaN
Haplotype12 2 2 1 0.009299 SX_78141514
Haplotype1 2 0 0 1 NaN
Haplotype2 2 0 0 1 NaN
Haplotype3 2 0 0 1 NaN
Haplotype4 6 0 0 1 NaN
Haplotype5 2 0 0 1 NaN
Haplotype6 2 2 1 2.00E-04 S14_30865085
Gain/day
Haplotype7 2 1 1 0.0391 S14_31241643
Haplotype8 4 1 1 0.05859 S14_31371259
Haplotype9 2 0 0 1 NaN
Haplotype10 2 0 0 1 NaN
Haplotype11 2 0 0 1 NaN
Haplotype12 2 2 1 0.0011 SX_78141514
Haplotype1 2 0 0 1 NaN
Haplotype2 2 2 1 1.00E-04 S8_72594549
Haplotype3 2 2 1 0.0128 S9_53275637
Haplotype4 6 0 0 1 NaN
Haplotype5 2 2 1 0.007299 S11_72356401
Haplotype6 2 2 1 0.006499 S14_30865111
Body weight
Haplotype7 2 2 1 0.0203 S14_31241643
Haplotype8 4 4 1 0.0395 S14_31371259
Haplotype9 2 2 1 0.0034 S19_10237661
Haplotype10 2 0 0 1 NaN
Haplotype11 2 2 1 0.005999 S25_263086
Haplotype12 2 2 1 0.038 SX_78141514
Table 6. the haplotype-traits association analysis. * NSNP: Number of SNPs in Haplotype, NSIG: Total
number of SNPs below p-value threshold (p < 0.05)), ISIG: Number of significant SNPs also passing
LD-criterion (R-squared > 0.50), EMP1: Empirical set-based p-value, SNPS: List of SNPs in the Haplotype. **
Not a Number.
All 14,522 SNPs 99 Associated SNPs
Trait r b r b
Birth weight 0.96 ± 0.0004 0.39 ± 0.011 0.85 ± 0.0003 0.55 ± 0.0007
Daily gain 0.66 ± 0.002 0.20 ± 0.009 0.56 ± 0.0008 0.28 ± 0.0005
Body weight 0.86 ± 0.0009 0.23 ± 0.009 0.64 ± 0.0009 0.19 ± 0.0004
Table 7. The averaged correlation (r) and regression coefficient (b) between the observed values and the
GEBVs predicted from two SNPs sets: (1) all 14,522 SNPs and (2) the 99 associated SNPs using BGLR package
(BRR model).
Scientific Reports | (2021) 11:7675 | https://doi.org/10.1038/s41598-021-87296-7 11
Vol.:(0123456789)www.nature.com/scientificreports/
Model r SD RMSE R2
BRR 0.62 0.109 7.78 0.37
Bayes A 0.61 0.103 7.876637 0.35
Birth weight
Bayes B 0.62 0.101 7.826124 0.36
Bayes C 0.62 0.109 7.826 0.36
BRR 0.82 0.069 69.064 0.67
Bayes A 0.70 0.061 87.20 0.47
Daily gain
Bayes B 0.69 0.067 88.12 0.46
Bayes C 0.70 0.068 87.036 0.47
BRR 0.57 0.094 37.66672 0.29
Bayes A 0.48 0.096 40.3208 0.20
Body weight
Bayes B 0.48 0.099 40.31 0.20
Bayes C 0.48 0.100 40.41 0.20
Table 8. The GEBVs accuracy predicted from the 99 SNPs using BGLR package.
Figure 8. The accuracy of predicted GEBVs from the 99 SNPs using BGLR package.
Received: 15 November 2020; Accepted: 26 March 2021
References
1. Hashim, W. M. et al. Dromedary camels in Sudan, types and sub types, distribution and movement. Int. J. Pharm. Res. Anal. 5,
8–12 (2015).
2. Bernabucci, U., Ronchi, B., Lacetera, N. & Nardone, A. Markers of Oxidative Status in Plasma and Erythrocytes of Transition Dairy
Cows During Hot Season. J. Dairy Sci. 85, 2173–2179 (2002).
3. Abri, M. A. A. & Faye, B. Genetic improvement in dromedary camels: challenges and opportunities. Front. Genet. 10, 167–171
(2019).
4. Bitaraf Sani, M. et al. Genome-Wide Diversity, Population Structure and Demographic History of Dromedaries in the Central
Desert of Iran. Genes 11, 599. https://doi.org/10.3390/genes11060599 (2020).
Scientific Reports | (2021) 11:7675 | https://doi.org/10.1038/s41598-021-87296-7 12
Vol:.(1234567890)www.nature.com/scientificreports/
5. Scienski, K. et al. Genetic variability in a Holstein population using SNP markers and their use for monitoring mating strategies.
Revista Mexicana de Ciencias Pecuarias. 10, 643–663 (2019).
6. Li, Y. & Kim, J. J. Effective Population Size and Signatures of Selection Using Bovine 50K SNP Chips in Korean Native Cattle
(Hanwoo). Evol. Bioinform. 11, 143–153 (2015).
7. Parker, C. C. et al. Genome-wide association study of behavioral, physiological and gene expression traits in outbred CFW mice.
Nat. Genet. 48, 919. https://doi.org/10.1038/ng.3609 (2016).
8. Kang, Y. et al. Genome-wide association of drought-related and biomass traits with HapMap SNPs in Medicago truncatula. Plant
Cell Environ. 38, 1997–2011 (2015).
9. He, J. et al. Genotyping-by-sequencing (GBS) an ultimate marker-assisted selection (MAS) tool to accelerate plant breeding. Front.
Plant Sci. 5, 484 (2014).
10. Bahbahani, H. M. et al. Genome diversity and signatures of selection for production and performance traits in dromedary camels.
Front. Genet. 10, 893 (2019).
11. Lu, Z. et al. Genome-wide association study of body weight traits in chinese fine-wool sheep. Animals 10, 170. https://doi.org/10.
3390/ani10010170 (2020).
12. Hirschhorn, J. N. & Daly, M. J. Genome-wide association studies for common diseases and complex traits. Nat. Rev. Genet. 6,
95–108 (2005).
13. Li, B. et al. High-density genome-wide association study for residual feed intake in Holstein dairy cattle. J. Dairy Sci. 102, 11067–
11080 (2019).
14. Liu, Z. et al. Genome-wide association analysis of egg production performance in chickens across the whole laying period. BMC
Genet. 20, 67. https://doi.org/10.1186/s12863-019-0771-7 (2019).
15. Ghasemi, M., Zamani, P., Vatankhah, M. & Abdoli, R. Genome-wide association study of birth weight in sheep. Animals 13,
1797–1803 (2019).
16. Tang, Z. et al. Genome-wide association study reveals candidate genes for growth relevant traits in pigs. Frontiers in Genet. 10,
302. https://doi.org/10.3389/fgene.2019.00302 (2019).
17. Wei, C. H. & Liu, C. S. Encyclopedia of Modern Sheep Production Technology 70–77 (China Agriculture Press, Beijing, 2014).
18. Salehi, M. & Gharahdaghi A. A. Camel Production Potential and Recent Research in Iran. Preprint at: http://agris.fao.org/agris-
search (2013).
19. Khodai, S. A. The report on camel production systems and the socio-economics of camel herders in the Islamic Republic of Iran.
Cardn/Acsad/Camel/P107/2002. Deputy for Livestock Affairs Directorate of Animal Breeding. Iran, 4–10 (2004).
20. IBM Corp. Released 2013. IBM SPSS Statistics for Windows, Version 22.0. Armonk, NY: IBM Corp.
21. Javanrouh, A. et al. Optimization on salting out method for DNA extraction from animal and poultry blood cells. In Proceedings
of the 57th Ann Meet European Assoc Anim Prod, Antalya, Turkey, 17–20 September (2006).
22. Li, H. & Durbin, R. Fast and accurate long-read alignment with Burrows-Wheeler transform. Bioinformatics 26, 589–595 (2010).
23. McKenna, A. et al. The Genome Analysis Toolkit: a MapReduce framework for analyzing next-generation DNA sequencing data.
Genome Res. 20, 1297–1303 (2010).
24. Pembleton, L. W., Cogan, O. I. N. & Forster, J. W. StAMPP: An R package for calculation of genetic differentiation and structure
of mixed-ploidy level populations. Mol. Ecol. Resour. 13, 946–952 (2013).
25. Knaus, B. J. & Grünwald, N. J. vcfr: a package to manipulate and visualize variant call format data in R. Mol. Ecol. Resour. 17, 44–53
(2017).
26. Kamvar, Z. N., Tabima, J. F. & Grünwald, N. J. Poppr: an R package for genetic analysis of populations with clonal, partially clonal,
and/or sexual reproduction. PeerJ 2, e281 (2014).
27. Neuwirth, E. & Brewer, R. C. ColorBrewer palettes. R package version,.1–1.2 https://CRAN.R-project.org/package=RColorBrew
er (2014).
28. Bradbury, P. J. TASSEL: Software for association mapping of complex traits in diverse samples. Bioinformatics 23, 2633–2635 (2007).
29. Barrett, J. C., Fry, B., Maller, J. & Daly, M. J. Haploview: analysis and visualization of LD and haplotype maps. Bioinformatics 21,
263–265 (2004).
30. Li, M., Yeung, J. M., Cherny, S. S. & Sham, P. C. Evaluating the effective numbers of independent tests and significant p-value
thresholds in commercial genotyping arrays and public imputation reference datasets. Hum. Genet. 131, 747–756 (2012).
31. Pérez, P. et al. Genome-wide regression and prediction with the BGLR statistical package. Genetics 198, 483–495 (2014).
32. Zhang, Z. et al. Best linear unbiased prediction of genomic breeding values using a trait-specific marker-derived relationship
matrix. PLoS ONE 5, e12648. https://doi.org/10.1371/journal.pone.0012648 (2010).
33. Resende, M. D. et al. Genomic selection for growth and wood quality in Eucalyptus: capturing the missing heritability and accel-
erating breeding for complex traits in forest trees. New Phytol. 194, 116–128 (2012).
34. Shikha, M. et al. Genomic selection for drought tolerance using genomewide SNPs in maize. Front. Plant Sci. 8, 550. https://doi.
org/10.3389/fpls.2017.00550 (2017).
35. genome association and prediction integrated tool. Lipka, A. E. et al. (2012). GAPIT. Bioinformatics 28, 2397–2399 (2012).
36. Tang, Y. et al. GAPIT version 2: an enhanced integrated tool for genomic association and prediction. Plant Genome. 9, 9. https://
doi.org/10.3835/plantgenome2015.11.0120 (2016).
37. Yano, K., Yamamoto, E. & Aya, K. Genome-wide association study using whole-genome sequencing rapidly identifies new genes
influencing agronomic traits in rice. Nat. Genet. 48, 927–934 (2016).
38. De Tayrac, M. et al. Genome-wide association study identifies TF as a significant modifier gene of iron metabolism in HFE hemo-
chromatosis. J. Hepatol. 62, 664–672 (2015).
39. Martínez, R. et al. Genome-wide association study for birth, weaning and yearling weight in Colombian Brahman cattle. Genet.
Mol. Biol. 40, 453–459 (2017).
40. Wang, Y. et al. Genetic architecture of quantitative traits in beef cattle revealed by genome wide association studies of imputed
whole genome sequence variants: II: carcass merit traits. BMC Genomics 21, 38. https://doi.org/10.1186/s12864-019-6273-1p.36
(2020).
41. An, B. et al. Multiple association analysis of loci and candidate genes that regulate body size at three growth stages in Simmental
beef cattle. BMC Genet. 21, 32. https://doi.org/10.1186/s12863-020-0837-6 (2020).
42. Edea, Z. et al. Genome–wide association study of carcass weight in commercial Hanwoo cattle. Asian Australas. J. Anim. Sci. 31,
327–334 (2018).
43. Jarquin, D., Specht, J. & Lorenz, A. Prospects of genomic prediction in the USDA Soybean Germplasm Collection: Historical data
creates robust models for enhancing selection of accessions. G3: Genes Genomes Genet. 6, 2329–2341 (2016).
44. Zhang, J., Song, Q., Cregan, P. B. & Jiang, G. L. Genome-wide association study, genomic prediction and marker-assisted selection
for seed weight in soybean (Glycinemax). Theor. Appl. Genet. 129, 117–130 (2016).
45. Duhnen, A. et al. Genomic selection for yield and seed protein content in soybean: a study of breeding program data and assess-
ment of prediction accuracy. Crop Sci. 57, 1325–1337 (2017).
46. Piccoli, M. L. et al. Genomic predictions for economically important traits in Brazilian Braford and Hereford beef cattle using true
and imputed genotypes. BMC Genet. 18, 2. https://doi.org/10.1186/s12863-017-0475-9 (2017).
47. Zhu, B. et al. Accuracies of genomic prediction for twenty economically important traits in Chinese Simmental beef cattle. Anim.
Genet. 50, 634–643 (2019).
Scientific Reports | (2021) 11:7675 | https://doi.org/10.1038/s41598-021-87296-7 13
Vol.:(0123456789)www.nature.com/scientificreports/
48. Brito, L. F. et al. Prediction of genomic breeding values for growth, carcass and meat quality traits in a multi-breed sheep popula-
tion using a HD SNP chip. BMC Genet. 18, 7. https://doi.org/10.1186/s12863-017-0476-8 (2017).
49. Ibáñez-Escriche, N., Forni, S., Noguera, J. L. & Varona, L. Genomic information in pig breeding: science meets industry needs.
Livest. Sci. 166, 94–100 (2014).
50. Ge, F. et al. Accuracies of genomic prediction for growth traits at weaning and yearling ages in yak. Animals 10, 1793. https://doi.
org/10.3390/ani10101793 (2020).
51. Habier, D., Fernando, R. L. & Dekkers, J. C. Genomic selection using low-density marker panels. Genetics 182, 343–353 (2009).
52. Garrick, D. J. The nature, scope and impact of genomic prediction in beef cattle in the United States. Genet. Sel. Evol. 43, 17. https://
doi.org/10.1186/1297-9686-43-17 (2011).
53. Garrick, D. J., Taylor, J. F. & Fernando, R. L. Deregressing estimated breeding values and weighting information for genomic
regression analyses. Genet Sel Evol 41, 55. https://doi.org/10.1186/1297-9686-41-55 (2009).
54. Hayes, B. J. et al. Accuracy of marker-assisted selection with single markers and marker haplotypes in cattle. Genet Res (Camb).
89, 215–220 (2007).
55. Georges, M., Charlier, C. & Hayes, B. Harnessing genomic information for livestock improvement. Nat. Rev. Genet. 20, 135–156
(2019).
Acknowledgements
We would like to thank the camel farmers in Yazd province for providing samples. PB acknowledges funding from
the Austrian Science Fund (FWF): P29623-B25. This research was jointly funded by Animal Science Research
Institute of Iran (ASRI), Animal Breeding Center of Iran, and Yazd Agricultural and Natural Resources Research
and Education Center, grant number 34-64-1357-005-970180.
Author contributions
Conceptualization, M.B.S.; J.Z.H.; S.E.; M.H.B.; A.B.; M. Z and N.S.; methodology, M.B.S.; J.Z.H.; M.H.B.; M.A.F.;
M.S.; A.T.S.; A.T.; and A.Sh.N.; software, M.B.S.; and M.A.F.; formal analysis, M.B.S; investigation, M.B.S.; and
J.Z.H.; writing—original draft preparation, M.B.S.; writing—review and editing, S.E; M.H.B.; P.B.; V.L and M.A.F.;
visualization, M.B.S; supervision, M.H.B.; S.E.; M.A.F.; and P.B. All authors reviewed the manuscript.
Competing interests
The authors declare no competing interests.
Additional information
Correspondence and requests for materials should be addressed to M.B.S.
Reprints and permissions information is available at www.nature.com/reprints.
Publisher’s note Springer Nature remains neutral with regard to jurisdictional claims in published maps and
institutional affiliations.
Open Access This article is licensed under a Creative Commons Attribution 4.0 International
License, which permits use, sharing, adaptation, distribution and reproduction in any medium or
format, as long as you give appropriate credit to the original author(s) and the source, provide a link to the
Creative Commons licence, and indicate if changes were made. The images or other third party material in this
article are included in the article’s Creative Commons licence, unless indicated otherwise in a credit line to the
material. If material is not included in the article’s Creative Commons licence and your intended use is not
permitted by statutory regulation or exceeds the permitted use, you will need to obtain permission directly from
the copyright holder. To view a copy of this licence, visit http://creativecommons.org/licenses/by/4.0/.
© The Author(s) 2021
Scientific Reports | (2021) 11:7675 | https://doi.org/10.1038/s41598-021-87296-7 14
Vol:.(1234567890)You can also read