Study of Long-Term Effectiveness of Water Safety Plan Applied to Microfiltered Water Dispensers to Improve Water Quality - MDPI
←
→
Page content transcription
If your browser does not render page correctly, please read the page content below
water
Article
Study of Long-Term Effectiveness of Water Safety Plan Applied
to Microfiltered Water Dispensers to Improve Water Quality
Marta Mazzotta , Silvano Salaris, Maria Rosaria Pascale, Luna Girolamini, Graziella Ciani
and Sandra Cristino *

                                          Department of Biological, Geological, and Environmental Sciences, University of Bologna, Via San Giacomo 12,
                                          40126 Bologna, Italy; marta.mazzotta2@unibo.it (M.M.); silvano.salaris@unibo.it (S.S.);
                                          mariarosaria.pascal2@unibo.it (M.R.P.); luna.girolamini2@unibo.it (L.G.); graziella.ciani@unibo.it (G.C.)
                                          * Correspondence: sandra.cristino@unibo.it; Tel.: +39-051-209-4811

                                          Abstract: The use of Microfiltered Water Dispensers (MWDs) is increasing in offices, companies, or
                                          commercial facilities, as a response to plastic pollution. Despite their widespread use, poor data are
                                          available about the water quality and pathogens developed. Starting from a high contamination
                                          found in MWDs, a Water Safety Plan (WSP) was implemented on 57 MWDs to improve the water
                                          quality. To assess the effectiveness of WSP during the period 2017–2021, the environmental monitoring
                                          of heterotrophic plate counts (HPCs) at 36 ◦ C and 22 ◦ C, Enterococcus spp., Pseudomonas aeruginosa,
                                Escherichia coli, Staphylococcus aureus, and Clostridium perfringens, as prescribed by Italian regulation

                                          for drinking water, was conducted. A high level of HPCs at both temperatures was observed, over
Citation: Mazzotta, M.; Salaris, S.;
                                          the regulation limit; contrarily, the pathogenic bacteria were absent. The contamination found was
Pascale, M.R.; Girolamini, L.; Ciani,
                                          studied with respect to the temperature threshold of 25 ◦ C, suggested by directives. No significant
G.; Cristino, S. Study of Long-Term
                                          differences were found between samples above and below the threshold, while a significant decrease
Effectiveness of Water Safety Plan
Applied to Microfiltered Water
                                          over the years was observed for HPCs at 36 ◦ C (p = 0.0000000001) and 22 ◦ C (p = 0.000006). The
Dispensers to Improve Water Quality.      WSP implementation resulted in a 43.09% decrease for HPCs at 36 ◦ C and a 24.26% decrease for
Water 2021, 13, 2905. https://            HPCs at 22 ◦ C. Moreover, during the SARS-CoV-2 pandemic, the WSP contributed to limit the
doi.org/10.3390/w13202905                 microbial contamination, preserving the MWDs’ functionality and hygienic conditions and the
                                          drinking water quality.
Academic Editors: Layla Ben Ayed,
Eleni Golomazou, Panagiotis Karanis,      Keywords: Water Safety Plan; Microfiltered Water Dispensers; heterotrophic plate counts’ contami-
Patrick Scheid, Ourania Tzoraki,          nation; maintenance and sanitation procedures; drinking water quality; water temperature
Anna Lass and Muhammad
Shahid Iqbal

Received: 30 September 2021
                                          1. Introduction
Accepted: 14 October 2021
Published: 16 October 2021
                                                Drinking water quality has a significant impact on consumers’ health. Although water
                                          treatments have increased the safety of water, the drinking water quality remains suscepti-
Publisher’s Note: MDPI stays neutral
                                          ble to microbial and chemical contaminants during transport, storage, and handling, as
with regard to jurisdictional claims in
                                          well as in dispensing devices such as bottled water dispensers [1]. In recent years, there has
published maps and institutional affil-   been a worldwide increase of water consumption derived from different sources besides
iations.                                  tap or bottled water for drinking use [2]. Considering the large request for water, one of the
                                          alternative sources is drinking microfiltered water from dispensers (or coolers), which has
                                          been mainly introduced in office buildings, companies, or commercial sites [3]. In Italy, in
                                          the last 12 months, during the pandemic period, 82.7% of the Italian population drank tap
Copyright: © 2021 by the authors.
                                          water (treated and untreated), with a growth rate of over 5%, compared to 2020. In 32.6% of
Licensee MDPI, Basel, Switzerland.
                                          Italian families, there is at least one water filtration system, which allows treating tap water
This article is an open access article
                                          and obtaining water with better organoleptic characteristics [4]. In this context, the use of
distributed under the terms and           these new devices that supply drinking water at point of use become more widespread, es-
conditions of the Creative Commons        pecially since they are able to offer more advantages, such us avoiding transport, reservoirs,
Attribution (CC BY) license (https://     or plastic containers, in addition to reducing the impact of plastic pollution.
creativecommons.org/licenses/by/                It is known that the quality of drinking water is an important public health issue, and
4.0/).                                    the Microfiltered Water Dispensers (MWDs) are often adopted as devices able to improve

Water 2021, 13, 2905. https://doi.org/10.3390/w13202905                                                       https://www.mdpi.com/journal/water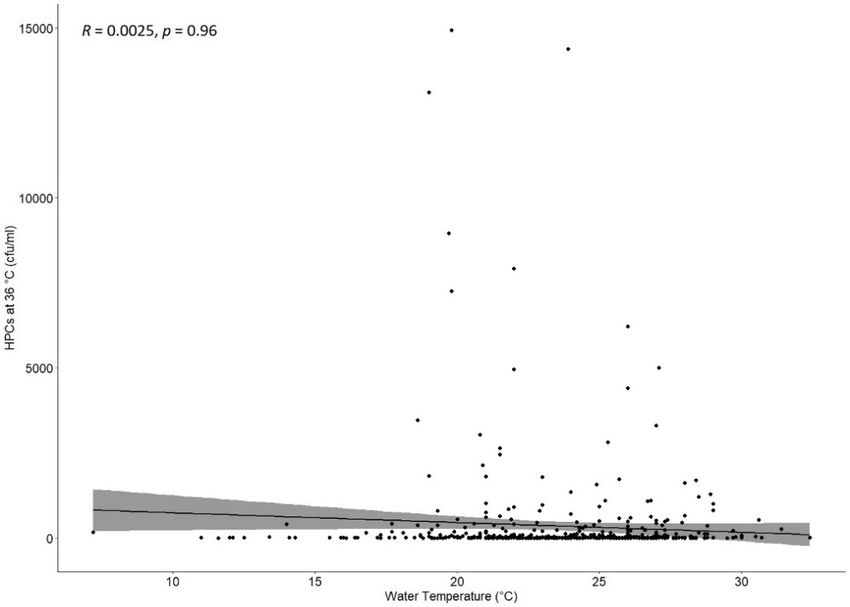
Water 2021, 13, 2905                                                                                           2 of 14

                       water organoleptic characteristics and are easy to use and to maintain [5]. MWDs are
                       devices directly connected to a municipal water supply and they often may include a CO2
                       system for sparkling water or cooling systems for cold water. An activated carbon filtration
                       system incorporated in the device improves the treatment of drinking water; sometimes
                       an Ag+ coating may be present. The activated carbon filter is used for a bacteriostatic
                       effect and to reduce tastes and odors or remove organic and inorganic contaminants [6,7].
                       Furthermore, the use of activated carbon filters could amplify the microbiological contami-
                       nation at point of use, especially in the presence of water stagnation [8,9]. The filtration
                       system is sometimes associated with an UV lamp, installed inside MWDs or immediately
                       before the water is dispensed, at the output nozzle. The UV lamp is able to remove airborne
                       or surface microorganisms [10,11].
                             Considering the MWDs’ pipelines and their location in several sites, other than the
                       improper use by consumers, opportunistic and pathogenic bacteria (Pseudomonas, Legionella,
                       and Mycobacterium species) that grow in water-flowing equipment can form an adherent
                       biofilm, in which the bacteria will survive, becoming more resistant to antimicrobial agents
                       and increasing the water contamination [12–15].
                             For these reasons, an adequate maintenance and disinfection protocol should be
                       implemented on MWDs. Several studies have discussed the use of oxidants’ agents, such
                       as peracetic acid and hydrogen peroxide, to reduce the microbiological contamination
                       and to assure the quality of resulting water [9,16]. The disinfection products need to
                       be certified as food-grade products to preserve the health of consumers; at the same
                       time, it is recommended to avoid the continuous use of aggressive disinfectants, such
                       as chlorine disinfectants, that could damage the devices, often characterized by plastic
                       material causing a decay of the material, which can dissolve into the water flow and reach
                       the consumers. Another aspect regards the continuous disinfection treatment that can
                       lead to a bacterial species’ selection with consequent increase in bacterial resistance and
                       inefficient disinfection procedures [17,18].
                             However, concerns have been raised about the quality of the water dispensed from
                       MWDs due to the non-compliant maintenance procedures that could lead to a potential
                       risk of uncontrolled bacterial contamination and the consequence of waterborne infectious
                       diseases, especially as regards the sensitive and immunocompromised population [5].
                       Multiple studies show that the contamination of MWDs is caused by missed or improper
                       cleaning. Yamaguchi et al. in 2007 reported a major contamination of mineral water
                       dispensers, other than tap water, in terms of yeasts, fungi, and total coliforms present [19].
                       In an another study, from 2014, the heterotrophic bacterial load was shown above the
                       acceptable limits in drinking water, significantly higher in water dispenser samples than tap
                       water samples [20]. Moniruzzaman et al. 2011 carried out a study about the microbiological
                       contamination (heterotrophic bacteria, Escherichia coli, Pseudomonas sp., and Salmonella sp.)
                       in water samples dispensed in road-side restaurants compared to water samples from
                       the bottle before dispensing [21]. In Italy, Liguori et al. 2010 and Sacchetti et al. 2014
                       conducted studies to compare the microbial quality of water dispensers and municipal
                       tap water [2,9]. Research conducted in Ajman (UAE) to investigate the microbial quality
                       of drinking water distributed through water dispenser machines located in schools and
                       universities displayed more than 50% of water samples positive for Pseudomonas aeruginosa
                       (P. aeruginosa).
                             P. aeruginosa is considered an opportunistic pathogen, and its occurrence in drinking
                       water can pose a serious health risk to children and immunocompromised individuals [22].
                             Such findings indicate that the companies and customers should be informed about
                       the proper use and correct maintenance of MWDs, and this helps to keep them free from
                       microbiological contamination [23].
                             In order to avoid or to reduce the risk of acquiring water-related infections, World
                       Health Organization (WHO) Guidelines for Drinking-Water Quality and European Direc-
                       tive and subsequent amendments on the quality of water intended for human consumption
                       have been introduced in some countries [24–28]. In Italy, established criteria exist for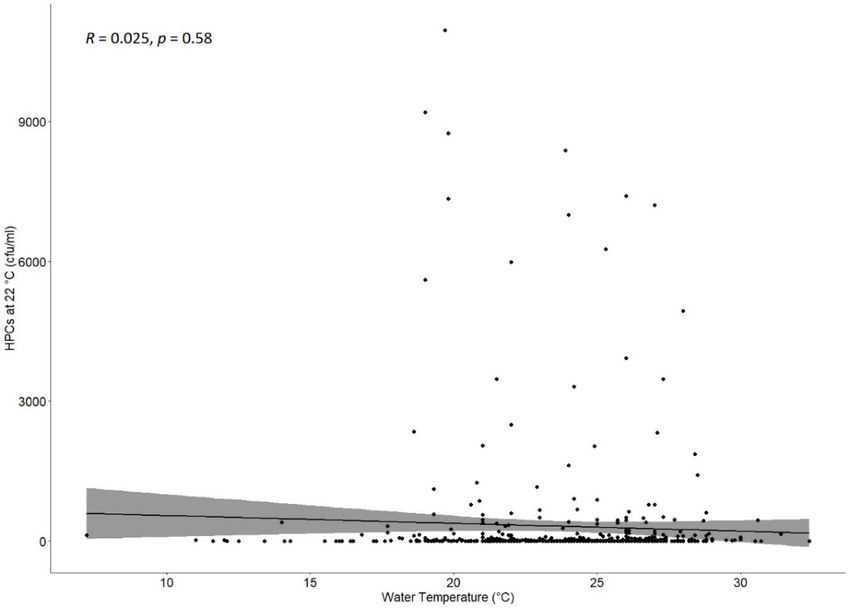
Such findings indicate that the companies and customers should be informed about
the proper use and correct maintenance of MWDs, and this helps to keep them free from
microbiological contamination [23].
In order to avoid or to reduce the risk of acquiring water-related infections, World
Water 2021, 13, 2905 Health Organization (WHO) Guidelines for Drinking-Water Quality and European Di-3 of 14
rective and subsequent amendments on the quality of water intended for human con-
sumption have been introduced in some countries [24–28]. In Italy, established criteria
exist for human consumption of water, including water coming from MWDs [11,29]. Ac-
human consumption of water, including water coming from MWDs [11,29]. According
cording to the European Community Directive Guidelines, the microbiological quality of
to the European Community Directive Guidelines, the microbiological quality of water
water is required to be tested for typical indicator bacteria, such as heterotrophic plate
is required to be tested for typical indicator bacteria, such as heterotrophic plate counts
counts (HPCs) at ◦36 °C and◦ 22 °C, and to be free from any pathogenic bacteria, such as
(HPCs) at 36 C and 22 C, and to be free from any pathogenic bacteria, such as Enterococcus
Enterococcus spp., P. aeruginosa, Escherichia coli (E. coli), Staphylococcus aureus (S. aureus),
spp., P. aeruginosa, Escherichia coli (E. coli), Staphylococcus aureus (S. aureus), and Clostridium
and Clostridium perfringens (C. perfringens), as well as chemical contaminants.
perfringens (C. perfringens), as well as chemical contaminants.
Although the impact of water bacterial contamination on human health is widely
Although the impact of water bacterial contamination on human health is widely
recognized, few studies have been performed on MWDs’ contamination and the role of
recognized, few studies have been performed on MWDs’ contamination and the role of
WSP introduction in their management, as far as monitoring, hygienic quality level, and
WSP introduction in their management, as far as monitoring, hygienic quality level, and
safetysafety
for consumers.
for consumers.
BasedBased
on ouronprevious workwork
our previous [30], where the water
[30], where supplied
the water by MWDs
supplied by MWDs showed a high
showed a high
contamination
contamination by indicator as well as pathogenic bacteria, this research presents there-
by indicator as well as pathogenic bacteria, this research presents the results
sults of
ofaastudy
studyconducted
conductedfor for5 years,
5 years, from
from 2017
2017 to 2021,
to 2021, to monitor
to monitor the water
the water quality
quality supplied
supplied by MWDs,
by MWDs, installed
installed in an Italian
in an Italian metalworking
metalworking industrial
industrial site. Thesite.
aimThe aimstudy
of the of thewas to
studyassess,
was toinassess, in a long-term
a long-term period,
period, the the effectiveness
effectiveness of aWater
of a specific specific Water
Safety Safety
Plan Planbased
(WSP),
(WSP),on based on maintenance
maintenance and sanitization
and sanitization procedures,procedures,
developed todeveloped
improve the to quality
improve andthesafety
quality and safety of drinking water supplied by MWDs. Moreover, the
of drinking water supplied by MWDs. Moreover, the monitoring was continued during monitoring was
continued during the
the lockdown lockdown
period period for
that occurred thatthe
occurred for the global
global SARS-CoV-2 Sars-Cov2
pandemic pandemic
in 2020, to test the
in 2020, to test
efficacy ofthe efficacyimplemented
measures of measures implemented also in an
also in an emergency emergency period.
period.
2. Materials and Methods
2. Materials and Methods
2.1. Microfiltered WaterWater
2.1. Microfiltered Dispensers’
Dispensers’ Characteristics
Characteristics
The MWDs
The MWDs involved
involved in theinstudy
the study are considered
are considered “point
“point of use”,
of use”, meaning
meaning that they
that they
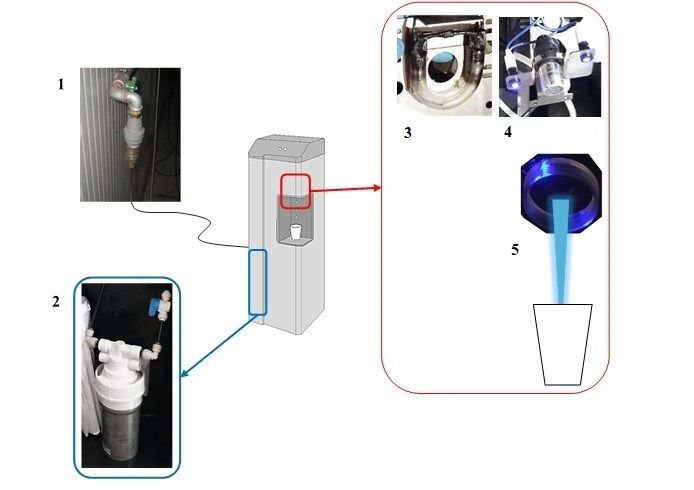
are connected to a main potable water network (Figure
are connected to a main potable water network (Figure 1). 1).
Figure
Figure 1. Schematic
1. Schematic representation
representation of Microfiltered
of Microfiltered WaterWater Dispensers
Dispensers (MWDs)(MWDs)
from from our previous
our previous
studystudy (Girolamini
(Girolamini et al. 2019):
et al. 2019): 1: Input
1: Input from municipal
from municipal water,water, 2: Activated
2: Activated carboncarbon
filter, filter,
3: UV3:Lamp
UV Lamp
at water supply point, 4: UV lamp, without glass, and water supply point (output), 5: Water supply
nozzle (output).
A dedicated pipeline containing a removable filter with a pore size of 1 mm was
used to remove particulate matter that could be delivered from the municipal water. The
main water flowed through an internal activated carbon filter with a pore size of 0.5 µm,
which reduced tastes, odors, and various organic and inorganic substances (e.g., clays,
chlorine, etc.), as well as potentially disinfectant chemicals used in municipal water. The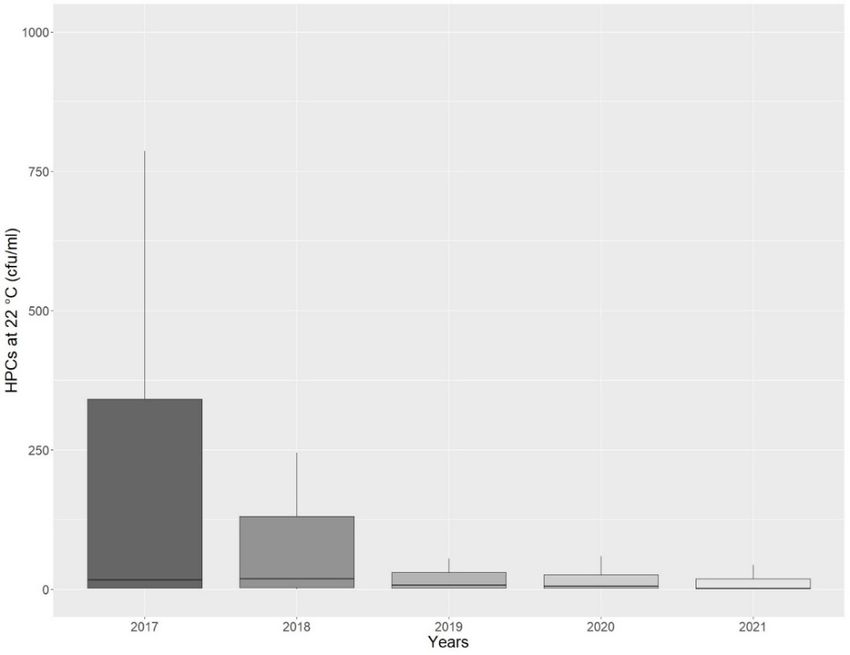
Water 2021, 13, 2905                                                                                            4 of 14

                       MWDs showed an approximate capacity of 20–28 L/h and were provided by a single, low-
                       pressure UV lamp at the output water supply point. The lamp consisted of a small, glass
                       tube encircled with a power of 1.5 W. The MWDs provided water at room temperature,
                       sparkling water (by carbon dioxide gas cylinder), and hot water, via a circular supply point
                       (nozzle). The water was supplied by a single nozzle located at the base of the dispenser,
                       which had a capacity of 30 cL. The technical characteristics of MWDs were provided in the
                       manufacturer’s manuals and conformed to the Italian directives [11].
                            The MWDs involved in this study were installed in several industrial sites (e.g., coffee
                       break areas, offices, recreational points, etc.) and the intended use was especially to provide
                       drinking water in common or private spaces, not catering use, as admitted. Moreover,
                       in Italy, it is mandatory to notify the presence and use of MWDs to the Public Health
                       Authorities [31] only when these devices are in use in hotels, canteens, restaurants, and
                       cafés; therefore, their presence in other facilities often is underestimated, with a lack of
                       authority control.

                       2.2. Maintenance and Sanitation Procedures Developed
                            An established program of routine and extraordinary maintenance procedures of
                       MWDs is considered a key factor to prevent bacterial growth and the colonization of
                       MWDs’ pipelines or the point of use, to guarantee water quality and safety for consumers.
                            The results obtained in our previous study [30], where two different typologies of
                       MWDs (Type A and Type B) were compared to test their performance on drinking water
                       treatment, demonstrated how the MWDs called Type B showed a higher microbial con-
                       tamination for all parameters tested. Considering the number of these devices located
                       in the company (n = 57), a specific WSP was developed according to the Company’s
                       environmental heath safety office.
                            Following the manufacturer’s instructions, the MWDs were subjected to a follow-
                       up study from 2017 to 2021, to evaluate the WSP effectiveness, through water quality
                       supply monitoring.
                            The WSP consisted of various maintenance and sanitation procedures, as well as the
                       water quality assessment.
                            In the following bullet points are reported the activities undertaken:
                       •    Daily external cleaning of MWDs’ surfaces;
                       •    Daily cleaning of the external water supply (point of connection to municipal wa-
                            ter pipelines);
                       •    Monthly checking and cleaning of mechanical filters on the water supply;
                       •    Monthly functional checking and cleaning of the cooling condenser;
                       •    Weekly emptying of the water collection tray and removal of any residues;
                       •    Replacement of the UV lamp, at the supply point, every 6000 h (6–8 months) of working;
                       •    Replacement of the internal activated carbon filter, every 6 months;
                       •    Replacement of the carbon dioxide gas cylinder (non-rechargeable), every 120 L of
                            supplied water;
                       •    Daily cleaning of the water dispensing nozzles;
                       •    Flushing the input and output water supplies, for 5 minutes, after the weekends or
                            the holidays;
                       •    Descaling procedure by recirculation of an acid solution (1–3% v/v for 30 min), certified
                            as food-grade product, in respect to enforced legislations, every 6 months;
                       •    Disinfection procedure on the internal components by recirculation in the MWDs’
                            pipelines of a hydrogen peroxide solution (3% v/v for 30 min), every 6 months, every
                            time the water filter is changed, after a long inoperative period, or/and after non-
                            compliance of microbiological results;
                       •    MWDs’ water sampling performed every 6 months, after non-compliance results, or
                            after disinfection procedures were undertaken.
                           Given that the chemical products used for this procedure contained corrosive acid
                       and alkaline substances, it was important to provide the staff involved with protective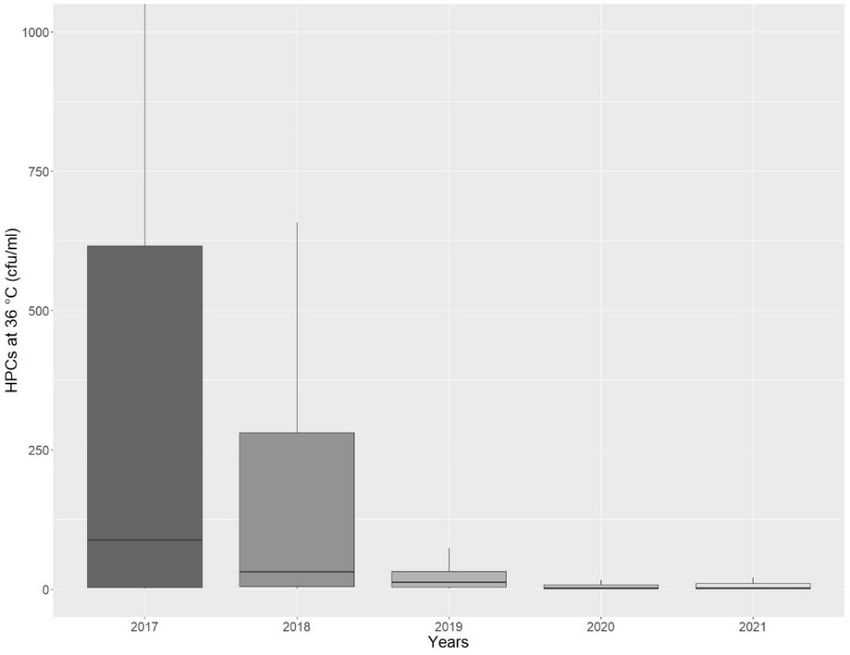
Water 2021, 13, 2905                                                                                             5 of 14

                       equipment (e.g., gloves, visor, etc.) in addition to considering the disinfection concentration,
                       contact time, and the volume of water supplied.
                            A qualified and professional staff were identified and informed regarding the chemical
                       and microbiological risk, in order to safely perform MWDs’ functional and maintenance
                       protocols. Moreover, each of above bullet points were recorded on a maintenance register,
                       validated by the Maintenance office.

                       2.3. Water Samples’ Collection and Microbiological Parameters
                             The study was conducted from 2017 to 2021, as part of a surveillance program based
                       on the previous WSP started in 2017 and still in place in the Italian company. This made
                       it possible to monitor, over time, the microbiological contamination of the MWDs and to
                       correlate it to the temperatures detected during the sampling, in relation to the adopted
                       protocols based on ordinary and extraordinary maintenance procedures.
                             Following the WSP established in the industrial site in 2017, according to the WHO
                       and the Italian regulation of drinking water for human consumption, the MWDs were
                       monitored to analyze the drinking water quality every 6 months [25,28].
                             For each MWD, 500 mL of water at room temperature were collected from the output
                       water supply point. The water sample was collected in the same way the water was de-
                       livered to the consumer, without flushing, and collected in sterile polytetrafluoroethylene
                       (PTFE) bottles, according to EN ISO 19458 [32]. Microbiological analyses included the
                       detection of typical indicator bacteria, HPCs at 36 ◦ C and 22 ◦ C, and pathogenic bac-
                       teria, Enterococcus spp., P. aeruginosa, E. coli, S. aureus, and C. perfringens, in accordance
                       with the Italian regulations for drinking water and reference standard methods for each
                       microbiological parameter [25].
                             The HPCs’ analysis was performed according to UNI EN ISO 6222:2001 [33], using
                       the standard plate method on tryptic glucose yeast agar (Plate Count Agar, PCA; Biolife,
                       Milan, Italy).
                             Analysis of Enterococcus spp. was carried out using the standard membrane filter
                       technique according to ISO 7899-2:2000 [34], using Slanetz Bartley Medium (Enterococcus
                       Agar) (Thermo Fisher Scientific, Diagnostics, Ltd., Basingstoke, UK).
                             P. aeruginosa analysis was carried out according to UNI EN ISO 16266:2008 standard
                       membrane filter technique [35], using Pseudomonas C-N Selective Agar (Cetrimide Agar)
                       (Thermo Fisher Scientific, Diagnostics, Ltd., Basingstoke, UK).
                             The E. coli bacteria were analyzed using the standard membrane filter technique ac-
                       cording to UNI EN ISO 9308-1:2017 [36], using Chromogenic Coliform Agar (ISO) (Thermo
                       Fisher Scientific, Diagnostics, Ltd., Basingstoke, UK).
                             S. aureus contamination was detected using the standard membrane filter technique
                       according to ISO 16140-2:2016 [37], using Brilliance™ Staph 24 Agar (Thermo Fisher
                       Scientific, Diagnostics, Ltd., Basingstoke, UK).
                             Finally, analysis of C. perfringens was conducted according to UNI EN ISO 14189:2016 [38],
                       using m-CP Selective Agar (Thermo Fisher Scientific, Diagnostics, Ltd., Basingstoke, UK).
                             Suspected colonies grown on the different selective media were sub-cultured on
                       Tryptic Soy Agar (TSA) (Biolife, Milan, Italy) and identified using a Crystal Enteric/Non-
                       Fermenter ID kit (Crystal E/NF) or BBL Crystal Gram Positive ID kit (Crystal GP), both
                       produced by Becton Dickinson (Cockeysville, MD, USA), according to the manufacturer’s
                       instructions [39].
                             The reference values for drinking water were the following: for HPCs at 36 ◦ C and
                       22 ◦ C, less than 20 and 100 colony forming units (cfu) per 1 mL of seeded water, respectively.
                       The samples under the regulation limits were considered negative [25]. Enterococcus spp.,
                       P. aeruginosa, E. coli, S. aureus, and C. perfringens should not be detected in 100 mL of
                       filtered water.
                             Samples’ collection and microbiological analyses were conducted by our research
                       group, at Bologna University.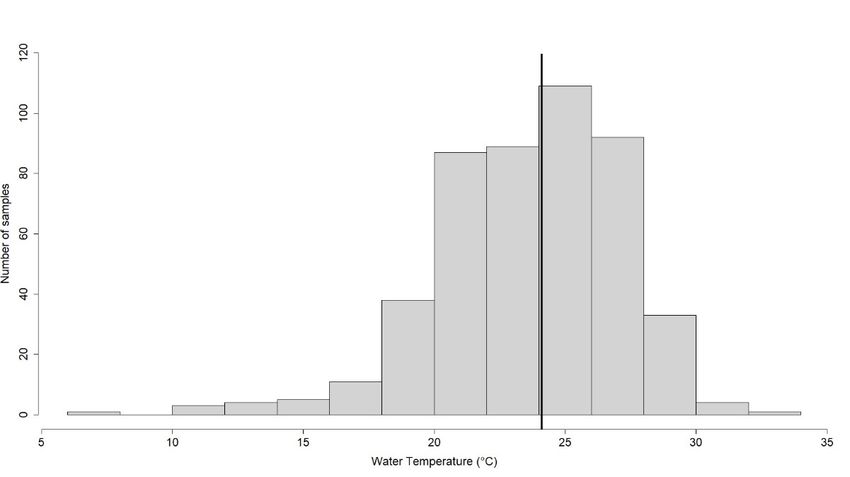
Water 2021, 13, 2905                                                                                                                          6 of 14

                                       2.4. Statistical Analysis
                                            All statistical analyses were performed using R software (version 4.0.5, “Shake and
                                       Throw” R Foundation for Statistical Computing, Vienna, Austria). DataMaid R package was
                                       used to generate a baseline descriptive analysis, including frequency, median, mode, and
                                       interquartile range values on numeric and categorical variables [40]. A Shapiro–Wilk test
                                       evaluated if the data of temperature and HPCs’ variables came from a normally distributed
                                       population. Spearman’s rho rank test was calculated to detect a possible correlation
                                       between temperature and HPCs. Graphical representations of HPCs’ contamination trend
                                       during the years were elaborated with ggplot2 [41].
                                            A Wilcoxon–Mann–Whitney test was used to compare the two groups of HPCs at
                                       36 ◦ C and 22 ◦ C values above and below the 25 ◦ C temperature value established by
                                       the Guidelines for Drinking-Water Quality. The same test was used to compare the het-
                                       erotrophic bacteria contamination detected from the beginning (2017) to the current data
                                       (2021) of the drinking water surveillance program, and to compare contamination levels
                                       pre-COVID (2019) and post-COVD (2021) lockdown periods, included in this study.
                                            Bacteriological data were expressed as mean contamination ± standard deviation (SD)
                                       of positive samples. The p-values (p) < 0.05 were considered statistically significant.

                                       3. Results
                                            Considering the contamination found in the previous study [30], in relation to HPCs
                                       at 36 ◦ C and 22 ◦ C, P. aeruginosa and other pathogenic bacteria, Table 1 displays the status
                                       of MWDs’ contamination at the beginning of the study (2017) and the mean contamination
                                       found during the period of the study.

      Table 1. MWDs’ mean contamination ± standard deviation (cfu/mL ± SD) found at the beginning of the WSP implemented
      in 2017 until today (2021), with respect to mean contamination found in the previous study (Girolamini et al., 2019), from
      2015 to 2017.

                                        MWDs’ Mean Contamination ± Standard Deviation (cfu/mL ± SD)

 Microbiological       Girolamini et al.,                                           Present Study (2017–2021)
  Parameters               2019 [30]
                         (2015–2017)                 2017               2018                   2019                  2020             2021
   HPCs 36      ◦C       1852 ± 0.67           1014.99 ± 2637.63   321.67 ± 802.31         39.05 ± 86.37        124.83 ± 766.07   30.02 ± 77.62
   HPCs 22      ◦C       2437 ± 0.56           686.25 ± 1952.55    453.58 ± 1442.75       69.78 ± 374.89        161.50 ± 776.76   91.75 ± 469.23
   P. aeruginosa          37.4 ± 0.81            9.48 ± 36.86       20.81 ± 59.50          2.18 ± 20.63          5.04 ± 27.58      0.67 ± 5.03
   Enterococcus
       spp.
                          3.3 ± 0.20
      E. coli                                        n.d.                n.d.                  n.d.                  n.d.              n.d.

     S. aureus
  C. perfringens             n.d.

                                             In detail, a total of 477 water samples were collected from 57 MWDs and analyzed
                                       for HPCs at 36 ◦ C and 22 ◦ C and for pathogenic bacteria, Enterococcus spp., P. aeruginosa,
                                       E. coli, S. aureus, and C. perfringens.
                                             The overall results showed that the samples were more contaminated by HPCs at 36 ◦ C
                                       and 22 ◦ C; instead, P. aeruginosa was detected in 44/477 (9.2%) samples. Total and fecal
                                       coliforms, E. coli, S. aureus, and C. perfringens were not detected in any of the investigated
                                       samples. The MWDs’ mean contamination found, shown in Table 1, displayed a continuous
                                       decrease during the years of the study. The HPCs at 36 ◦ C and 22 ◦ C data were studied
                                       to understand the trend of bacteriological contamination. The analysis described below
                                       was not performed for other pathogenic parameters found (e.g., P. aeruginosa), due to the
                                       sample size of data being too small for statistical reporting and for other microbiological
                                       parameters never detected in MWDs during the period.
samples. The MWDs’ mean contamination found, shown in Table 1, displayed a continu-
ous decrease during the years of the study. The HPCs at 36 °C and 22 °C data were studied
to understand the trend of bacteriological contamination. The analysis described below
was not performed for other pathogenic parameters found (e.g., P. aeruginosa), due to the
Water 2021, 13, 2905 sample size of data being too small for statistical reporting and for other microbiological 7 of 14
parameters never detected in MWDs during the period.
The positive samples were analyzed with respect to the reference values prescribed
by the Italian regulations.
The positiveHPCs
Regarding samples were
at 36 °C analyzed
and 22 °C, with
the respect
followingto the reference values
microbiological prescribed
profiles by
were rec-
the Italian regulations.
orded: a total of 187/477 (39.2 %) samples, with a range of contamination of 21–14,940
Regarding HPCs(19.7 ◦ C and 22 ◦ C, the following microbiological profiles were recorded:
at 36 %)
cfu/mL, and 94/477 samples, with a range of contamination of 104–10,960 cfu/mL,
aexceeded
total of 187/477 (39.2%) samples,
the regulation withofa20
limit values range of contamination
cfu/mL and 100 cfu/mL, of 21–14,940 cfu/mL,
respectively, and
for HPCs
94/477 (19.7%)
at 36 °C and 22 °C. samples, with a range of contamination of 104–10,960 cfu/mL, exceeded
the regulation limit valuesfound
The contamination of 20 was
cfu/mL and also
studied 100 cfu/mL,
in relationrespectively, at 36 ◦ C
for HPCsmeasured,
to the temperature
and ◦
22 C. the temperature as one of the factors that could influence the bacterial growth.
considering
The contamination
According foundfor
to the Guidelines was studied also inQuality,
Drinking-Water relationthe
to reference
the temperature measured,
water temperature
considering the temperature as one of the factors that could influence the
was between the range of 12–20 °C, with a limit not to exceed set at 25 °C [25,27,28,42]. bacterial growth. In
According to the Guidelines for Drinking-Water Quality,
particular, in our study, 292/477◦ (61.2 %) samples showed temperaturethe reference water temperature
values ≤25° C and
was between
185/477 (38.8the
%)range of 12–20
samples showed C,values
with a >25°
limit C.
notThe
to exceed
samples at 25 ◦ Ca [25,27,28,42].
setshowed minimum value In
particular, in our study, 292/477 (61.2%) samples showed temperature values ≤25 ◦ C and
measured of 7.2 °C and a maximum of 32.4 °C, with a median value of 24.1 °C.
185/477 (38.8%) samples showed values > 25◦ C. The samples showed a minimum value
Figure 2 shows how most samples were centered around the median value of 24.1
measured of 7.2 ◦ C and a maximum of 32.4 ◦ C, with a median value of 24.1 ◦ C.
°C, a temperature value close to the reference limit threshold of 25 °C [28].
Figure 2 shows how most samples were centered around the median value of 24.1 ◦ C,
a temperature value close to the reference limit threshold of 25 ◦ C [28].
◦ C and 32.4 ◦ C and the median value of
Figure2.2.Temperature-based
Figure Temperature-baseddistribution, with
distribution, respect
with to the
respect interval
to the between
interval 7.2 7.2
between °C and 32.4 °C and the median value
24.1 ◦ C (bold row).
of 24.1 °C (bold row).
The HPCs’ contamination found (for both 36 ◦ C and 22 ◦ C) were separated into two
groups based on the temperature values above and below the 25 ◦ C temperature threshold,
and compared with each other. In both cases there was no significant difference between
the groups with values above and below 25 ◦ C, with a p = 0.56 and p = 0.18 for HPCs at
36 ◦ C and 22 ◦ C, respectively.
Moreover, data were evaluated to find a possible correlation between HPCs at 36 ◦ C
and 22 ◦ C and the temperature of samples measured, as shown in Figure 3a,b. There
was no significant correlation with a p = 0.96 and p = 0.58 for HPCs at 36 ◦ C and 22 ◦ C,
respectively.tween the groups with values above and below 25 °C, with a p = 0.56 and p = 0.18 for HPCs
at 36 °C and 22 °C, respectively.
Moreover, data were evaluated to find a possible correlation between HPCs at 36 °C
and 22 °C and the temperature of samples measured, as shown in Figure 3a,b. There was
Water 2021, 13, 2905 no significant correlation with a p = 0.96 and p = 0.58 for HPCs at 36 °C and 22 °C, respec-
8 of 14
tively.
(a)
(b)
Figure 3. (a) Correlation between heterotrophic plate counts (HPCs) at 36 ◦ C and the temperatures
detected during the drinking water monitoring program. There was no significant correlation
with a p-value = 0.96. (b) Correlation between heterotrophic plate counts (HPCs) at 22 ◦ C and the
temperatures detected during the drinking water monitoring program. There was no significant
correlation with a p-value = 0.58.
Considering the period of analysis, from 2017 to 2021, to assess the compliance
of monitoring and maintenance measures undertaken, we studied the microbiological
contamination trend of HPCs at 36 ◦ C and 22 ◦ C (Figure 4a,b).a p-value = 0.96. (b) Correlation between heterotrophic plate counts (HPCs) at 22 °C and the tem-
peratures detected during the drinking water monitoring program. There was no significant corre-
lation with a p-value = 0.58.
Water 2021, 13, 2905 Considering the period of analysis, from 2017 to 2021, to assess the compliance
9 of 14 of
monitoring and maintenance measures undertaken, we studied the microbiological con-
tamination trend of HPCs at 36 °C and 22 °C (Figure 4a,b).
(a)
(b)
Figure 4.Figure 4. (a) graph
(a) Boxplot Boxplot graph ashowing
showing a decreasing
decreasing trend for heterotrophic
trend for heterotrophic plate countsplate counts
(HPCs) ◦C
at 36(HPCs) at 36
observed°Cduring
observed
the during
period the period offrom
of analysis, analysis,
2017 from 2017Outliers
to 2021. to 2021.are
Outliers are not displayed.
not displayed. (b) Boxplot
(b) Boxplot
graph showing a decreasing trend for heterotrophic plate counts (HPCs) at 22 ◦ C observed during
the period of analysis, from 2017 to 2021. Outliers are not displayed.
Figure 4a,b show how the continuous water quality monitoring and the MWDs’
maintenance, according to International Regulations and Guidelines, led to a decrease
in bacterial contamination. The same contamination trend was observed in terms of
percentage of positive samples that exceeded the regulation limits. We found 68/109
(62.4%) for HPCs at 36 ◦ C and 36/109 (33.0%) for HPCs at 22 ◦ C positive samples that
exceeded the regulation limits in 2017, compared to 11/57 (19.3%) and 5/57 (8.8%) in 2021.Water 2021, 13, 2905 10 of 14
The value of mean contamination ± SD found were 1014.99 ± 2637.63 cfu/mL and
686.25 ± 1952.55 cfu/mL for HPCs at 36 ◦ C and 22 ◦ C, respectively, in 2017, compared to
30.02 ± 77.62 cfu/mL and 91.75 ± 469.23 cfu/mL for HPCs at 36 ◦ C and 22 ◦ C, respectively,
in 2021.
These data are supported by the statistical analysis applied on HPCs at 36 ◦ C and
◦
22 C detected in 2017 compared to 2021, when it was possible to assess a significant
decrease of HPCs at 36 ◦ C (p = 0.0000000001) and 22 ◦ C (p = 0.000006) in 2021 compared
to 2017.
The WSP implementation resulted in a 43.09% decrease for HPCs at 36 ◦ C and 24.26%
decrease for HPCs at 22 ◦ C.
Finally, in order to verify the impact of the lockdown period, due to the global SARS-
CoV-2 pandemic that occurred during 2020, which also affected the industrial company
involved in this study, causing the closure of MWDs’ devices, we focused on the analysis
of the data, both for HPCs at 36 ◦ C and 22 ◦ C, comparing the contamination found in the
pre-COVID (year 2019) and post-COVID (year 2021) periods.
The extended period of inactivity did not affect the MDWs’ contamination, as evi-
denced by a significant decreasing trend of HPCs’ parameters, with a p-value of 0.000005
for 36 ◦ C and 0.001 for 22 ◦ C, respectively. Moreover, a decreasing number of positive
samples over the directive limits was observed: 31/94 (33.0%) for HPCs at 36 ◦ C and 9/94
(9.6%) for HPCs at 22 ◦ C in 2019 compared to 11/57 (19.3%) and 5/57 (8.8%) in 2021.
Regarding the contamination found, it was possible to evaluate again a decrease,
such as 39.05 ± 86.37 cfu/mL and 69.78 ± 347.89 cfu/mL for HPCs at 36 ◦ C and 22 ◦ C,
respectively, in 2019 compared to 30.02 ± 77.62 cfu/mL and 91.75 ± 469.23 cfu/mL for
HPCs at 36 ◦ C and 22 ◦ C, respectively, in 2021.
4. Discussion
The MWDs are increasingly used in the private or public areas, such as restaurants
or companies, and are a serious problem for public health, concerning potential water-
borne pathogens, due to the incorrect use by ordinary consumers and lack or failure of
maintenance procedures.
The most relevant health-based target in relation to drinking water is to provide
a good-quality water with no taste, odor, or microbiological contaminants. In order to
prevent the introduction, growth, and spread of pathogenic bacteria, appropriate cleaning
and sanitation procedures must be implemented, following a WSP, as suggested by the
International regulation for drinking water quality [25,28].
Several studies have already demonstrated how the drinking water quality could
change over time within MWDs [1,20,22,43]. According to these findings, the bacterial
contamination found could be attributed to many factors, such as insufficient and in-
adequate maintenance of the dispenser outlets/nozzles, storage tanks, UV lamps, and
manufacturer’s materials, in addition to the absence of knowledge about the correct clean-
ing procedures and routine functionality checks required to maintain MWDs’ hygiene
and safety.
In this study, the role of indicator and common pathogenic bacteria was considered.
The type of MWDs analyzed showed a poor quality of drinking water at the beginning of
study, with a high risk for consumers. Starting from these contaminations and considering
that the Company acquired these devices to definitively remove the use of plastic water
bottles, a new WSP was introduced, according to Italian directives. Already in 2017 com-
pared to the previous study of Girolamini et al. in 2019, the contamination by Enterococcus
spp., E. coli, S. aureus, and C. perfringens, disappeared, despite few samples positive for P.
aeruginosa. Interesting data were found for HPCs’ bacteria at 36 ◦ C and 22 ◦ C. Although,
as suggested by WHO [28], the HPCs’ bacteria were not a suitable criteria for estimating
the quality of drinking water, they could be considered as a clean water indicator, and in
our study they were used to check the maintenance and disinfection protocol applied over
time. Several studies over time were in line with our results. The Authors clearly showedWater 2021, 13, 2905 11 of 14
the main contamination found in devices used to supply microfiltered water was attributed
to HPCs at 36 ◦ C and 22 ◦ C, followed by P. aeruginosa and fungi [2,42].
Starting from the results obtained, to explain the level of HPCs found, two main factors
were considered: the temperature values detected at MWDs’ output and the performance
of continuous maintenance procedures applied in the industrial company from 2017 until
today (2021).
The temperature is considered a relevant determinant to preserve water quality,
since its changes can influence physical, chemical, and biological processes that occur in
natural and artificial environments. Specifically, temperature can influence the dynamics
of microorganisms promoting biofilm formation, which could be a reservoir of waterborne
pathogens, guaranteeing their survival [43,44]. According to Semerjian et al. 2020 [1],
another risk factor is the MWDs’ location, such as placing them in humid environments or
in facilities or rooms with poor ventilation. This factor could promote the bacteria growth
due to the warming of MWDs, with a consequent increase of water temperatures supplied.
The WHO guidelines recommend that drinking water assumes a temperature value
between 12 to 20 ◦ C, with an alert limit of 25 ◦ C; this limit must not be exceeded [25,27,28].
The results obtained displayed how the MWDs showed a large range of temperature
values (min. 7.2 ◦ C–max. 32.4 ◦ C), with a median of 24.1 ◦ C, strictly close to 25 ◦ C. In
order to evaluate the impact of the temperature found on the HPCs’ contamination, two
groups of data were selected, considering the MWDs with temperature above and below
25 ◦ C. The comparison showed no significance differences between them. Considering
that the majority of the detected temperatures fell near the threshold value, the result did
not surprise.
Furthermore, no statistical correlation between HPCs’ values at 36 ◦ C and 22 ◦ C
contamination and the temperature values was detected (p = 0.74 and p = 0.59, respectively).
The data obtained could be explained with the activities implemented with the WSP
over the years in the Company, aimed to maintain a constant temperature under 25 ◦ C,
avoiding exceeding the limit proposed, according to the Guidelines. This aim was achieved
through a strict control of flushing activities (every day) to avoid the water stagnation, in
addition to the choice of the right MWDs’ location, preferring ventilated areas, far from
the heating systems (e.g., fan coil units), and avoiding direct light exposure to prevent the
device warming. All these factors, as suggested by Semerjian et al. in 2020, contribute to
bacteria and fungi proliferation [1].
The maintenance procedures allowed both keeping the temperature constant near the
value established by law of 25 ◦ C and decreasing HPCs’ contamination values at 36 ◦ C and
22 ◦ C over time, as demonstrated by data comparison of heterotrophic bacteria from 2017
and 2021.
Despite the low pathogenic impact of HPCs on human health, their presence in water
highlights the need to implement maintenance protocols to avoid the biofilm growth. Espe-
cially in MWDs, considering their functional characteristics and the lower volume of water
supply, it is important to realize ordinary maintenance procedures such as cleaning sur-
faces, flushing the water every day at the opening time, and the descaling procedures [2,23].
These ordinary measures, combined with the control of temperature, the maintenance of
manufacturer’s characteristics, and the microbiological parameters’ proliferation, permit a
rapid detection of health-based risks factors, avoiding the deterioration of water quality.
These considerations are also supported by the results reported during the recent
global SARS-CoV-2 pandemic, in 2020. Despite the closure of the company and the closure
of MWDs, the implementation of the maintenance and sanitation procedures, such as
flushing at input and output points three times a week or daily cleaning of external
surfaces, permitted preserving the water quality and avoiding the use of shock treatments
by chemical disinfectants in MDWs’ water circuits. Indeed, the statistical data analysis from
2019 to 2021 underlined a further decrease of microbiological contamination, demonstrating
how the only maintenance procedure without the use of continuous disinfection treatments
was able to limit the risk of water contamination.Water 2021, 13, 2905 12 of 14
The MWDs involved in the study were supplied by the same municipal water, through
a single pipeline, that, inside the Company, was divided into different lines. The different
water qualities could be explained with the contamination of the last part of the pipeline
(the point of connection with the distal outlets) and the different volumes of water supplies,
but also by the consumer habits. In our experience, the MWDs located in the production
area, especially in a metallurgical company, were more subjected to air pollution and use
with dirty hands and poor hygienic conditions, with respect to devices located in the
kitchen, canteens, or close to the offices. Based on our experience, especially during the last
year, to reduce the plastic pollution, there was an increase in the use of water bottles that
were directly filled from MWDs. During the filling, the contact between the water bottle
and MWDs’ nozzles could contribute to the device contamination. Therefore, it was crucial
to propose a training to the consumers on the proper use of MWDs. All the employers
were trained regarding the need to regularly wash, empty, and dry the bottles, and to fill
them avoiding contact with the MWDs’ nozzles, to minimize the cross-contamination risks.
Moreover, according to our WSP, the maintenance procedures based on flushing,
descaling, and disinfection were performed by trained professionals and scheduled on
the same days. This means that in a range of 2 days all devices were submitted to the
same procedure in order to obtain the same sanitation level. All of these aspects were
discussed also during the workers’ training program and strict monitoring procedures
were implemented by the heath safety environment manager designed by the Company.
These considerations need also to be combined with the application of the manu-
facturer’s instructions. The MWDs should be regularly cleaned and the integrity of all
components should be checked. The following aspects must be included in the maintenance
and monitoring program: the cleaning of the outside of the device; the replacement of
electrical components and power leads; checking the water connection; inspections of level
indicators and control devices; cleaning of the water collection tray; cooling the condenser,
water filters, and water dispenser spouts; and UV lamp maintenance and replacement.
All these practices improve the hygienic conditions of MWDs, promoting safe and good
drinking water quality.
5. Conclusions
The outcomes of this work prove the long-term effectiveness of the WSP followed by
the company and the consumers, in addition to the role of a multidisciplinary approach
established to assure the drinking water quality, according to the International and National
directives. In addition, this study suggests a need to implement more rigorous microbio-
logical monitoring to apply to MWDs’ environment, underestimated to date, despite the
large diffusion of these devices in the communities.
Lack of awareness and knowledge on these issues, in addition to missing systematical
control by users as well as by public health authorities, can lead to a high risk to human
health, especially in hospitals and, in general, in all health-care settings, where the use
of MWDs is already widespread and the presence of immunocompromised people could
increase the risk of infections.
Moreover, these findings assume a relevant importance even across new scenarios:
the higher request for plastic reduction, the introduction, starting from January 2021,
of the new European Directive 2184/2020 on the quality of water intended for human
consumption focused to implement a WSP approach in all facilities, and the introduction of
new microbiological parameters in order to assure the water quality, such as, for example,
Legionella spp. [45]. Considering the habitat, the pathogenic role, and the impact on public
health demonstrated for these bacteria, the sanitation and maintenance procedures of
MWDs will play a relevant role to preserve the water quality.
Author Contributions: S.C. and M.M. conceived the study, designed the experiments, and wrote the
paper. S.S. performed the statistical analyses. M.R.P., L.G., and G.C. performed the sample collection
and experiments. All authors have read and agreed to the published version of the manuscript.Water 2021, 13, 2905 13 of 14
Funding: This research received no external funding.
Acknowledgments: The authors would like to thank the Company for the sampling and Water
Safety Plan drafting and Federica Marino for suggestions.
Conflicts of Interest: The authors declare no conflict of interest.
References
1. Semerjian, L.; Ibrahim, M.M.; Alkhateri, B.M. A comparative study of microbial contamination between public institutional and
private residential bottled water dispensers. Environ. Monit. Assess. 2020, 192, 259. [CrossRef]
2. Liguori, G.; Cavallotti, I.; Arnese, A.; Amiranda, C.; Anastasi, D.; Angelillo, I.F. Microbiological quality of drinking water from
dispensers in Italy. BMC Microbiol. 2010, 10, 19. [CrossRef] [PubMed]
3. Baumgartner, A.; Grand, M. Bacteriological quality of drinking water from dispensers (coolers) and possible control measures. J.
Food Prot. 2006, 69, 3043–3046. [CrossRef]
4. Aqua Italia. Acqua del Rubinetto in Pandemia: Ecco i Dati per Aree Geografiche; AQUA ITALIA—Associazione costruttori impianti
e componenti per il trattamento delle acque primarie: Milan, Italy, 2021; Available online: www.aquaitalia.it (accessed on 1
August 2021).
5. Reynolds, K.A.; Mena, K.D.; Gerba, C.P. Risk of waterborne illness via drinking water in the United States. Rev. Environ. Contam.
Toxicol. 2008, 192, 117–158. [CrossRef]
6. Siddiqi, K.S.; Husen, A.; Rao, R.A.K. A review on biosynthesis of silver nanoparticles and their biocidal properties. J. Nanobiotech-
nol. 2018, 16. [CrossRef] [PubMed]
7. Zanacic, E.; McMartin, D.W.; Stavrinides, J. From source to filter: Changes in bacterial community composition during potable
water treatment. Can. J. Microbiol. 2017, 63, 546–558. [CrossRef] [PubMed]
8. Chaidez, C.; Gerba, C.P. Comparison of the microbiologic quality of point-of-use (POU)-treated water and tap water. Int. J.
Environ. Health Res. 2004, 14, 253–260. [CrossRef]
9. Sacchetti, R.; De Luca, G.; Dormi, A.; Guberti, E.; Zanetti, F. Microbial quality of drinking water from microfiltered water
dispensers. Int. J. Hyg. Environ. Health 2014, 217, 255–259. [CrossRef] [PubMed]
10. Tingpej, P.; Tiengtip, R.; Kondo, S. Decontamination efficacy of ultraviolet radiation against biofilms of common nosocomial
bacteria. J. Med. Assoc. Thail. 2015, 98, 582–588.
11. Ministerial Decree n.25 07.02.2012. Technical Provisions Concerning Equipment for the Treatment of Water for Human Consump-
tion. 2012. Available online: https://www.ausl.fe.it/azienda/dipartimenti/sanita-pubblica/servizio-igiene-alimenti/acqua-
potabile-1/decreto-ministeriale-7-febbraio-2012-n-25-dispositivi-di-trattamento-acque/view (accessed on 1 August 2021).
12. Walker, J.T.; Marsh, P.D. Microbial biofilm formation in DUWS and their control using disinfectants. J. Dent. 2007, 35, 721–730.
[CrossRef]
13. Douterelo, I.; Jackson, M.; Solomon, C.; Boxall, J. Microbial analysis of in situ biofilm formation in drinking water distribution
systems: Implications for monitoring and control of drinking water quality. Appl. Microbiol. Biotechnol. 2016, 100, 3301–3311.
[CrossRef]
14. Szymańska, J. Bacterial decontamination of DUWL biofilm using Oxygenal 6. Ann Agric Env. Med 2006, 13, 163–167.
15. Roy, R.; Tiwari, M.; Donelli, G.; Tiwari, V. Strategies for combating bacterial biofilms: A focus on anti-biofilm agents and their
mechanisms of action. Virulence 2018, 9, 522–554. [CrossRef] [PubMed]
16. Zanetti, F.; De Luca, G.; Sacchetti, R. Control of bacterial contamination in microfiltered water dispensers (MWDs) by disinfection.
Int. J. Food Microbiol. 2009, 128, 446–452. [CrossRef]
17. Uruén, C.; Chopo-Escuin, G.; Tommassen, J.; Mainar-Jaime, R.C.; Arenas, J. Biofilms as promoters of bacterial antibiotic resistance
and tolerance. Antibiotics 2021, 10, 3. [CrossRef] [PubMed]
18. Vaz-Moreira, I.; Nunes, O.C.; Manaia, C.M. Ubiquitous and persistent Proteobacteria and other Gram-negative bacteria in
drinking water. Sci. Total Environ. 2017, 586, 1141–1149. [CrossRef]
19. Yamaguchi, M.U.; Rampazzo, R.D.C.P.; Yamada-Ogatta, S.F.; Nakamura, C.V.; Ueda-Nakamura, T.; Dias Filho, B.P. Yeasts and
filamentous fungi in bottled mineral water and tap water from municipal supplies. Brazilian Arch. Biol. Technol. 2007, 50, 1–9.
[CrossRef]
20. Farhadkhani, M.; Nikaeen, M.; Adergani, B.A.; Hatamzadeh, M.; Nabavi, B.F.; Hassanzadeh, A. Assessment of drinking water
quality from bottled water coolers. Iran. J. Public Health 2014, 43, 674–681. [PubMed]
21. Moniruzzaman, M.; Akter, S.; Islam, M.A.; Mia, Z. Microbiological quality of drinking water from dispensers in roadside
restaurants of Bangladesh. Pak. J. Biol. Sci. 2011, 15, 142–145. [CrossRef]
22. Al Moosa, M.E.; Khan, M.A.; Alalami, U.; Hussain, A. Microbiological Quality of Drinking Water from Water Dispenser Machines.
Int. J. Environ. Sci. Dev. 2015, 6, 710–713. [CrossRef]
23. Slavik, I.; Oliveira, K.R.; Cheung, P.B.; Uhl, W. Water quality aspects related to domestic drinking water storage tanks and
consideration in current standards and guidelines throughout the world—A review. J. Water Health 2020, 18, 439–463. [CrossRef]
[PubMed]
24. European Union Council Directive 98/83/EC of 3 November 1998 on the quality of water intended for human consumption. Off.
J. Eur. Communities 1998, 41, 32–54. [CrossRef]Water 2021, 13, 2905 14 of 14
25. Legislative Decree n.31 02.02.2001 Implementation of the Water Quality Directive 98/83/EC Relative to Water Quality Intended
for Human Consumption. pp. 1–21. Available online: https://www.camera.it/parlam/leggi/deleghe/01031dl.htm (accessed on
1 August 2021).
26. European Commission Directive (EU) 2015/1787 of 6 October 2015 amending Annexes II and III to Council Directive 98/83/EC
on the Quality of Water Intended for Human Consumption. Off. J. Eur. Union. 2015. Available online: http://data.europa.eu/eli/
dir/2015/1787/oj (accessed on 1 August 2021).
27. Ministerial Decree 14.06.2017 Implementation of Directive (EU) 2015/1787 Amending Annexes II and III of Directive 98/83/EC
on the Quality of Water Intended for Human Consumption. Amendments to Annexes II and III of Legislative Decree 2 February
2001, n. 31. 2017, pp. 14–19. Available online: http://www.si-t.eu/wordpress/wp-content/uploads/2017/09/6.pdf (accessed on
1 August 2021).
28. Herschy, R.W. World Health Organization Guidelines for Drinking-Water Quality. Encycl. Lakes Reserv. 2011, 876–883. Avail-
able online: http://apps.who.int/iris/bitstream/handle/10665/44584/9789241548151_eng.pdf (accessed on 1 August 2021).
[CrossRef]
29. Guidelines on Water Treatment Devices Guidelines on Water Treatment Devices Spent on Human Consumption under the D.M. 7
February 2012, n. 25. 2013. Available online: https://www.salute.gov.it/imgs/C_17_pubblicazioni_1946_allegato.pdf (accessed
on 1 August 2021).
30. Girolamini, L.; Lizzadro, J.; Mazzotta, M.; Iervolino, M.; Dormi, A.; Cristino, S. Different trends in microbial contamination
between two types of microfiltered water dispensers: From risk analysis to consumer health preservation. Int. J. Environ. Res.
Public Health 2019, 16, 272. [CrossRef]
31. European Parliament Regulation (EC) n. 852/2004 of the European Parliament and of the Council 29.04.2004 on the Hygiene of
Foodstuffs. Off. J. Eur. Communities. 2004. Available online: https://www.certifico.com/chemicals/legislazione-chemicals/264-
legislazione-chemicalsfood/4288-regolamento-ce-n-852-2004 (accessed on 1 August 2021).
32. EN ISO 19458:2006. Water Quality—Sampling for Microbiological Analysis; International Organization for Standardization: Geneva,
Switzerland, 2006; Available online: https://www.iso.org/standard/33845.html (accessed on 1 August 2021).
33. UNI EN ISO 6222:2001. Water Quality—Enumeration of Culturable Micro-Organisms—Colony Count by Inoculation in a Nutrient
Agar Culture Medium; International Organization for Standardization: Geneva, Switzerland, 2001; Available online: http:
//store.uni.com/catalogo/index.php/uni-en-iso-6222-2001.html (accessed on 1 August 2021).
34. ISO 7899-2:2000. Water Quality—Detection and Enumeration of Intestinal Enterococci—Part 2: Membrane Filtration Method; Interna-
tional Organization for Standardization: Geneva, Switzerland, 2000; Available online: https://www.iso.org/standard/14854.html
(accessed on 1 August 2021).
35. UNI EN ISO 16266:2008. Water Quality—Detection and Enumeration of Pseudomonas aeruginosa—Method by Membrane Filtration;
International Organization for Standardization: Geneva, Switzerland, 2008; Available online: http://store.uni.com/catalogo/
index.php/uni-en-iso-16266-2008.html?josso_back_to=http://store.uni.com/josso-security-check.php&josso_cmd=login_
optional&josso_partnerapp_host=store.uni.com (accessed on 1 August 2021).
36. UNI EN ISO 9308-1:2017. Water Quality—Enumeration of Escherichia coli and Coliform Bacteria—Part 1: Membrane Filtration Method for
Waters with Low Bacterial Background Flora; International Organization for Standardization: Geneva, Switzerland, 2017; Available
online: http://store.uni.com/catalogo/index.php/uni-en-iso-9308-1-2017.html (accessed on 1 August 2021).
37. ISO 16140-2:2016. Microbiology of the Food Chain—Method Validation—Part 2: Protocol for the Validation of Alternative (Proprietary)
Methods against a Reference Method; International Organization for Standardization: Geneva, Switzerland, 2016; Available online:
https://www.iso.org/standard/54870.html (accessed on 1 August 2021).
38. UNI EN ISO 14189:2016. Water Quality—Enumeration of Clostridium Perfringens—Method Using Membrane Filtration; International
Organization for Standardization: Geneva, Switzerland, 2016; Available online: http://store.uni.com/catalogo/en-iso-14189-2016
(accessed on 1 August 2021).
39. Wauters, G.; Boel, A.; Voorn, G.P.; Verhaegen, J.; Meunier, F.; Janssens, M.; Verbist, L. Evaluation of a new identification system,
Crystal Enteric/Non-Fermenter, for gram-negative bacilli. J. Clin. Microbiol. 1995, 33, 845–849. [CrossRef]
40. Petersen, A.H.; Ekstrøm, C.T. Datamaid: Your assistant for documenting supervised data quality screening in R. J. Stat. Softw.
2019, 90, 1–38. [CrossRef]
41. Wickham, H. ggplot2: Elegant Graphics for Data Analysis, 2nd ed.; Springer: Cham, Switzerland, 2016; ISBN 978-3-319-24277-4.
[CrossRef]
42. Agudelo-Vera, C.; Avvedimento, S.; Boxall, J.; Creaco, E.; de Kater, H.; Nardo, A.; Djukic, A.; Douterelo, I.; Fish, K.E.; Rey, P.L.G.;
et al. Drinking water temperature around the globe: Understanding, policies, challenges and opportunities. Water 2020, 12, 1049.
[CrossRef]
43. Furuhata, K.; Ishizaki, N.; Fukuyama, M. Bacterial contamination in cold water samples obtained from water dispensers.
Biocontrol. Sci. 2015, 20, 147–151. [CrossRef] [PubMed]
44. Prest, E.I.; Hammes, F.; van Loosdrecht, M.C.M.; Vrouwenvelder, J.S. Biological stability of drinking water: Controlling factors,
methods, and challenges. Front. Microbiol. 2016, 7, 1–24. [CrossRef] [PubMed]
45. European Parliament Directive (EU) 2020/2184 of the European Parliament and of the Council of 16 December 2020 on the
Quality of Water Intended for Human Consumption. Off. J. Eur. Communities. 2020, pp. 1–62. Available online: https:
//eur-lex.europa.eu/eli/dir/2020/2184/oj (accessed on 1 August 2021).You can also read