Polyphenols profile of pomegranate leaves and their role in green synthesis of silver nanoparticles - Nature
←
→
Page content transcription
If your browser does not render page correctly, please read the page content below
www.nature.com/scientificreports
OPEN Polyphenols profile
of pomegranate leaves and their
role in green synthesis of silver
nanoparticles
Noha Swilam* & Khaled A. Nematallah
The current study reports on polyphenols profile of pomegranate leaves (PL) Punica granatum grown
in Egypt and exhibiting their role in development of an eco-friendly method of green synthesis of silver
nanoparticles (AgNPs). PL aqueous alcohol extract was fractionated, the major phenolic compound
was isolated from the polyphenols rich fraction (ethyl acetate fraction) and identified by conventional
and spectroscopic methods of analysis as ellagic acid. Furthermore, the fraction was standardized
and analysed using UPLC-PDA-UV and LC–MS-MS techniques revealing tentative identification of 23
polyphenolic compounds, quantifying ellagic acid as 43.14 ± 0.57 μg/mg of the fraction. AgNPs were
successfully synthesized with the aid of polyphenols rich fraction. This is the first report revealing
the systematic optimization of the green synthesis process using various independent variables.
AgNPs were characterized by adopting UV–Vis spectroscopy, FTIR, XRD, and SEM, which revealed
strong SPR band within average of λ max 425 nm and polygonal shaped nanoparticles of 26.22 nm size,
respectively. The antimicrobial efficacies of AgNPs and polyphenols rich fraction were tested against
Gram-positive bacteria (Bacillus subtilis, Staphylococcus aureus, and Sarcina lutea), Gram-negative
bacteria (Salmonella paratyphi, Escherichia coli, and Pseudomonas aeruginosa) and fungi (Candida
albicans). AgNPs showed a concentration-dependent activity against all the tested microorganisms.
Nanotechnology is a fast-growing area of science with beneficial roles to various fields of health sciences such
as food industry, health care, biomedicals, water treatment, and c osmetics1,2. Nanoparticles (NPs) are one of
the excellent findings of nanotechnology to solve the day to day issues of the current world. One of the most
important metallic NPs is silver nanoparticles (AgNPs); because of their chemical stability, good conductivity,
antibacterial, antiviral, antifungal and cytotoxic a ctivities3–5.
The effective conductivity of AgNPs has expanded their applications in a wide array of products such as
electronic devices, inks, adhesives, pastes and in controlling microbial growth and i nfections6,7, which has also
made them eco-friendly . Additionally, they are being added to skin creams, wound dressings, antiseptic fabrics
and sprays on account of their wide antiseptic p roperties8. Moreover, it was proved that AgNPs in addition to
other materials such as hydroxyapatite or yttrium oxide have the ability to purify water from the heavy metals
and several organic matters9,10. The size of the global market of AgNPs increased markedly, the global market
revenue grows from 1.1 billion USD in 2016 to expected value of 3.0 billion USD by 202111.
Generally, AgNPs are synthesized by different physical and chemical processes that are relatively expensive
and utilize different toxic and hazardous chemicals. One of the approaches to get rid of utilization of such haz-
ardous chemicals is the bio/green synthesis process, in which biological entities like microorganisms or plant
extracts are used in the production of the nanoparticles12.
Plant metabolites are considered as reducing agents that reduce silver ions into silver metal, and a cap-
ping agent that stabilizes the size and shape of the produced n anoparticles13. Although several groups of plant
metabolites such as carbohydrates, proteins, alkaloids and terpenoids were reported in the green synthesis pro-
cess of metallic nanoparticles, polyphenol compounds including flavonoids are the major phytochemicals that
are included in such a process, due to their powerful reducing properties and high stability of the synthesized
nanoparticles14.
Department of Pharmacognosy, Faculty of Pharmacy, The British University in Egypt, El Sherouk City, Suez Desert
Road, P.O. Box 43, Cairo 11837, Egypt. *email: noha.swilam@bue.edu.eg
Scientific Reports | (2020) 10:14851 | https://doi.org/10.1038/s41598-020-71847-5 1
Vol.:(0123456789)
www.nature.com/scientificreports/
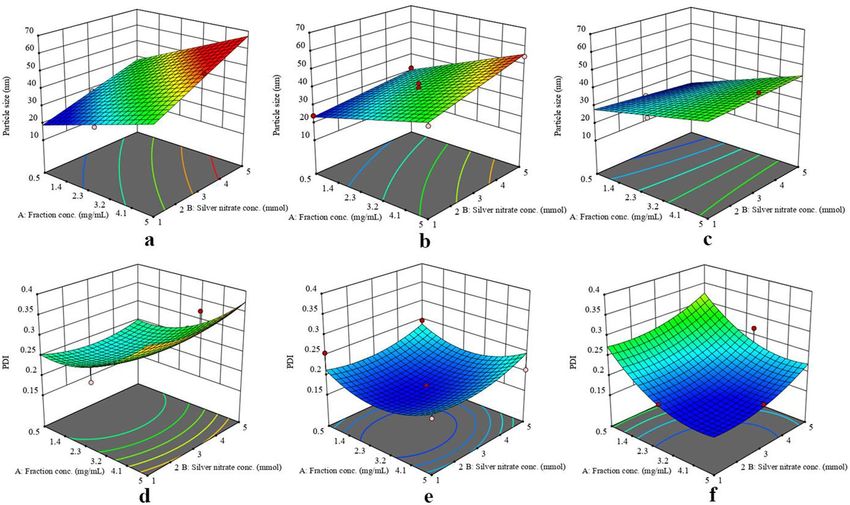
Figure 1. Standardization of the ethyl acetate fraction, (a) UPLC Chromatogram of the ethyl acetate fraction,
(b) UV spectrum of the peak at Rt = 19.4 min, (c) UPLC Chromatogram of the isolated ellagic acid at different
concentrations, (d) Calibration curve of the isolated ellagic acid.
Punica granatum (Pomegranate) is a plant whose fruits are largely consumed all over the world. It is well
known for its richness in polyphenols15. Apart from the fruits, other plant parts such as peels, leaves, flowers
are included in different food preparations like beverage tea, jams, jellies, sauces and salad dressings16. Different
plant parts like seeds, peels and leaves were reported before in the green synthesis of A gNPs17–20. The present
study aimed at profiling the polyphenols of pomegranate leaves (PL) grown in Egypt and proving their role in the
green synthesis process of AgNPs. This incorporates extraction, fractionation, standardization, and polyphenols
profiling of PL extract adopting UPLC-PDA-UV and LC–MS–MS methods. Besides, isolation and structural
elucidation of the main polyphenol component. Moreover, facile green synthesis of AgNPs with the aid of pome-
granate polyphenols, characterization, and investigation of its antimicrobial activity.
Results
Extraction and standardization of the extract. One of the main goals of this study is to prepare a
standardized polyphenols rich fraction from the aqueous alcohol extract of pomegranate leaves (PL). The spec-
trophotometric assay of the total polyphenols and flavonoids contents showed that ethyl acetate fraction was
the richest fraction in polyphenols and flavonoids with 586.25 mg gallic acid equivalent (GAE)/g fraction and
194.67 mg rutin equivalent (RE)/g fraction, followed by the crude extract with 396.75 mg GAE/g extract and
125.60 mg RE/g extract, while the least amount was found in n-butanol fraction with 353.00 mg GAE/g fraction
and 91.30 mg RE/g fraction.
The ethyl acetate fraction was subjected to automated flash chromatography to isolate its major phenolic
compound, that was isolated as buff colored powder (342 mg) with 1H-NMR (DMSO-d6, 400 MHz, δ = ppm),
7.47 (2H, s, H-5 and H-5′), and 13C-NMR (DMSO-d6, 100 MHz, δ = ppm), 112.80 (C1), 136.84 (C2), 140.17 (C3),
148.60 (C4), 110.65 (C5), 108.03 (C6), and 159.64 (C7). The UV–Visible spectrum of that compound exhibited
λmax at 253.7 nm and 367.5 nm. The received spectral data were consistent with those reported for ellagic acid21.
The ethyl acetate faction was standardized by UPLC technique, the total ion current chromatogram of the
fraction was recorded at 370 nm (Fig. 1a), that showed a major peak (44.54%) at Rt = 19.4 min, with UV spectrum,
that exhibited λmax at 253.5 nm and 367.3 nm (Fig. 1b) that was identified as ellagic acid by co-chromatography
with the previously isolated compound. A calibration curve of the isolated ellagic acid was established on the
same UPLC device with the same conditions and parameters (Fig. 1c). The curve equation was found to be
Scientific Reports | (2020) 10:14851 | https://doi.org/10.1038/s41598-020-71847-5 2
Vol:.(1234567890)
www.nature.com/scientificreports/
Peak Rt (min) Identified compounds UV–Vis (λmax) [M−H]− (m/z) Fragment ions (m/z) Percentage (%) Refs
15,52,53
1 3.4 Galloyl-HHDP-hexoside 333, 260 633.2 301, 249 0.54
Galloyl-HHDP-DHHDP- 15,53
2 4.2 365, 274 951.2 933, 301 0.27
hexoside (Granatin B)
15,52–54
3 4.8 Gallic acid 274 169.2 125 1.25
15
4 4.82 Castalagin derivative 275 965.2 301 0.89
13,47,48
5 5.3 Bis-HHDP-hexoside 320, 256 783 765, 481, 301 0.21
13
6 5.6 Digalloyl-HHDP-hexoside 375, 268 801.1 649, 301 0.12
49
7 5.9 Cyanidin pentoside 515, 278 417.1 287 0.12
13,47,48
8 6.6 HHDP-hexoside 267 481.2 301, 275, 229 0.16
13,47,48
9 6.9 Ellagic acid 367, 275 301 229, 185 2.89
49
10 7.3 Procyanidin dimer 377, 285 577.2 441, 289 0.35
13,47
11 7.67 Galloyl hexoside 375, 265 331.1 271, 269, 125 0.28
Dimethyl ellagic acid glucu- 48
12 9.7 365, 270 505.1 329, 314 0.08
ronide
13,47
13 10.5 Ellagic acid deoxyhexoside 366 447.3 301 0.19
13
14 15.3 Ellagic acid dihexoside 319, 286 625 425, 301 0.08
13,47
15 25.7 Ellagic acid hexoside 361, 252 463.2 301, 271 0.32
47
16 26.2 Feruloyl coniferin 225 517.1 337, 271 0.62
13,47
17 27.3 Galloyl-HHDP-gluconate 375, 265 649.2 497, 301 1.83
49
18 39.2 Coumaroyl hexose 315 325.1 163 0.13
13
19 39.3 Caffeoyl quinic acid 325, 210 353.1 191 0.12
49
20 39.8 Dicaffeoyl quinic acid 325, 220 515.4 353, 191 0.09
49
21 40.58 Pelargonidin 369, 229 271.1 181 0.05
13,49
22 41.32 Delphindin dihexoside 519, 277 627 303 0.31
Phloretin-hexoside (Phlo- 47,49
23 43.32 287 435.4 167 0.02
rizin)
Table 1. LC–MS–MS data of the tentatively identified compounds in the ethyl acetate fraction.
y = 0.6701x + 2.1231 and R2 = 1 (Fig. 1d). It was found that each mg of the fraction contains 43.14 ± 0.57 μg
ellagic acid.
LC–MS–MS analysis of ethyl acetate fraction of PL. It is the first time to report the polyphenols pro-
file of the ethyl acetate fraction (the polyphenols rich fraction) using a UPLC–PDA–ESI–MS method (Table 1).
Twenty-three compounds were tentatively identified; most of them (11 compounds) were found to be phenolic
acids and their derivatives. Furthermore, 8 compounds were found to be tannins; 7 of them were hydrolysable
tannins while only one compound was a condensed tannin. Moreover, 3 anthocyanins and 1 flavonoid derivative
were detected.
Green synthesis of AgNPs and its optimization. Firstly, crude extract as well as the ethyl acetate and
n-butanol fractions at different concentrations were preliminary tested in the green synthesis process. It was
found that the AgNPs that were synthesized by the aid of the ethyl acetate fraction was the best, in terms of its
SPR bands (λmax = 417 nm) and particle size (34 nm).
Systematic optimization was carried out to find the best conditions for synthesis of AgNPs by PL for the first
time. Fourteen experimental trials were carried out and responses were recorded (Table 2), the obtained data
were subjected to the chosen models followed by performing fitting analysis using various statistical parameters.
After data modelling, two polynomial equations were generated (Eqs. 1 and 2). Those equations proved that there
is an interaction and curvature effect for the two variables analysed (particle size and PDI). Furthermore, good
fitting of data within the selected models was illustrated in the 3D plots of responses (Fig. 2)
Particle size = −36.265 + 9.289A + 23.031B + 0.805C + 0.450AB − 0.084AC − 0.308BC (1)
PDI = 0.166+0.0022A+0.0146B−0.0334C+0.0028AB−0.0568AC++0.0135BC+0.0398A2 ++0.0215B2 +0.0505C2
(2)
where A is the fraction concentration (mg/mL), B is the silver nitrate concentration (mMol) and C is the tem-
perature (°C).
Regarding the particle size response, ANOVA results showed that the 2FI model is significant with
P-value < 0.05, where A, B, and C are significant model terms. R2 = 0.9733, with lack of fit F-value of 1.92 that
implies non-significant lack of fit relative to the pure error. The quadratic model for the PDI response was found
to be non-significant, with a significant lack of fit F-value of 455.14, this could be attributed to closeness of the
PDI results to each other within the tested ranges, as they are all in the acceptable range below 0.400 (Table 3).
Scientific Reports | (2020) 10:14851 | https://doi.org/10.1038/s41598-020-71847-5 3
Vol.:(0123456789)www.nature.com/scientificreports/
Factor 1 Factor 2 Factor 3 Response 1
Run A: fraction conc. (mg/mL) B: silver nitrate conc. (mMol) C: temperature (ºC) Particle size (Nm) Response 2 PDI
1 2.75 5 80 31.4 0.269
2 0.5 3 80 25.2 0.231
3 2.75 1 60 28.1 0.234
4 5 3 80 45.1 0.175
5 5 3 60 55.8 0.395
6 2.75 1 80 33.3 0.18
7 5 5 70 54.5 0.204
8 0.5 3 60 28.3 0.224
9 2.75 5 60 50.8 0.269
10 0.5 5 70 31.6 0.247
11 2.75 3 70 40.8 0.168
12 0.5 1 70 24.1 0.256
13 5 1 70 38.9 0.202
14 2.75 3 70 38.3 0.164
Table 2. Design matrix showing trial runs performed for optimization of green synthesis of silver
nanoparticles by the aid of pomegranate leaves extract (ethyl acetate fraction) using Box–Behnken Design.
Figure 2. 3D response surface plots for particle size responses at 60 °C (a), 70 °C (b) and 80 °C (c) and PDI
responses at 60 °C (d), 70 °C (e) and 80 °C (f).
The optimum conditions of synthesis of AgNPs using the ethyl acetate fraction was suggested by numerical
optimization where desirability function value closer to 1. The target for each response variable was minimization
to the least possible value. The optimum conditions were found to be fraction concentration of 0.83 mg/mL, silver
nitrate concentration of 1.15 mMol and at 67.5 °C, with predicted values; particle size (24.1 nm) and PDI (0.202).
Characterization of the prepared AgNPs at the optimum conditions. UV–Visible spectrophotom-
etry. In order to monitor the formation of AgNPs, their SPR bands were recorded at different time intervals
(30, 60, 90, 120 and 150 min) during the green synthesis process. In all measurements, AgNPs exhibit strong SPR
band within average of λ max 425 nm. The intensity of the absorbance increases with time, however, the lowest
λmax was shown after incubation for 60 min (438 nm), indicating nanoparticles with smaller d iameter22.
Scientific Reports | (2020) 10:14851 | https://doi.org/10.1038/s41598-020-71847-5 4
Vol:.(1234567890)www.nature.com/scientificreports/
Inhibition zone diameter (mm)
Silver nanoparticles
Ethyl acetate fraction Silver nitrate solution
Organism 0.05 mg/100 µL 0.15 mg/100 µL 0.25 mg/100 µL 0.35 mg/100 µL 0.45 mg/100 µL 0.45 mg/100 µL 0.45 mg/100 µL
Bacillus subtilis 12 16 18 20 23 19 31
Staphylococcus aureus 11 13 14 15 17 22 23
Sarcina lutea 13 16 17 19 19 34 27
Salmonella paratyphi 10 13 15 15 18 0 20
Escherichia coli 12 13 14 16 18 0 22
Pseudomonas aeruginosa 11 11 12 15 16 0 22
Candida albicans 0 11 14 16 17 0 27
Table 3. Antimicrobial activity of the synthesized silver nanoparticles at different concentrations, ethyl acetate
fraction and silver nitrate solution, tested by well diffusion method.
FTIR analysis. FTIR analysis was carried out to determine the important functional groups on the surface of
the nanoparticles (Fig. 3a). IR spectrum showed strong peaks at 1635 cm−1 and 3,300 cm−1 corresponding to
presence of C = C and phenolic –OH respectively. Hence, the obtained results indicate involvement of pome-
granate phenolic compounds in the reduction of silver ions and stabilization of the size and shape of the nano-
particles.
Particle size analysis. The average diameter of the synthesized nanoparticles was determined by light scattering
technique and found to be 26.22 ± 0.63 nm with PDI 0.189 (Fig. 3b).
XRD analysis. The crystalline nature of the AgNPs was confirmed by X-ray crystallography. The XRD pattern
of the synthesized AgNPs is shown in (Fig. 3c). The diffracted intensities were recorded from 2θ of 4° to 2θ of
80°. The XRD pattern showed four strong Bragg reflections at 37.84°, 44.00°, 64.20° and 77.17°, with relative
intensities of 100%, 32.26%, 27.28% and 26.63% respectively. Those four peaks correspond to the planes of (1 1
1), (2 0 0), (2 2 0) and (3 1 1) respectively, which could be indexed according to the facets of face centred cubic
crystal structure of s ilver23. Moreover, the nature of crystals was confirmed to be silver by the interplanar spacing
(dcalculated) values of 2.378, 2.056, 1.451 and 1.236 Å for (1 1 1), (2 0 0), (2 2 0) and (3 1 1) planes respectively that
are matched with standard silver values. The average crystalline size is calculated using Debye–Scherrer formula,
k
D=
β cos θ
where D is the average crystalline size of the nanoparticles, k is the geometric factor (= 0.9), λis the wavelength
of the X-ray radiation source in Å and β is the angular full-width at half maximum (FWHM) in Rad of the XRD
peak at the diffraction angle θ. The calculated average crystalline size of the AgNPs is ~ 32 nm.
Scanning electron microscopy. The SEM analysis was performed to determine the exact shape and size of the
synthesized nanoparticles (Fig. 3). The figures show that the average diameter of the particles was from 20 to
40 nm, and the shape was nearly polygonal. Size range and shape distribution was nearly equal all over the sam-
ple (Fig. 3e). The high magnification photo (Fig. 3f) illustrated the capping of bioactive compounds from the
ethyl acetate fraction on the surface of the nanoparticles.
Antimicrobial activity. The antimicrobial activity of AgNPs, polyphenols rich fraction and silver nitrate were
investigated. The results shown in table (3) revealed that the fraction exhibited antimicrobial activity against
Bacillus subtilis, Staphylococcus aureus and Sarcina lutea, while other microorganisms were resistant to the frac-
tion, the highest activity was against Sarcina lutea with inhibition zone diameter 34 mm. The highest antimicro-
bial activity of AgNPs was found to be against Bacillus subtilis, the rest of tested microorganisms have more or
less equal sensitivity to the synthesized AgNPs with a concentration dependent manner. Silver nitrate solution
showed the highest antimicrobial activity against all the tested microorganisms except Sarcina lutea.
Discussion
Currently, green synthesis is gaining a great interest in the production of metal nanoparticles, due to their ease
of synthesis, eco and environmentally friendly, and utilization of plants waste products24.
Aqueous extract of PL was found to have a good potential in the production of AgNPs with anticancer
activity on human cervical cancer cells, liver cancer cells (HepG2) and antidiabetic activity18,20,25. Based on the
reported data, there was a need for preparation of a standardized phytochemically analysed fraction and correlate
that action with its components. To achieve that goal, the aqueous alcohol extract of PL was fractionated using
n-hexane, methylene chloride, ethyl acetate and n-butanol. The crude extract as well as the different fractions at
different concentrations were preliminary tested for their ability to synthesize AgNPs with good characteristics.
The comparison between the outcome of each experiment was based on its SPR band as the best nanoparticles
would have the lowest λmax with the highest intensity22. Moreover, spectrophotometric determination of total
Scientific Reports | (2020) 10:14851 | https://doi.org/10.1038/s41598-020-71847-5 5
Vol.:(0123456789)www.nature.com/scientificreports/
Figure 3. Characterization of the synthesized silver nanoparticles (AgNPs) at the optimum conditions, (a)
FTIR spectrum of AgNPs, (b) size distribution by intensity using light scattering technique, (c) XRD pattern,
(d) SEM image of AgNPs at magnification power × 480,000, (e) SEM image of AgNPs at magnification
power × 160,000, (f) SEM image of AgNPs at magnification power × 960,000.
polyphenols and flavonoids were carried out for the previous samples. It was found that the best characteristics
of the AgNPs were synthesized by the aid of the polyphenols rich fraction (ethyl acetate fraction).
The ethyl acetate fraction was standardized using UPLC-PDA-UV method with reference to the major phe-
nolic compound that was isolated from the fraction itself; which was found to be ellagic acid. The fraction was
further analysed by an LC–MS–MS method that revealed tentative identification of 23 polyphenols for the first
time in the leaves of pomegranate grown in Egypt (Table 1).
Many studies before mentioned the role of plant polyphenols in the green synthesis of AgNPs. For example,
the phenolic extracts obtained from Bilberry and Red Currant waste extracts were found to produce AgNPs with
a hydrodynamic diameter of 25–65 nm26. Jigyasa and Rajput (2018) promoted the green synthesis of AgNPs
for colorimetric detection of melamine in milk using different bio-polyphenols such as rutin and c urcumin27.
More specifically, gallic acid and quercetin mediated the synthesis of silver and bimetallic (silver and selenium)
nanoparticles with antimicrobial and antitumor activities28,29. More importantly, ellagic acid was not only has
Scientific Reports | (2020) 10:14851 | https://doi.org/10.1038/s41598-020-71847-5 6
Vol:.(1234567890)www.nature.com/scientificreports/
the capability of reducing silver ions, resulting in the formation of AgNPs, further, the AgNPs in the presence of
ellagic acid were highly effective as antibacterial agents, this finding support our r esults30.
From the optimization 3D plot diagrams shown in (Fig. 2), it was deduced that there is an increase in the
particle size in correlation to the increase in concentration of the ethyl acetate fraction and/or silver nitrate, while
there is an inverse correlation with temperature. It was reported that increasing in the silver nitrate concentra-
tion increases the particle size, as they were easy to aggregate into larger particles, due to the rise of the collision
frequency with an increasing of silver salt c ontent31. Moreover, the temperature was found to have a significant
effect on the formation, shape, size and size distribution of particles32. Liu et al. (2017) found that the size of
AgNPs was slightly increased from 70 to 80 °C, while it decreased sharply from 80 to 90 °C, they concluded that
the decrease of size at high temperature is a result from the sharply increased nucleation rate constant instead of
the decreased growth rate constant33. Although, the statistical model of the PDI was found to be not significant,
it is obvious from the diagrams (Fig. 2d–f) that PDI has an optimum range of temperature to be minimized, less
or more than that range, PDI will increase.
A characterization profile was carried out for the AgNPs obtained from the optimized experiment. Particle
size was analysed by light scattering technique and SEM, the results were relatively in the same range and in
consistence with the theoretically calculated particle size from the polynomial equation obtained after data mod-
elling and the Debye–Scherrer formula obtained from the XRD analysis. In the current study, the particle size of
the synthesized AgNPs by the aid of the polyphenols rich fraction was found to be relatively smaller than those
reported before in literature which obtained from crude aqueous extracts of different organs of p omegranate34,
the range of particle sizes of AgNPs prepared by crude aqueous extract of pomegranate leaves was found to be
35–70 nm18,20.
The UV–Visible spectral analysis showed λmax in the range that is similar to those reported before for AgNPs
synthesized by pomegranate leaves18,20. Similar type of analysis with nearly the same range of results was carried
out before in recent studies of synthesis of AgNPs using extracts of different plants, such as Allium cepa (onion),
Parkia speciose, and Salvia hispanica35–37.
FTIR analysis confirmed the role of pomegranate phytochemicals as reducing and stabilizing agents for the
AgNPs. The spectrum revealed presence of C=C stretching vibrations of the phenolic compounds and phenolic
hydroxyl groups. Similar findings were obtained from the AgNPs prepared by Diospyros lotus and Thunbergia
grandiflora extracts38,39. As mentioned before, ellagic acid is the major compound in the PL, it was reported that
ellagic acid which is the major antioxidant component in the combined peels extract of pomegranate, orange,
banana and apple is responsible for the synthesis of AgNPs, as it has an easy electron loosing capacity which
results in formation of H + radical, that reduces the size of silver to nano s ize40.
XRD analysis confirmed the cubic nature of the AgNPs (Joint Committee on Powder Diffraction Standards;
JCPDS no. 04-0783), the results are consistent with previous studies, reporting similar diffraction peaks20,23.
Size and nature of AgNPs was confirmed by the high magnification using SEM technique, which also confirmed
presence of an organic shell around the nanoparticles.
Antimicrobial activities of the synthesized AgNPs, polyphenols rich fraction and silver nitrate solution were
tested against different Gram positive, Gram negative bacteria, and fungi. The majority of the tested microor-
ganisms had resistance to the fraction. On the other hand, AgNPs showed antimicrobial activity against all the
tested microorganisms. As silver nitrate solution exhibited strong antimicrobial activity in contrast to the frac-
tion, that could rationalize the antimicrobial characters of the AgNPs by presence of silver metal rather than
the coating organic material. The antimicrobial activity of silver metal is reported for a wide range of over 650
microorganisms from different classes such as viruses, gram positive and gram negative bacterial, and fungi41. The
bactericidal effect of silver nitrate was reported b efore42,43, it was found that at lower concentrations it induced
synthesis of AgNPs, whereas at higher concentrations it induced cell d eath44. The higher antimicrobial activity
of silver nitrate solution than AgNPs against all tested bacteria is highly supported with those reported by Li
et al.45 and Kedziora et al.46.
It was reported that different extracts of PL had moderate antimicrobial activity against various human
pathogens47. Pomegranate peels extract was also found to have in-vitro and in-vivo antibacterial activity against
different strains of Salmonella48.
In conclusion, in this study twenty three polyphenolic compounds were tentatively identified by LC–MS–MS
techniques in ethyl acetate fraction. This fraction was standardized by UPLC–PDA–UV method with reference
to its major compound ellagic acid. AgNPs were biosynthesized using polyphenol rich fraction of PL in a sim-
ple one step process. The production of AgNPs was correlated to the phenolic content of PL and FTIR results
confirmed this finding. Systematic optimization of AgNPs using PL proved the direct correlation between the
particle size with silver nitrate and fraction concentrations, and inverse correlation with the temperature. AgNPs
were found to have an average size of 26.22 nm size, polygonal structure, absorbance maxima at 425 nm and the
presence of biocompatible capping over it. The antibacterial activity of the synthesized AgNPs on tested organ-
isms further confirms the activity to the silver metal rather than the polyphenols adsorbed on the surface of the
AgNPs. Finally, pomegranate polyphenols could provide promising opportunities in silver nanoparticles industry.
Material and methods
Chemicals. All solvents were of HPLC grade, while those used in LC–MS–MS analysis were of MS grade.
Rutin, gallic acid, and silver nitrate were purchased from Sigma-Aldrich (Schnelldorf, Germany).
Plant material. Punica granatum leaves were collected from the botanical garden of Cairo University. Iden-
tity was verified by Prof. Mohammed El-Sayed, Horticultural Research Institute, Agriculture Research Centre,
Scientific Reports | (2020) 10:14851 | https://doi.org/10.1038/s41598-020-71847-5 7
Vol.:(0123456789)www.nature.com/scientificreports/
Ministry of Agriculture, Giza. A voucher specimen (No. PG002) has been deposited in the herbarium of the
Faculty of Pharmacy, BUE, Cairo, Egypt.
Preparation of extract and fractions. Five hundred gram of PL were extracted by maceration in 1 L of
70% ethanol for 48 h at room temperature, followed by filtration. The extraction process was repeated 3 times.
The extracts were collected and dried under reduced pressure at 45 °C. The dried hydroalcoholic extract was
suspended in distilled water and fractionated using solvents of increasing polarities, which are n-hexane, meth-
ylene chloride, ethyl acetate and n-butanol. Fractions were dried to yield 0.45 g, 9 g, 12 g and 10.5 g respectively.
Spectrophotometric analysis of total polyphenols and flavonoids contents. Total polyphenols
and flavonoids contents of ethyl acetate and n-butanol fractions in comparison to the crude extract were assayed
using Folin-Ciocalteu method and aluminium chloride method respectively, that were reported by Attard49 and
Herald et al.50, utilizing the microplate reader Fluostar Omega (BMG Labtech, Germany). Gallic acid and rutin
were used as standards to calculate the total polyphenols content (mg GAE/g extract or fraction) and total fla-
vonoids content (mg RE/g extract or fraction). The range of gallic acid concentrations to establish a calibration
curve was from 7.8 to 500 μg/mL, while that of rutin was from 50 to 1,000 μg/mL.
Isolation and identification of the major compound. The major phenolic compound in the PL extract
was isolated by automated flash chromatography technique (Puriflash 4100 system—Interchim; Montlucon,
France) with PDA–UV–Visible detector 190–840 nm and equipped with Puriflash column 30 C18 HP (20 bar).
For system controlling and process monitoring, Interchim Software 5.0 was used. 10 g of the polyphenols rich
fraction was dissolved in 50 mL of ethanol, then introduced into the column via dry loading technique using
10 g celite gel. Mobile phase was composed of 0.1% formic acid in water (Solvent A), and acetonitrile (Solvent
B). The total run was for 210 min, and the gradient program was; 0–15 min (5–10% B), 15–135 min (10% B),
135–165 min (25% B), 165–180 min (45% B) and 180–210 min (100% B). The flow rate was 30 mL/min, and
totally, 300 fractions were collected, each was with volume of 20 mL. The compound was precipitated as yellow-
ish buff crystals from the fractions 20–80. The structure of the compound was elucidated by 1H and 13C NMR
analyses that were recorded by Bruker Avance III HD FT-high resolution, Geramany- 1H-NMR (400 MHz),
13
C-NMR (100 MHz) at Faculty of Pharmacy-Mansoura University.
Standardization of the polyphenols rich fraction using Ultra performance liquid chromatog-
raphy (UPLC) analysis. The polyphenols rich fraction was standardized. The experiment was carried out
on Thermo Fisher UPLC Model Ultimate 3,000 (USA), equipped with PDA–UV–Visible light detector, on a
column Hypersil GOLD (250 mm × 4.6 mm i.d.) and particle size 5 µm. Mobile phase was composed of 0.1%
phosphoric acid in water as solvent A, and acetonitrile as solvent B, with constant flow rate at 0.7 mL/min. The
gradient program was, 0–7 min (5–15% B), 7–10 min (15% B), 10–22 min (15–35% B), 22–35 min (35–100% B)
and 35–40 min (100–5% B). Injection volume was 20 μL and column oven temperature was 30 °C. A calibration
curve of the isolated major phenolic compound was established with concentrations range (31.25–1,000 μg/mL)
and ethyl acetate fraction concentration was 5 mg/mL. All analyses were carried out in triplicate.
LC–MS–MS analysis of the polyphenols rich fraction. The parameters of the LC–MS analysis were
adjusted according to the method developed by Alfaifi et al.51. In details, the chromatographic separation was
carried on Waters Acquity Xevo TQD system, on column Acquity BEH C18 100 mm × 2.1 mm column (p.s.,
1.7 µm) (Waters, Ireland). Absolute ethanol was used to solubilize the sample at concentration of 1 mg/mL and
filtered through a micropore filter of size 0.2 µm, the injection volume was 10 μL. The mobile phase system
composed of Solvent A (0.1% formic acid in water) and Solvent B (0.1% formic acid in acetonitrile) at flow rate
200 μL/min with gradient elution: 0–4 min (15% B), 4–8 min (20% B), 8–30 min (55% B), 30–35 min (90% B)
and 35–40 min (15% B). The high resolution mass spectra were recorded by Xevo TM triple-quadrupole tan-
dem mass spectrometer with electrospray ionization (ESI) interface (Waters Corp., Milford, MA, USA) at mass
ranges from 100 to 1,000 m/z, capillary voltage, 3.5 kV; detection at cone voltages, 20 V—95 V; radio frequency
(RF) lens voltage, 2.5 V; source temperature,150 °C and desolvation gas temperature, 500 °C. Nitrogen was used
as desolvation and cone gas at a flow rate of 1,000 and 20 L/h, respectively. System operation and data acquisition
were controlled using Mass Lynx 4.1 software (Waters) .
Green synthesis of AgNPs. AgNPs were synthesized by reduction of silver ions (Ag+) of silver nitrate
solution to silver metal (Ago). Briefly, 250 mL of silver nitrate solution at varying concentrations (1–5 mM) were
heated to a temperature ranging from 60 to 80 °C, followed by addition of 50 mL of the plant material solution
(hydroalcoholic extract, ethyl acetate fraction, or n-butanol fraction) at concentrations 0.5–5 mg/mL, with con-
tinuous stirring at 1,500 rpm for 1 hAfter that, AgNPs were pelleted by centrifugation at 10,000×g for 90 min at
4 °C, then washed thrice by deionized water, lyophilized and stored at − 18 °C for further analysis.
Systematic optimization of the green synthesis process. Box-Behnken design was used to optimize
the green synthesis process for production of AgNPs with the aid of Design Expert ver. 11.0 (Stat-Ease Inc., Min-
neapolis, USA). The independent variables for the optimization process were silver nitrate concertation, plant
material concentration and temperature. Each variable was tested at three different levels; low (− 1), medium (0),
and high (+ 1). A total of 14 trials were suggested by the selected design. Particle size and Polydispersity index
(PDI) were analyzed as responses. After feeding the data in the design, mathematical modelling was carried out
Scientific Reports | (2020) 10:14851 | https://doi.org/10.1038/s41598-020-71847-5 8
Vol:.(1234567890)www.nature.com/scientificreports/
for analysis of results. Two factor interaction (2FI) process order was the best fitting model for the particle size
response, while quadratic second order model was the suggested fitting model for the PDI response. After that
the results were analyzed by ANOVA. The optimum conditions were identified by graphical optimization tech-
niques and numerical desirability function.
Characterization of AgNPs. UV–Visible spectral analysis. Surface plasmon resonance (SPR) bands of
AgNPs were recorded on UV–Visible spectrophotometer device (Jasco-V630, Jasco Inc., MD, USA) at different
time intervals during the green synthesis process. The wavelengths range of the spectral analysis was from 300
to 700 nm.
Fourier transform infrared spectroscopy (FTIR). FTIR spectroscopy analysis for AgNPs was carried out on Ver-
tex 70 FTIR, Brucker (USA). A thin film of the sample was allowed to form on KBr pellet and spectra were
recorded.
Particle size analysis by light scattering technique. The mean particle size (diameter) and size distribution (PDI)
of the synthesized nanoparticles were analysed with dynamic light scattering measurements at a scattering angle
of 173°. Measurements were performed using a Zetasizer Nano ZS (Malvern Instruments, UK), where the dried
nanoparticles were reconstituted in deionized water.
X‑ray diffraction (XRD). XRD measurement was carried out on X-ray diffractometer (Empyrean—Malvern
Panalytical—Netherland), at X-ray power 40 kV and 30 mA and the spectrum was recorded by CuKα radiation
with wavelength of 1.5406 Å in the 2θ range of 4°–80°, with a continuous scan type, step size (2θ) was 0.0200
and scan step time was 0.5 s.
Scanning electron microscopy (SEM). Field emission SEM (Quattro S, Thermo scientific, USA) was used for the
purpose of imaging of the synthesized AgNPs in order to study their shape and size. A small amount of AgNPs
were placed on carbon coated copper grid. Then images were recorded at a magnifications × 160,000, × 480,000
and × 960,000.
Antimicrobial activity of the prepared AgNPs. Antimicrobial activity of the AgNPs were analysed by well diffu-
sion method that was reported by Jyoti et al.23 as their AgNPs were synthesized using a plant extract and the par-
ticle sizes range was nearly the same as our findings. The analysis was carried out against G + ve bacteria (Bacillus
subtilis, Staphylococcus aureus, and Sarcina lutea), G -ve bacteria (Salmonella paratyphi, Escherichia coli, and
Pseudomonas aeruginosa) and fungi (Candida albicans). In each plate, five different concentrations of AgNPs
were tested (0.05, 0.15, 0.25, 0.35 and 0.45 mg/100 µL), ethyl acetate fraction (0.45 mg/100 µL) and silver nitrate
(0.45 mg/100 µL). The plates were incubated for 24 h at 37 °C, then the inhibition zone diameters were recorded.
Data availability
All data generated or analyzed during this study are included in this published article.
Received: 22 June 2020; Accepted: 19 August 2020
References
1. Samuel, M. S. et al. Preparation of graphene oxide/chitosan/ferrite nanocomposite for Chromium(VI) removal from aqueous
solution. Int. J. Biol. Macromol. 119, 540–547. https://doi.org/10.1016/j.ijbiomac.2018.07.052 (2018).
2. Parthiban, C. et al. Visible-light-triggered fluorescent organic nanoparticles for chemo-photodynamic therapy with real-time
cellular imaging. ACS Appl. Nano Mater. 1, 6281–6288. https://doi.org/10.1021/acsanm.8b01495 (2018).
3. Saravanan, M., Barik, S. K., MubarakAli, D., Prakash, P. & Pugazhendhi, A. Synthesis of silver nanoparticles from Bacillus brevis
(NCIM 2533) and their antibacterial activity against pathogenic bacteria. Microb. Pathog. 116, 221–226. https://doi.org/10.1016/j.
micpath.2018.01.038 (2018).
4. Shanmuganathan, R. et al. Synthesis of silver nanoparticles and their biomedical applications: a comprehensive review. Curr.
Pharm. Des. 25, 2650–2660. https://doi.org/10.2174/1381612825666190708185506 (2019).
5. Thi Ngoc Dung, T. et al. Silver nanoparticles as potential antiviral agents against African swine fever virus. Materials Research
Express 6, 1250–1259. https://doi.org/10.1088/2053-1591/ab6ad8 (2020).
6. Deshmukh, S. P., Patil, S. M., Mullani, S. B. & Delekar, S. D. Silver nanoparticles as an effective disinfectant: a review. Mater. Sci.
Eng. C 97, 954–965. https://doi.org/10.1016/j.msec.2018.12.102 (2019).
7. Marimuthu, S. et al. Silver nanoparticles in dye effluent treatment: a review on synthesis, treatment methods, mechanisms, pho-
tocatalytic degradation, toxic effects and mitigation of toxicity. J. Photochem. Photobiol. B 205, 111823. https://doi.org/10.1016/j.
jphotobiol.2020.111823 (2020).
8. Jacob, J. M. et al. Bactericidal coating of paper towels via sustainable biosynthesis of silver nanoparticles using Ocimum sanctum
leaf extract. Mater. Res. Express 6, 045401. https://doi.org/10.1088/2053-1591/aafaed (2019).
9. Pradhan, S. K., Pareek, V., Panwar, J. & Gupta, S. Synthesis and characterization of ecofriendly silver nanoparticles combined
with yttrium oxide (Ag-Y2O3) nanocomposite with assorted adsorption capacity for Cu(II) and Cr(VI) removal: a mechanism
perspective. J. Water Process Eng. 32, 100917. https://doi.org/10.1016/j.jwpe.2019.100917 (2019).
10. Anwar, F. & Arthanareeswaran, G. Silver nano-particle coated hydroxyapatite nano-composite membrane for the treatment of
palm oil mill effluent. J. Water Process Eng. 31, 100844. https://doi.org/10.1016/j.jwpe.2019.100844 (2019).
11. Bratan, S. et al. World market for nanomaterials: structure and trends. MATEC Web Conf. 129, 02013. https://doi.org/10.1051/
matecconf/201712902013 (2017).
Scientific Reports | (2020) 10:14851 | https://doi.org/10.1038/s41598-020-71847-5 9
Vol.:(0123456789)www.nature.com/scientificreports/
12. Samuel, M. S., Jose, S., Selvarajan, E., Mathimani, T. & Pugazhendhi, A. Biosynthesized silver nanoparticles using Bacillus
amyloliquefaciens; application for cytotoxicity effect on A549 cell line and photocatalytic degradation of p-nitrophenol. J. Photo-
chem. Photobiol. B 202, 111642. https://doi.org/10.1016/j.jphotobiol.2019.111642 (2020).
13. Jorge de Souza, T. A., Rosa Souza, L. R. & Franchi, L. P. Silver nanoparticles: an integrated view of green synthesis methods, trans-
formation in the environment, and toxicity. Ecotoxicol. Environ. Saf. 171, 691–700. https://doi.org/10.1016/j.ecoenv.2018.12.095
(2019).
14. Marslin, G. et al. Secondary metabolites in the green synthesis of metallic nanoparticles. Materials 11, 940. https: //doi.org/10.3390/
ma11060940 (2018).
15. Fischer, U. A., Carle, R. & Kammerer, D. R. Identification and quantification of phenolic compounds from pomegranate (Punica
granatum L.) peel, mesocarp, aril and differently produced juices by HPLC-DAD-ESI/MS(n). Food Chem. 127, 807–821. https://
doi.org/10.1016/j.foodchem.2010.12.156 (2011).
16. Zarfeshany, A., Asgary, S. & Javanmard, S. H. Potent health effects of pomegranate. Adv. Biomed. Res. 3, 100. https://doi.
org/10.4103/2277-9175.129371 (2014).
17. Akkiraju, P., Tathe, P. & Mamillapalli, S. Green synthesis of silver nanoparticles from Punica granatum L. and its antimicrobial
activity. Adv. Appl. Sci. Res. 8, 42–49 (2017).
18. Sarkar, S. & Kotteeswaran, V. Green synthesis of silver nanoparticles from aqueous leaf extract of Pomegranate (Punica granatum)
and their anticancer activity on human cervical cancer cells. Adv. Nat. Sci. 9, 025014. https://doi.org/10.1088/2043-6254/aac590
(2018).
19. Joshi, S. J., Al-Mamari, S. & Al-Azkawi, A. Green synthesis of silver nanoparticles using pomegranate peel extracts and its applica-
tion in photocatalytic degradation of methylene blue. Jundishapur J. Nat. Pharm. Prod. 13, e67846. https://doi.org/10.5812/jjnpp
.67846(2018).
20. Saratale, R. G. et al. Exploiting antidiabetic activity of silver nanoparticles synthesized using Punica granatum leaves and anticancer
potential against human liver cancer cells (HepG2). Artif. Cells Nanomed. Biotechnol. 46, 211–222. https://doi.org/10.1080/21691
401.2017.1337031 (2018).
21. da Silva, F. et al. Integrative analysis based on HPLC-DAD-MS/MS and NMR of Bertholletia excelsa bark biomass residues:
determination of ellagic acid derivatives. J. Braz. Chem. Soc. https://doi.org/10.21577/0103-5053.20180215 (2018).
22. Hasnain, M. S. et al. Purple heart plant leaves extract-mediated silver nanoparticle synthesis: Optimization by Box-Behnken design.
Mater. Sci. Eng. C 99, 1105–1114. https://doi.org/10.1016/j.msec.2019.02.061 (2019).
23. Jyoti, K., Baunthiyal, M. & Singh, A. Characterization of silver nanoparticles synthesized using Urtica dioica Linn. leaves and their
synergistic effects with antibiotics. J. Radiat. Res. Appl. Sci. 9, 217–227. https://doi.org/10.1016/j.jrras.2015.10.002 (2016).
24. Das, M. & Chatterjee, S. Green Synthesis, Characterization and Applications of Nanoparticles 265–301 (Elsevier, Amsterdam, 2019).
25. Akbal, A., Turkdemir, M. H., Cicek, A. & Ulug, B. Relation between silver nanoparticle formation rate and antioxidant capacity
of aqueous plant leaf extracts. J. Spectrosc. 2016, 4083421. https://doi.org/10.1155/2016/4083421 (2016).
26. Zuorro, A., Iannone, A., Natali, S. & Lavecchia, R. Green synthesis of silver nanoparticles using bilberry and red currant waste
extracts. Processes 7, 193. https://doi.org/10.3390/pr7040193 (2019).
27. Jigyasa, K. & Rajput, J. K. Bio-polyphenols promoted green synthesis of silver nanoparticles for facile and ultra-sensitive colori-
metric detection of melamine in milk. Biosens. Bioelectron. 120, 153–159. https://doi.org/10.1016/j.bios.2018.08.054 (2018).
28. Mittal, A. K., Kumar, S. & Banerjee, U. C. Quercetin and gallic acid mediated synthesis of bimetallic (silver and selenium) nanoparti-
cles and their antitumor and antimicrobial potential. J. Colloid Interface Sci. 431, 194–199. https: //doi.org/10.1016/j.jcis.2014.06.030
(2014).
29. Li, D., Liu, Z., Yuan, Y., Liu, Y. & Niu, F. Green synthesis of gallic acid-coated silver nanoparticles with high antimicrobial activity
and low cytotoxicity to normal cells. Process Biochem. 50, 357–366. https://doi.org/10.1016/j.procbio.2015.01.002 (2015).
30. Barnaby, S. N. et al. Ellagic acid promoted biomimetic synthesis of shape-controlled silver nanochains. Nanotechnology 22, 225605.
https://doi.org/10.1088/0957-4484/22/22/225605 (2011).
31. Sobczak-Kupiec, A., Malina, D., Wzorek, Z. & Zimowska, M. Influence of silver nitrate concentration on the properties of silver
nanoparticles. Micro Nano Lett. 6, 656. https://doi.org/10.1049/mnl.2011.0152 (2011).
32. Jiang, X. C., Chen, W. M., Chen, C. Y., Xiong, S. X. & Yu, A. B. Role of temperature in the growth of silver nanoparticles through
a synergetic reduction approach. Nanoscale Res. Lett. 6, 32. https://doi.org/10.1007/s11671-010-9780-1 (2011).
33. Liu, H., Zhang, H., Wang, J. & Wei, J. Effect of temperature on the size of biosynthesized silver nanoparticle: deep insight into
microscopic kinetics analysis. Arab. J. Chem. 13, 1011–1019. https://doi.org/10.1016/j.arabjc.2017.09.004 (2020).
34. Devanesan, S. et al. Antimicrobial and cytotoxicity effects of synthesized silver nanoparticles from Punica granatum peel extract.
Nanoscale Res. Lett. 13, 315. https://doi.org/10.1186/s11671-018-2731-y (2018).
35. Jini, D. & Sharmila, S. Green synthesis of silver nanoparticles from Allium cepa and its in vitro antidiabetic activity. Mater. Today
22, 432–438. https://doi.org/10.1016/j.matpr.2019.07.672 (2020).
36. Ravichandran, V. et al. Green synthesis, characterization, antibacterial, antioxidant and photocatalytic activity of Parkia speciosa
leaves extract mediated silver nanoparticles. Results Phys. 15, 102565. https://doi.org/10.1016/j.rinp.2019.102565 (2019).
37. Hernández-Morales, L. et al. Study of the green synthesis of silver nanoparticles using a natural extract of dark or white Salvia
hispanica L. seeds and their antibacterial application. Appl. Surf. Sci. 489, 952–961. https://doi.org/10.1016/j.apsusc.2019.06.031
(2019).
38. Hamedi, S. & Shojaosadati, S. A. Rapid and green synthesis of silver nanoparticles using Diospyros lotus extract: Evaluation of their
biological and catalytic activities. Polyhedron 171, 172–180. https://doi.org/10.1016/j.poly.2019.07.010 (2019).
39. Varadavenkatesan, T., Selvaraj, R. & Vinayagam, R. Green synthesis of silver nanoparticles using Thunbergia grandiflora flower
extract and its catalytic action in reduction of Congo red dye. Mater. Today 23, 39–42. https://doi.org/10.1016/j.matpr.2019.05.441
(2020).
40. Naganathan, K. & Thirunavukkarasu, S. Green way genesis of silver nanoparticles using multiple fruit peels waste and its antimi-
crobial, anti-oxidant and anti-tumor cell line studies. IOP Conf. Ser. 191, 012009. https://doi.org/10.1088/1757-899x/191/1/01200
9 (2017).
41. Ahmed, S., Ahmad, M., Swami, B. L. & Ikram, S. A review on plants extract mediated synthesis of silver nanoparticles for antimi-
crobial applications: a green expertise. J. Adv. Res. 7, 17–28. https://doi.org/10.1016/j.jare.2015.02.007 (2016).
42. Mohamed, D. S., Abd El-Baky, R. M., Sandle, T., Mandour, S. A. & Ahmed, E. F. Antimicrobial activity of silver-treated bacteria
against other multi-drug resistant pathogens in their environment. Antibiotics 9, 181. https://doi.org/10.3390/antibiotics9040181
(2020).
43. Pratama, M. A., Ramahdita, G. & Yuwono, A. H. The effect of silver nitrate addition on antibacterial properties of bone scaffold
chitosan-hydroxyapatite. AIP Conf. Proc. https://doi.org/10.1063/1.5139334 (2019).
44. Pandian, S. R. K., Deepak, V., Kalishwaralal, K., Viswanathan, P. & Gurunathan, S. Mechanism of bactericidal activity of silver
nitrate: a concentration dependent bifunctional molecule. Braz. J. Microbiol. 41, 805–809. https://doi.org/10.1590/S1517-83822
010000300033 (2010).
45. Li, W.-R. et al. A comparative analysis of antibacterial activity, dynamics, and effects of silver ions and silver nanoparticles against
four bacterial strains. Int. Biodeterior. Biodegrad. 123, 304–310. https://doi.org/10.1016/j.ibiod.2017.07.015 (2017).
46. Kedziora, A. et al. Similarities and Differences between Silver Ions and Silver in Nanoforms as Antibacterial Agents. Int. J. Mol.
Sci. https://doi.org/10.3390/ijms19020444 (2018).
Scientific Reports | (2020) 10:14851 | https://doi.org/10.1038/s41598-020-71847-5 10
Vol:.(1234567890)www.nature.com/scientificreports/
47. Alemu, F., Tilahun, A. & Elias, E. In vitro antimicrobial activity screening of Punica granatum extracts against human pathogens.
Mol. Med. (2017).
48. Choi, J. G. et al. In vitro and In vivo antibacterial activity of Punica granatum peel ethanol extract against Salmonella. Evid. Based
Complement. Alternat. Med. 2011, 690518. https://doi.org/10.1093/ecam/nep105 (2011).
49. Attard, E. A rapid microtitre plate Folin-Ciocalteu method for the assessment of polyphenols. Open Life Sci. 8, 48–53. https://doi.
org/10.2478/s11535-012-0107-3 (2013).
50. Herald, T. J., Gadgil, P. & Tilley, M. High-throughput micro plate assays for screening flavonoid content and DPPH-scavenging
activity in sorghum bran and flour. J. Sci. Food Agric. 92, 2326–2331. https://doi.org/10.1002/jsfa.5633 (2012).
51. Alfaifi, M. et al. Analgesic, anti-inflammatory, cytotoxic activity screening and UPLC-PDA-ESI-MS metabolites determination of
bioactive fractions of Kleinia pendula. Molecules https://doi.org/10.3390/molecules25020418 (2020).
52. Mena, P. et al. Rapid and comprehensive evaluation of (poly)phenolic compounds in pomegranate (Punica granatum L.) juice by
UHPLC-MSn. Molecules 17, 14821–14840. https://doi.org/10.3390/molecules171214821 (2012).
53. Yisimayili, Z. et al. A comprehensive study of pomegranate flowers polyphenols and metabolites in rat biological samples by high-
performance liquid chromatography quadrupole time-of-flight mass spectrometry. J. Chromatogr. A 1604, 460472. https://doi.
org/10.1016/j.chroma.2019.460472 (2019).
54. Fellah, B., Bannour, M., Rocchetti, G., Lucini, L. & Ferchichi, A. Phenolic profiling and antioxidant capacity in flowers, leaves and
peels of Tunisian cultivars of Punica granatum L. J. Food Sci. Technol. 55, 3606–3615. https://doi.org/10.1007/s13197-018-3286-8
(2018).
Acknowledgements
The authors would like to thank the Nanotechnology centre at the British University in Egypt (BUE) for sup-
porting us with the needed equipment and instrumentation.
Author contributions
N.S. and K.N. designed the study, methodology, validation, wrote the main manuscript, and prepared the tables
and figures. Both authors reviewed and revised the manuscript.
Competing interests
The authors declare no competing interests.
Additional information
Correspondence and requests for materials should be addressed to N.S.
Reprints and permissions information is available at www.nature.com/reprints.
Publisher’s note Springer Nature remains neutral with regard to jurisdictional claims in published maps and
institutional affiliations.
Open Access This article is licensed under a Creative Commons Attribution 4.0 International
License, which permits use, sharing, adaptation, distribution and reproduction in any medium or
format, as long as you give appropriate credit to the original author(s) and the source, provide a link to the
Creative Commons licence, and indicate if changes were made. The images or other third party material in this
article are included in the article’s Creative Commons licence, unless indicated otherwise in a credit line to the
material. If material is not included in the article’s Creative Commons licence and your intended use is not
permitted by statutory regulation or exceeds the permitted use, you will need to obtain permission directly from
the copyright holder. To view a copy of this licence, visit http://creativecommons.org/licenses/by/4.0/.
© The Author(s) 2020
Scientific Reports | (2020) 10:14851 | https://doi.org/10.1038/s41598-020-71847-5 11
Vol.:(0123456789)You can also read