Introduction of a New Mobile Player App Store in Selected Countries of Southeast Asia - MDPI
←
→
Page content transcription
If your browser does not render page correctly, please read the page content below
$
     £ ¥€
            social sciences
Article
Introduction of a New Mobile Player App Store
in Selected Countries of Southeast Asia
Peter Štarchoň 1 , Milota Vetráková 2 , Jozef Metke 1 , Silvia Lorincová 3, * , Miloš Hitka 3        and
Dagmar Weberová 4
 1    Faculty of Management, Comenius University in Bratislava, Odbojárov 10, P.O.BOX 95, 82005 Bratislava,
      Slovakia; peter.starchon@fm.uniba.sk (P.Š.); jozef.metke@gmail.com (J.M.)
 2    Faculty of Economics, Matej Bel University in Banská Bystrica, Tajovského 10, Banská Bystrica 97590,
      Slovakia; milota.vetrakova@umb.sk
 3    Faculty of Wood Science and Technology, Technical University in Zvolen, T. G. Masaryka 24, 96053 Zvolen,
      Slovakia; silvia.lorincova@tuzvo.sk
 4    Faculty of Multimedia Communications, Tomas Bata University in Zlín, 2431 Stefanikova Str., 76001 Zlín,
      Czech Republic; weberova@utb.cz
 *    Correspondence: silvia.lorincova@tuzvo.sk; Tel.: +421-45-520-6042

 Received: 12 July 2018; Accepted: 13 September 2018; Published: 15 September 2018

 Abstract: Trends in modern society have a significant impact on the way organizations operate.
 The use of mobile phones makes it possible to create completely new high-availability communication
 and business channels. Mobile phones are used in mobile marketing, which has come to the fore via
 SMS marketing. In this article, the focus is on the use of mobile phones in e-business. The introduction
 of a new mobile player app store was analyzed through research conducted in 2017. The aim of the
 research was to find out whether it is possible—in terms of the sustainability of the consumption of a
 marketing product—to introduce a single campaign with the same content but in different language
 mutations in selected markets, or whether it is necessary to use a completely different campaign and
 means of communication for each market. Overall, 287 respondents from the Philippines, Thailand,
 and India were examined. The dependency between the socio-demographic characteristics of the
 respondents (country, gender, and age) and site engagement was tested, and user experience was
 tested, too. The results of the research revealed that there was no dependency between belonging to
 the selected countries and site engagement. Furthermore, there was also no dependency between
 gender and site engagement. On the other hand, there was a statistically significant dependency
 between belonging to the country and the design of the website.

 Keywords: e-business; mobile marketing; Chi-square test; app store; Philippines; Thailand; India

1. Introduction
     The third millennium is linked to globalization, the rapid development of information,
and communication technologies. In addition to these trends, the modern economy is characterized by
growth in both consumption and information. The role of national governance is to ensure the social
responsibility and sustainable development of all actors in the economic sphere. In the corporate sector,
these trends are reflected in the introduction of innovations which make it possible to implement a
new way of business.
     The rapid development of new technologies also penetrates marketing (Aretoulis 2018;
Čierna et al. 2017; Waheed and Yang 2017; Zaborova et al. 2017; Hiadlovský et al. 2016;
Malichova et al. 2016; Hockicko et al. 2015; Tokarčíková and Kucharčíková 2015; Jaroslav et al. 2013;
Li and Zhang 2013; Kuzman et al. 2012; Chu et al. 2011; Deng et al. 2009; Metke 2006). A few

Soc. Sci. 2018, 7, 163; doi:10.3390/socsci7090163                                 www.mdpi.com/journal/socsci
Soc. Sci. 2018, 7, 163 2 of 15
years ago, people watched the same media, and so advertising could act simultaneously for several
million consumers. Currently, consumers have unlimited opportunities, so the classical media that
used to promote advertising messages have lost their position (Tsai et al. 2017; Parobek et al. 2016;
Liu et al. 2018; Marsden and Chaney 2013; Vysekalová and Jiří 2007). In this context, the mobile
phone is becoming increasingly relied upon to create completely new communications and business
channels with high availability. Mobile phones are used in e-business, which can be defined as the
use of the internet to network and empower business processes, electronic commerce, organizational
communication, and collaboration within a company and with its customers, suppliers, and other
stakeholders (Combe 2006). The advantage is that customers, suppliers, and other stakeholders can be
placed anywhere in the world, in other time zones, possibly speaking different languages and paying
in different currencies. Currently, in this respect, mobile phones know no boundaries (Brzozowska
and Bubel 2015).
Mobile phones are considered to be one of the latest technological inventions that affect
a company’s marketing activities. Mobile phones—in particular smartphones—are used in the
promotion of goods and services (Bakopoulos et al. 2017; Wu and Stilwell 2017; Berman 2016;
Dovaliene et al. 2015; Lim et al. 2015; Öztaş 2015; Mirchev and Dicke 2011). Marketing activities
are provided through a ubiquitous network, to which consumers are constantly connected by using
a personal mobile device (Kaplan 2012). It can be multilateral or bilateral communication and
promotion between the company and its customers (Shankar and Balasubramanian 2009). Marketing
activities take place through wireless mobile technologies using services such as SMS (Short Message
Service), MMS (Multimedia Messaging Service), WAP (Wireless Application Protocol), third-generation
network, or other technology (Ližbetinová 2017; Persaud and Azhar 2012; Smutkupt et al. 2010;
Leppäniemi et al. 2006; Částek and Škapa 2005; Dickinger et al. 2004).
The high penetration of mobile phones shows that they have become a widespread mass media.
Thanks to the fact that almost all people now own a mobile phone, communication has become
simpler and faster. This enables mobile marketing to reach a much wider and more diverse audience.
Promotional campaigns via mobile devices are faster, easier, and cheaper to create and launch. Users can
save information to their device, which they can retrieve and use whenever necessary at anytime and
anywhere. Customer communication is personal, direct, targeted, and it has an immediate impact on
customers (Musová 2015). Because users have their mobile phones on their person almost at all times,
they receive messages right after they are sent. Therefore, user responses can be tracked in real-time.
In addition, after getting feedback, marketers can better understand and analyze user behavior and
thereby improve their products and services (Wilhite 2012; Michael and Salter 2006).
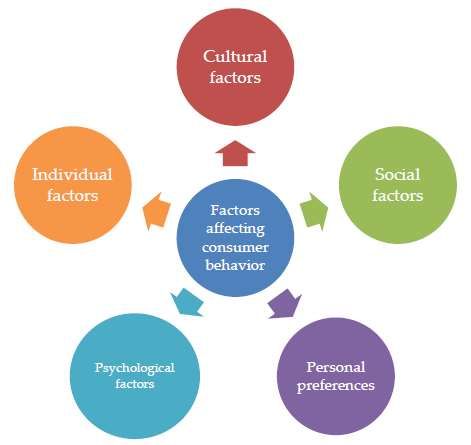
In order to maximize the efficiency of promotional campaigns, companies need to consider
different factors affecting consumer behavior, such as cultural (the society, culture, sub-culture,
and social class system in which a person grows and lives), social (the family, family life cycle,
and social class to which an individual belongs), personal (life cycle stage, occupation, financial and
economic conditions, lifestyle, personal situation, self-concept, and personality), psychological (internal
and external motivation, perceptions, beliefs, and attitudes), and individual (age, gender, education
level, income), as presented in Figure 1 (Abdolmaleki et al. 2018; SivaKumar and Gunasekaran 2017;
Anisimova 2016; He et al. 2016; Olšiaková 2003).Soc. Sci. 2018, 7, 163 3 of 15
Soc. Sci. 2018, 7, x FOR PEER REVIEW 3 of 15
1. Factors affecting consumer
Figure 1. behavior. Sources: (Abdolmaleki
consumer behavior. (Abdolmaleki et al. 2018; SivaKumar
SivaKumar and
Anisimova 2016;
Gunasekaran 2017; Anisimova 2016; He
He et
et al.
al. 2016;
2016; Olšiaková
Olšiaková 2003).
2003).
The key to to aa successful
successful marketing
marketing strategy
strategyisistototake takethese
thesefactors
factorsintointoaccount
accountbecause
because it
it is
is demanding
demanding to address
to address andandengageengage customers
customers correctly,
correctly, especially
especially if the iftarget
the target
customer customer group
group comes
comes from completely
from completely different different social classes,
social classes, and from and from
other other geographic
geographic locations locations
with diverse withbeliefs.
diverse It
beliefs. It is confirmed
is confirmed by international
by international literature
literature (i.e., Kim and (KimBaekand2018;
BaekBenda-Prokeinová
2018; Benda-Prokeinová et al.Lin
et al. 2017; 2017;
et
Lin et al. 2017;
al. 2017; Ližbetinová
Ližbetinová 2017; etMusa
2017; Musa et al.
al. 2017; Xu 2017; Xu et
et al. 2017; al. 2017; etGrencikova
Grencikova et al. 2016;
al. 2016; Knapcova and
Knapcova and Kucharcikova 2015; Venkatesh et al. 2012). The research of
Kucharcikova 2015; Venkatesh et al. 2012). The research of Kim et al. (2015) demonstrates that socio-Kim et al. (2015) demonstrates
that socio-demographic
demographic characteristics
characteristics (e.g., gender,
(e.g., gender, age, education,
age, education, and income)
and income) are thearemain
the main predictors
predictors for
for mobile
mobile applications.
applications. Studies
Studies byby Seneviratne
Seneviratne etet
al.al. (2014a,2014b)
(2014a, 2014b)investigated
investigatedthe therelationship
relationship between
between
mobile
mobile apps
appsand anduser
userattributes
attributessuch suchasasgender,
gender, religion,
religion,country,
country, andandlanguage.
language. TheThe results showed
results showedthat
user
that gender can becan
user gender predicted with anwith
be predicted accuracy of 70%, and
an accuracy mostand
of 70%, of their
most personality traits with an
of their personality accuracy
traits with
of
anover 90%. of
accuracy Gender differences
over 90%. Gender were also confirmed
differences were also by the researchby
confirmed of Unal et al. (2017).
the research Liuetetal.
of Unal al.(2017).
(2018)
highlight
Liu et al.gender
(2018)differences
highlight in the average
gender amountinofthe
differences money spentamount
average on onlineofshopping.
money spent Kim etonal.online
(2015)
further
shopping. foundKim that
et women
al. (2015)tend to make
further foundgreater
thatusewomenof e-commerce
tend to make applications.
greater use According to Kraft
of e-commerce
and Weber (2012),
applications. womentomeet
According Kraftlong-term
and Weber needs while
(2012), men look
women meettolong-term
meet immediate,
needs whileshort-term
men lookneeds.to
The
meetfindings
immediate, of Bazhan et al. (2018)
short-term needs.show that women
The findings have quite
of Bazhan et al.diverse
(2018) preferences.
show that women have quite
Understanding
diverse preferences. the individual socio-demographic characteristics of consumers allows
programmers
Understandingto understand preferences,socio-demographic
the individual and therefore to better customize mobile
characteristics of applications
consumers to their
allows
users (Unal et al.
programmers to 2017). This is preferences,
understand a key processand for properly
thereforedesigning
to better and targeting
customize advertisements
mobile applications (Hsuto
and Chen 2018; Tarute et al. 2017; Li and Zhang 2013; Venkatesh
their users (Unal et al. 2017). This is a key process for properly designing and targeting et al. 2012).
advertisements (Hsu and Chen 2018; Tarute et al. 2017; Li and Zhang 2013; Venkatesh et al. 2012).
2. Methodological Approach
2. Methodological Approach
In the context of e-business, the introduction of a new mobile player app store was investigated.
Different
In thestudies address
context of this the
e-business, issue (Li et al. of2017;
introduction a newBastinos et al.app
mobile player 2014;
storeMarmol et al. 2014;
was investigated.
Roman
Differentet studies
al. 2014;address
Ok et al. 2013;
this issue Pagano and
(Li et al. Maalej
2017; 2013).etOur
Bastinos research
al. 2014; Marmolis a et
joint
al. venture project
2014; Roman et
between a Slovak company and an Asian mobile game reseller. A blockchain was
al. 2014; Ok et al. 2013; Pagano and Maalej 2013). Our research is a joint venture project between a created between
2016
Slovakand 2017 to sell
company andany digitalmobile
an Asian contentgame
(video, audio,A
reseller. e-books, etc.).was
blockchain Compared
created to traditional
between 2016sales,
and
the advantage of this solution lies in the fact that intermediaries (i.e., third parties)
2017 to sell any digital content (video, audio, e-books, etc.). Compared to traditional sales, the are excluded
from the buying
advantage and selling
of this solution process,
lies in the factwhich leads to a reduction
that intermediaries ofparties)
(i.e., third commission costs that
are excluded from have
the
disproportionately
buying and selling increased
process,the which
final cost of digital
leads to acontent sold to
reduction ofend users.
commission costs that have
disproportionately increased the final cost of digital content sold to end users.
The research was conducted through the purchase of a research panel in 2017. When designing
a campaign for the Philippines, Thailand, and India, ethnic, religious, cultural, and linguisticSoc. Sci. 2018, 7, 163 4 of 15
The research was conducted through the purchase of a research panel in 2017. When designing
a campaign for the Philippines, Thailand, and India, ethnic, religious, cultural, and linguistic
differences were taken into account, as these are markets where consumers—in comparison to
European ones—have a completely different mentality, religion, and perception of reality, as well as
different habits. The aim of this research was to determine if it is possible—in terms of the sustainability
of the consumption of a marketing product—to launch a single campaign aimed at all markets using
the same content but different languages, or whether it is necessary to use a completely different
campaign and means of communication for each market.
Altogether, 317 respondents from the Philippines, Thailand, and India were addressed. In total,
287 questionnaires were used for statistical evaluation. The return rate was 90.54%. Table 1 shows the
sample size.
Table 1. Sample size.
Absolute Frequency Relative Frequency
Philippines 111 38.68
Country Thailand 76 26.48
India 100 34.84
Men 165 57.49
Gender
Women 122 42.51
60 0 0.00
The model presented in Figure 1 shows that there is a wide spectrum of different factors
affecting consumer behavior. The research was focused on the individual factors—mainly
socio-demographic characteristics.
At the level of significance α = 5%, in the context of inductive statistics through the Chi-square
goodness of fit test, the dependency between the two categorical variables was verified. Two scientific
hypotheses were tested:
Hypothesis 1 (H1). Is there a dependency between the socio-demographic characteristics of the respondents
(country, gender, and age) and site engagement of visitors?
Hypothesis 2 (H2). Is there a dependency between the socio-demographic characteristics of the respondents
(country, gender, and age) and the user experience?
If the calculated p-value was less than the chosen significance level (α = 5%), we rejected
the zero hypothesis H0 of the Chi-square test (Pacáková 2009; Rimarčík 2007) and support H1
(i.e., the statistically significant dependence between socio-demographic characteristics and the site
engagement, as well as user experience). The categorical data, at which statistically significant
dependency was confirmed, are presented in the table of residual abilities (observed/theoretical).
Looking at the table, it can be seen where dependency was most visible.
This project, aiming to introduce a new mobile app store built on blockchain technology, can serve
as a test for modern communication media, such as: advertising space directly in the app store;
web/banner campaigns; video campaigns; campaigns through affiliate programs; social networking
campaigns; sales promotion campaigns using influencers such as bloggers, YouTubers, and chatters in
new discussion forums; push notification campaigns; and SMS campaigns. The aim of the article is to
explore whether a single e-business marketing campaign can be launched in the selected Southeast
Asian countries.Soc. Sci. 2018, 7, 163 5 of 15
3. Results
In the first step, the H1 hypothesis (Is there a dependency between the socio-demographic
characteristics of the respondents (country, gender, and age) and visitor site engagement?) was tested.
Based on the contingency coefficient presented in Table 2, it can be concluded that there was
a slight dependency between the country and site engagements. Following the results in Table 2,
the Chi-square test presented no statistically significant dependency on the country’s relevance and
site engagement.
Table 2. Dependency between the country and site engagement.
Chi-Square df p
Pearson’s Chi-square 0.7918211 df = 2 p = 0.67307
Chi-square 0.8063621 df = 2 p = 0.66819
Phi 0.0525258
Contingency coefficient 0.0524535
Cramér’s V 0.0525258
In all countries analyzed, the site engagement was above 80% (Table 3).
Table 3. The number of responses based on the country and site engagement.
Did This Website Catch Your Attention?
Country
Yes No Row Sums
Philippines 91 20 111
Column sum 37.76% 43.48%
Row sum 81.98% 18.02%
Total 31.71% 6.97% 38.68%
Thailand 66 10 76
Column sum 27.39% 21.74%
Row sum 86.84% 13.16%
Total 23.00% 3.48% 26.48%
India 84 16 100
Column sum 34.85% 34.78%
Row sum 84.00% 16.00%
Total 29.27% 5.57% 34.84%
Total absolute frequency 241 46 287
Total relative frequency 83.97% 16.03% 100.00%
Table 4 presents the dependence between the country and site engagement. The contingency
coefficient (Table 5) presented a slight dependence between the gender and site engagements. Based on
the Chi-square test results (Table 5), there was no statistically significant dependence between gender
and the site engagement.
Table 4. Contingency table of dependence between the country and site engagement.
Did This Website Catch Your Attention?
Country
Yes No Row Sums
Philippines −2.20906 2.20906 0.00
Thailand 2.18118 −2.18118 0.00
India 0.02787 −0.02787 0.00
Total 0.00000 0.00000 0.00Soc. Sci. 2018, 7, 163 6 of 15
Table 5. Dependence between gender and site engagement.
Chi-Square df p
Pearson’s Chi-square 1.604175 df = 1 p = 0.20531
Chi-square 1.588636 df = 1 p = 0.20752
Phi −0.075423
Contingency coefficient −0.141547
Cramér’s V 0.0752089
From the point of view of gender, there was high site engagement, at the level of 80% (Table 6).
Table 7 presents the dependence between gender and site engagement. Table 8 presents the contingency
coefficient. It can be concluded that there was a slight dependence between age and site engagement.
Based on the Chi-square results (Table 8), there was no statistically significant dependence between
age and site engagement. Against the age group of respondents, there was a high interest in the site
engagement of over 79% (Table 9). Table 10 presents the dependence between age and site engagement.
As age increased, the level of interest grew.
Table 6. The number of responses based on gender and site engagement.
Did This Website Catch Your Attention?
Gender
Yes No Row Sums
Female 97 23 120
Column sum 40.93% 51.11%
Row sum 80.83% 19.17%
Total 34.40% 8.16% 42.55%
Male 140 22 162
Column sum 59.07% 48.89%
Row sum 86.42% 13.58%
Total 49.65% 7.80% 57.45%
Total absolute frequency 237 45 282
Total relative frequency 84.04% 15.96% 100.00%
Table 7. Contingency table of dependence between gender and site engagement.
Did This Website Catch Your Attention?
Gender
Yes No Row Sums
Female −3.85106 3.85106 0.00
Male 3.85106 −3.85106 0.00
Total 0.00000 0.00000 0.00
Table 8. Dependence between age and site engagement.
Chi-Square df p
Pearson’s Chi-square 5.084163 df = 2 p = 0.07870
Chi-square 5.225980 df = 2 p = 0.07332
Phi 0.1342719
Contingency coefficient 0.1330776
Cramér’s V 0.1342719Soc. Sci. 2018, 7, 163 7 of 15
Table 9. The number of responses based on age and site engagement.
Did This Website Catch Your Attention?
Age
Yes No Row Sums
18–29 120 31 151
Column sum 50.63% 68.89%
Row sum 79.47% 20.53%
Total 42.55% 10.99% 53.55%
30–44 102 12 114
Column sum 43.04% 26.67%
Row sum 89.47% 10.53%
Total 36.17% 4.26% 40.43%
45–60 15 2 17
Column sum 6.33% 4.44%
Row sum 88.24% 11.76%
Total 5.32% 0.71% 6.03%
Total absolute frequency 237 45 282
Total relative frequency 84.04% 15.96% 100.00%
Table 10. Contingency table of dependence between age and site engagement.
Did This Website Catch Your Attention?
Age
Yes No Row Sums
18–29 −6.90426 6.90426 0.00
30–44 6.19149 −6.19149 0.00
45–60 0.71277 −0.71277 0.00
Total 0.00000 0.00000 0.00
In the following step, the H2 hypothesis was tested. The dependence between the socio-demographic
characteristics of the respondents (country, gender, and age) and the user experience was tested.
Based on the contingency coefficient presented in Table 11, it can be concluded that there was
a stronger dependence between the country and user experience. Based on the Chi-square results
presented in Table 11, there was a statistically significant dependence between the country and the
user experience. Table 12 presents the user experience in the countries analyzed. Dependence between
the country and the user experience is presented in Table 13.
Table 11. Dependency between the country and the user experience.
Chi-Square df p
Pearson’s Chi-square 42.73984 df = 10 p = 0.00001
Chi-square 44.25333 df = 10 p = 0.00000
Phi 0.3859006
Contingency coefficient 0.3600234
Cramér’s V 0.2728730Soc. Sci. 2018, 7, 163 8 of 15
Table 12. The number of respondents’ responses based on the country and the user experience.
How Does This Web Design Make You Feel?
Country
Calm/Peaceful Intrigued Other Happy Confused/Uncertain Excited/Energized Row Sums
Philippines 51 18 8 10 15 9 111
Column sum 45.95% 66.67% 42.11% 14.93% 53.57% 25.71%
Row sum 45.95% 16.22% 7.21% 9.01% 13.51% 8.11%
Total 17.77% 6.27% 2.79% 3.48% 5.23% 3.14% 38.68%
Thailand 22 6 4 32 4 8 76
Column sum 19.82% 22.22% 21.05% 47.76% 14.29% 22.86%
Row sum 28.95% 7.89% 5.26% 42.11% 5.26% 10.53%
Total 7.67% 2.09% 1.39% 11.15% 1.39% 2.79% 26.48%
India 38 3 7 25 9 18 100
Column sum 34.23% 11.11% 36.84% 37.31% 32.14% 51.43%
Row sum 38.00% 3.00% 7.00% 25.00% 9.00% 18.00%
Total 13.24% 1.05% 2.44% 8.71% 3.14% 6.27% 34.84%
Total absolute
111 27 19 67 28 35 287
frequency
Total relative
38.68% 9.41% 6.62% 23.34% 9.76% 12.20% 100.00%
frequency
Table 13. Contingency table of dependence between the country and the user experience.
How Does This Web Design Make You Feel?
Country Confused/ Excited/ Row
Calm/Peaceful Intrigued Other Happy
Uncertain Energized Sums
Philippines 8.06969 7.55749 0.65157 −15.9129 4.17073 −4.53659 0.00
Thailand −7.39373 −1.14983 −1.03136 14.2578 −3.41463 −1.26829 0.00
India −0.67596 −6.40767 0.37979 1.6551 −0.75610 5.80488 0.00
Total 0.0000 0.0000 0.0000 0.0000 0.0000 0.0000 0.00
A slight dependence between age and the user experience based on the results of the contingency
coefficient is presented in Table 8. Based on the results presented in Table 14 and the Chi-square
results, it can be stated that there was no statistically significant dependency between age and the
user experience.
Table 14. Dependency between the age and the user experience.
Chi-Square df p
Pearson’s Chi-square 13.34995 df = 10 p = 0.20476
Chi-square 13.21551 df = 10 p = 0.21187
Phi 0.2175781
Contingency coefficient 0.2126040
Cramér’s V 0.1538510
The user experience according to the age group analyzed is presented in Table 15. It can be stated
that for most respondents, the user experience was characterized as calm/peaceful. Table 16 presents
the dependence between age and the user experience.Soc. Sci. 2018, 7, 163 9 of 15
Table 15. The number of responses based on age and the user experience.
How Does This Web Design Make You Feel?
Age
Calm/Peaceful Intrigued Other
18–29 67 13 10
Column sum 62.62% 48.15% 52.63%
Row sum 44.37% 8.61% 6.62%
Total 23.76% 4.61% 3.55%
30–44 33 13 7
Column sum 30.84% 48.15% 36.84%
Row sum 28.95% 11.40% 6.14%
Total 11.70% 4.61% 2.48%
45–60 7 1 2
Column sum 6.54% 3.70% 10.53%
Row sum 41.18% 5.88% 11.76%
Total 2.48% 0.35% 0.71%
Total absolute frequency 107 27 19
Total relative frequency 37.94% 9.57% 6.74%
Table 16. Contingency table of dependence between age and the user experience.
How Does This Web Design Make You Feel?
Age Calm/ Confused/ Excited/ Row
Intrigued Other Happy
Peaceful Uncertain Energized Sums
30–44 −10.2553 2.08511 −0.680851 9.31915 0.68085 −1.14894 0.00
45–60 0.5496 −0.62766 0.854610 −0.97872 1.31206 −1.10993 0.00
Total 0.0000 0.0000 0.0000 0.0000 0.0000 0.0000 0.00
The results of the contingency coefficient presented in Table 17 indicate a slight dependence
between gender and the user experience. No statistically significant dependence between gender and
the user experience was confirmed by the Chi-square results (Table 17).
Table 17. Dependence between gender and the user experience.
Chi-Square df p
Pearson’s Chi-square 4.359730 df = 5 p = 0.49887
Chi-square 4.383676 df = 5 p = 0.49560
Phi 0.1243384
Contingency coefficient 0.1233883
Cramér’s V 0.1243384
Table 18 presents the user experience according to gender. For most respondents, the user
experience was characterized as calm/peaceful. Gender dependency and the user experience is
presented in Table 19.Soc. Sci. 2018, 7, 163 10 of 15
Table 18. The number of responses based on gender and site engagement.
How Does This Web Design Make You Feel?
Gender Calm/ Confused/ Excited/ Row
Intrigued Other Happy
Peaceful Uncertain Energized Sums
Female 45 15 8 27 14 11 120
Column sum 42.06% 55.56% 42.11% 40.91% 50.00% 31.43%
Row sum 37.50% 12.50% 6.67% 22.50% 11,67% 9.17%
Total 15.96% 5.32% 2.84% 9.57% 4.96% 3.90% 42.55%
Male 62 12 11 39 14 24 162
Column sum 57.94% 44.44% 57.89% 59.09% 50.00% 68.57%
Row sum 38.27% 7.41% 6.79% 24.07% 8.64% 14.81%
Total 21.99% 4.26% 3.90% 13.83% 4.96% 8.51% 57.45%
Total absolute frequency 107 27 19 66 28 35 282
Total relative frequency 37.94% 9.57% 6.74% 23.40% 9.93% 12.41% 100.00%
Table 19. Contingency table of gender dependency and the user experience.
How Does This Web Design Make You Feel?
Gender Calm/ Confused/ Excited/ Row
Intrigued Other Happy
Peaceful Uncertain Energized Sums
Female −0.531915 3.51064 −0.085106 −1.08511 2.08511 −3.89362 0.00
Male 0.531915 −3.51064 0.085106 1.08511 −2.08511 3.89362 0.00
Total 0.000000 0.00000 0.000000 0.00000 0.00000 0.00000 0.00
4. Discussion and Conclusions
Increasing customer diversity is exerting pressure on businesses to keep track of current trends,
adjust to them, and reach a strong market position with comprehensive marketing activities (Van
Kerrebroeck et al. 2017; Krasnova et al. 2017; Gejdoš and Danihelová 2015; Ďurišová et al. 2015;
Gubíniová and Bartáková 2014; Pyatnitskaya 2013; Cambal et al. 2012; Strišš 2008; Vaštíková 2008).
Old methods of marketing communications are not bad, but if a company wants to be a step ahead of
its competition, and if it wants to be more effective in addressing increasingly demanding customers,
it must adapt to these trends and include them in its processes. The same view is shared by the
research of Chernova et al. (2018). The authors argue that in order to increase the effectiveness of
commercial activities, PR and marketing specialists have to use new technologies, marketing tools,
and non-standard approaches to mass communications.
Due to the opportunities brought about by the digital revolution, customer behavior has
changed significantly. Customers are less tolerant, less loyal, more informed, and they are becoming
multichannel users (Urbancova et al. 2017; Ližbetín et al. 2016; Poliacikova and Vaclavikova 2016;
Fu et al. 2015; Buehlmann et al. 2013). Therefore, in an effort to secure and maintain a strong
competitive position, companies are looking for new ways to impress the customer and raise awareness
of the brand and its products (Javorčíková 2017; Korauš et al. 2018; Mayett-Moreno et al. 2018;
Ďuračík et al. 2017; Gamache et al. 2017; Lee 2017; Stacho et al. 2015; Makhnush and Oliynyk 2011).
In our research, we explored the introduction of a new mobile player app store. The research was
conducted in 2017 by purchasing a research panel. With a sample of 287 respondents, we analyzed
whether a single marketing campaign could be conducted for selected countries in Southeast Asia.
Based on the results of Chi-square tests, we could define statistically significant dependencies between
the socio-demographic characteristics of respondents (country, gender, and age) and the selected
analyzed factors.
In the H1 research hypothesis as to whether there is a dependency between the socio-demographic
characteristics of the respondents (country, gender, and age) and the site engagement, it can be
concluded that—based on the results of the Chi-square test—there was no statistically significantSoc. Sci. 2018, 7, 163 11 of 15
dependency between the country and the site engagement, there was no statistically significant
dependency between age and the site engagement, and there was no statistically significant
dependency between gender and the site engagement. This analysis did not confirm H1.
In the H1 hypothesis, as to whether there is a dependency between the socio-demographic
characteristics of the respondents (country, gender, and age) and the user experience, it can be
concluded that—based on the results of the Chi-square tests—there was a statistically significant
dependency between the country and the user experience, there was no statistically significant
dependency between age and the user experience, and there was no statistically significant relationship
between gender and the user experience. In our analysis, we confirmed H2 in only one of
three demographic characteristics, and in two the input assumption was not confirmed. Thus,
H2 was rejected.
Looking at the analyses and practical benefits of the research, it is clear that in the field of
e-business in the analyzed countries it is possible to carry out marketing campaigns uniformly, because
there was no statistically significant dependency between the analyzed characteristics and the selected
results of the marketing survey. In the field of e-business, mobile marketing has great potential. If a
company uses the right combination of marketing communication tools, the final effect of advertising
can be multiplied, leading to an increased demand for products and the sustainability of the product
consumption (Wilhite 2012; Michael and Salter 2006).
Future research can be provided in comparing European and Asian markets, as well as other
markets around the world. Due to the globalization of the world market, it is possible to analyze the
similarities between marketing campaigns in different parts of the world. Research is a rather limited
by necessary method by which to obtain additional data from markets in various other countries.
Author Contributions: Conceptualization, P.S., M.V., J.M., S.L., M.H. and D.W.; Methodology, J.M., M.H., S.L.;
Software, J.M. and M.H.; Validation, P.S. and M.H.; Formal Analysis, J.M., M.H. and S.L.; Investigation, J.M. and
M.H.; Resources, P.S., M.V., J.M., S.L., M.H. and D.W.; Data Curation, J.M. and M.H.; Writing-Original Draft
Preparation, P.S., M.V., J.M., S.L., M.H. and D.W.; Writing-Review & Editing, P.S., M.V., J.M., S.L., M.H. and
D.W.; Visualization, M.H. and S.L.; Supervision, P.S., M.V., M.H.; Project Administration, M.H. and S.L.; Funding
Acquisition, M.H. and S.L.
Funding: This research was funded by VEGA grant number 1/0024/17, VEGA grant number 1/0116/18 and
APVV grant number 16-0297.
Conflicts of Interest: The authors declare no conflicts of interest.
References
Abdolmaleki, Hossein, Zahra Sadat Mirzazadeh, and Ebrahim Alidoust Ghahfarokhhi. 2018. Identify and
prioritise factors affecting sports consumer behaviour in Iran. International Journal of Sport Management and
Marketing 18: 42–62. [CrossRef]
Anisimova, Tatiana. 2016. Integrating Multiple Factors Affecting Consumer Behavior Toward Organic Foods: The
Role of Healthism, Hedonism, and Trust in Consumer Purchase Intentions of Organic Foods. Journal of Food
Products Marketing 22: 809–23. [CrossRef]
Aretoulis, Georgios. 2018. Gender based perception of successful construction of project managers’ attributes.
Social Sciences 7: 112. [CrossRef]
Bakopoulos, Vassilis, John Baronello, and Rex Briggs. 2017. How brands can make smarter decisions in mobile
marketing: Strategies for improved media-mix effectiveness and questions for future research. Journal of
Advertising Research 57: 447–61. [CrossRef]
Bastinos, Ana Sasa, Peter Haase, Georg Heppner, Stefan Zander, and Nadia Ahmed. 2014. ReApp store—A
semantic AppStore for applications in the robotics domain. Paper presented at the Industry Track at the
International Semantic Web Conference 2014, Riva del Garda, Italy, October 19–23.
Bazhan, Marjan, Naser Kalantari, Nastaran Keshavarz-Mohammadi, Hedayat Hosseini, Hassan Eini-Zinab, and
Hamid Alavi-Majd. 2018. Applying social marketing mix to identify consumers’ preferences towards
functional dairy products in Iran. Nutrition and Food Science 48: 45–60. [CrossRef]Soc. Sci. 2018, 7, 163 12 of 15
Benda-Prokeinová, Renata, Kamil Dobeš, Ladislav Mura, and Ján Buleca. 2017. Engel’s Approach as a tool for
estimating consumer behaviour. E & M Ekonomie a Management 20: 15–29. [CrossRef]
Berman, Barry. 2016. Planning and implementing effective mobile marketing programs. Business Horizons 59:
431–39. [CrossRef]
Brzozowska, Anna, and Dagmara Bubel. 2015. E-business as a new trend in the economy. Procedia Computer
Science 65: 1095–104. [CrossRef]
Buehlmann, Urs, Matt Bumgardner, and Michael Sperber. 2013. How small firms contrast with large firms
regarding perceptions, practices, and needs in the U.S. secondary woodworking industry. BioResources 8:
2669–80. [CrossRef]
Cambal, Milos, Dagmar Caganova, and Jana Sujanova. 2012. The industrial enterprise performance increase
through the competency model application. Paper presented at the 4th European Conference on Intellectual
Capital (ECIC), Helsinki, Finland, April 23–24.
Částek, Ondrej, and Radoslav Škapa. 2005. Faktory Ovlivňující Osvojení Mobilních Služeb: Mezikulturní Porovnání,
Vývojové Tendence Podniků. Brno: Masarykova univerzita v Brně.
Chernova, Dana V., Anastasia N. Skvortsova, Ekaterina V. Loginova, Sergey S. Sariev, and Anastasia Y. Polshinskaya.
2018. Social networks as a tool of marketing communications in the commodity and service market. Paper
presented at 5th National scientific and practical conference on Perspectives on the use of New Information
and Communication Technology (ICT) in the Modern Economy, Pyatigorsk, Russian Federation, February 1.
Chu, Hai-Cheng, Der-Jiunn Deng, and Jong Hyuk Park. 2011. Live data mining concerning social networking
forensics based on a Facebook session through aggregation of social data. IEEE Journal on Selected Areas in
Communications 29: 1368–76. [CrossRef]
Čierna, Helena, Erika Sujová, Patrycja Habek,
˛ Elena Horská, and Zuzana Kapsdorferová. 2017. Learning
organization at higher education institutions in the EU: Proposal for implementing philosophy of learning
organization—Results from research. Quality and Quantity 51: 1305–20. [CrossRef]
Combe, Colin. 2006. Introduction to E-Business. Burlington: Elsevier.
Deng, Der-Jiunn, Rung-Shiang Cheng, Heng-Jia Chang, Hui-Tang Lin, and Ruay-Shiung Chang. 2009.
A cross-layer congestion and contention window control scheme for TCP performance improvement in
wireless LANs. Telecommunication Systems 42: 17–27. [CrossRef]
Dickinger, Astrid, Parissa Haghirian, Jamie Murphy, and Arno Scharl. 2004. An investigation and conceptual
model of SMS marketing. Paper presented at the Hawaii International Conference on System Sciences,
January 5–8.
Dovaliene, Aiste, Akvile Masiulyte, and Zaneta Piligrimiene. 2015. The relations between customer engagement,
perceived value and satisfaction: The case of mobile applications. Procedia-Social and Behavioral Sciences 213:
659–64. [CrossRef]
Ďuračík, Michal, Emil Kršák, and Patrik Hrkút. 2017. Current Trends in Source Code Analysis, Plagiarism
Detection and Issues of Analysis Big Datasets. Procedia Engineering 192: 136–41. [CrossRef]
Ďurišová, Mária, Lukáš Falát, and Eva Malichová. 2015. The influence of business intelligence on digital marketing
and the economic situation of the enterprise. Paper presented at the International Scientific Conference
Marketing Identity: Digital Life, Smolenice, Slovakia, November 10–11.
Fu, Tao, Chenguang Li, Liping Guo, and Yanni Wang. 2015. How we view competitions between the converging
Internet social platforms: Does higher user number mean the final victory? International Journal of Modern
Physics C 26. [CrossRef]
Gamache, Shelby L., Omar Espinoza, and Matthew Aro. 2017. Professional consumer perceptions about thermally
modified wood. BioResources 12: 9487–501. [CrossRef]
Gejdoš, Miloš, and Zuzana Danihelová. 2015. Valuation and timber market in the Slovak Republic. Procedia
Economics and Finance 34: 697–703. [CrossRef]
Grencikova, Adriana, Jana Spankova, and Marcel Kordos. 2016. Entry of a new generation “millenians” on the
labor market. Paper presented at the 3rd International Multidisciplinary Scientific Conferences on Social
Sciences and Arts, SGEM 2016, Albena, Bulgaria, August 24–31.
Gubíniová, Katarína, and Gabriela Pajtinková Bartáková. 2014. Customer experience management as a new source
of competitive advantage for companies. Paper presented at the 5th International Scientific Conference on
Trade, International Business and Tourism: Application of Knowledge in Process of Business Dynamization
in Central Europe, Mojmirovce, Slovakia, October 16–17.Soc. Sci. 2018, 7, 163 13 of 15
He, Ai-zhong, Tom Cai, Tian-xiang Deng, and Xue Li. 2016. Factors affecting non-green consumer behaviour: An
exploratory study among Chinese consumers. International Journal of Consumer Studies 40: 345–56. [CrossRef]
Hiadlovský, Vladimír, Ivana Rybovičová, and Miroslava Vinczeová. 2016. Importance of liquidity analysis in the
process of financial management of companies operating in the tourism sector in Slovakia: An empirical
study. International Journal for Quality Research 10: 799–812. [CrossRef]
Hockicko, Peter, L’uboš Krišt’ák, and Miroslav Němec. 2015. Development of students’ conceptual thinking by
means of video analysis and interactive simulations at technical universities. European Journal of Engineering
Education 40: 145–66. [CrossRef]
Hsu, Chia-Lin, and Mu-Chen Chen. 2018. How gamification marketing activities motivate desirable consumer
behaviors: Focusing on the role of brand love. Computers in Human Behavior 88: 121–33. [CrossRef]
Jaroslav, Dado, Janka Táborecká Petrovicová, Riznic Dejan, and Tamara Rajic. 2013. Linking service quality and
satisfaction to behavioural intentions in higher education setting. Ekonomicky casopis 61: 578–96.
Javorčíková, Jana. 2017. Motivation, engagement and achievement in the EFL literature class: 21st century
perspectives. Teaching literature for the 21st Century. Available online: https://slovakedu.com/_files/
200004066-6ce696de0f/TL21c-Javor%C4%8D%C3%ADkov%C3%A1.pdf (accessed on 2 July 2018).
Kaplan, Andreas M. 2012. If you love something, let it go mobile: Mobile marketing and mobile social media 4x4.
Business Horizons 55: 129–39. [CrossRef]
Kim, Seeun, and Tae Hyun Baek. 2018. Examining the antecedents and consequences of mobile app engagement.
Telematics and Informatics 35: 148–58. [CrossRef]
Kim, Yeolib, Daniel A. Briley, and Melissa G. Ocepek. 2015. Differential innovation of smartphone and application
use by sociodemographics and personality. Computers in Human Behavior 44: 141–47. [CrossRef]
Knapcova, Dominika, and Alžbeta Kucharcikova. 2015. The status of women on the regional labour market. Paper
presented at International Scientific Conference on Knowledge for Market Use—Women in Business in the
Past and Present, Olomouc, Czech Republic, September 10–11.
Korauš, Antonín, Michal Mazák, and Ján Dobrovič. 2018. Quantitative analysis of the competitiveness of Benelux
countries. Entrepreneurship and Sustainability Issues 5: 1069–83. [CrossRef]
Kraft, Heather, and J. Michael Weber. 2012. A look at gender differences and marketing implications. International
Journal of Business and Social Science 3: 247–53.
Krasnova, Hanna, Natasha F. Veltri, Nicole Eling, and Peter Buxmann. 2017. Why men and women continue to
use social networking sites: The role of gender differences. Journal of Strategic Information Systems 26: 261–84.
[CrossRef]
Kuzman, Manja, Darko Motik, Kristina Bičanić, Richard Vlosky, and Leon Oblak. 2012. A comparative analysis of
consumer attitudes on the use of wood products in Slovenia and Croatia. Drvna Idustrija: Znanstveni časopis
za pitanja drvne tehnologije 63: 71–79. [CrossRef]
Lee, You Kyung. 2017. A comparative study of green purchase intention between Korean and Chinese Consumers:
The moderating role of collectivism. Sustainability 9: 1930. [CrossRef]
Leppäniemi, Matti, Heikki Karjaluoto, Jaakko Sinisalo, and Jari Salo. 2006. Integrated marketing communications
in mobile context. In International Advertising and Communication. Wiesbaden: DUV, pp. 397–415.
Li, Chong Guo, and Ying Angela Zhang. 2013. CAS Simulation Study on the Cluster Innovation Network Structure
Influences Innovative Capacity. Paper presented at the 2nd International Conference on Social Science and
Education, Hong Kong, China, December 24–25.
Li, Lisha, Liang Ma, Pei-Luen Patrick Rau, and Qin Gao. 2017. A pilot study of mining the differences in patterns of
customer review text between US and China AppStore. Lecture Notes in Computer Science (including subseries
Lecture Notes in Artificial Intelligence and Lecture Notes in Bioinformatics) 10281: 693–702. [CrossRef]
Lim, Soo Ling, Peter Bentley, Natalie Kanakam, Fuyuki Ishikawa, and Shinichi Honiden. 2015. Investigating
country differences in mobile app user behavior and challenges for software engineering. IEEE Transactions
on Software Engineering 41: 40–64. [CrossRef]
Lin, Xiaolin, Mauricio Featherman, and Saonee Sarker. 2017. Understanding factors affecting users’ social
networking site continuance: A gender difference perspective. Information & Management 54: 383–95.
[CrossRef]
Liu, Xuanzhe, Huoran Li, Xuan Lu, Tao Xie, Qiaozhu Mei, Feng Feng, and Hong Mei. 2018. Understanding
diverse usage patterns from large-scale appstore-service profiles. IEEE Transactions on Software Engineering
44: 384–411. [CrossRef]Soc. Sci. 2018, 7, 163 14 of 15
Ližbetín, Ján, Petr Vejs, Zdeněk Caha, Lenka Ližbetinová, and Philip Michalk. 2016. The possibilities of dynamic
shipment weighing in rail freight transport. Communications - Scientific Letters of the University of Zilina 18:
113–17.
Ližbetinová, Lenka. 2017. Attitude college students in the South Bohemian region to opportunities of increasing
employability in the labour market. Paper presented at the 20th International Colloquium on Regional
Sciences, Kurdejov, Czech Republic, June 14–16.
Ližbetinová, Lenka. 2017. Clusters of Czech consumers with focus on domestic brands. Paper presented at the
29th International-Business-Information-Management-Association Conference, Vienna, Austria, May 3–4.
Makhnush, Svetlana Mikhailovna, and Oksana Victorivna Oliynyk. 2011. Rebranding as a way of company
long-lasting existence in the market. Marketing and Management of Innovations 3: 143–50.
Malichova, Eva, Mária Durisova, and Alžbeta Kucharcikova. 2016. The influence of selected tools of economic
policy on managerial decision making on investments. Paper presented at 27th International Business
Information Management Association Conference, Milan, Italy, May 4–5.
Marmol, Felix Gomez, Gregor Rozinaj, Sebastian Schumann, Ondrej Labaj, and Juraj Kacur. 2014. Smart AppStore:
Expanding the frontiers of smartphone ecosystems. Computer 6: 42–47. [CrossRef]
Marsden, Paul, and Paul Chaney. 2013. The Social Commerce Handbook: 20 Secrets for Turning Social Media into Social
Sales. New York City: McGraw Hill Professional.
Mayett-Moreno, Yesica, Jennie Sheerin Popp, Mauricio Sabogal-Salamanca, Sandra Rodríguez-Piñeros,
Edith Salomé-Castañeda, and Daniel Alberto Flores-Alonso. 2018. Consumers’ and retailers’ attitudes
towards a Mexican native species of Aztec lily as an ornamental plant. Sustainability 10: 224. [CrossRef]
Metke, Jozef. 2006. M-Marketing Mobilný Telefón Ako Nový Nástroj Marketing. Bratislava: Univerzita Komenského
v Bratislave.
Michael, Alex, and Ben Salter. 2006. Mobile Marketing: Achieving Competitive Advantage Through Wireless Technology.
Amsterdam: Butterworth-Heinemann.
Mirchev, Angel, and Philipp Dicke. 2011. Mobile marketing and the usage of a smartphone. Marketing and
Management of Innovations 4: 50–54.
Musa, Hussam, Lenka Debnárová, Zdenka Musová, and Peter Krištofík. 2017. Gender equality and corporate
governance in Slovakia. E & M Ekonomie a Management 20: 98–110. [CrossRef]
Musová, Zdenka. 2015. Consumer attitudes to cause related marketing in Slovakia. Acta Oeconomica Universitatis
Selye 4: 93–105.
Ok, Changsoo, H.-Y. Kang, and Bohyun Kim. 2013. A new collaborative filtering-based recommender system for
manufacturing appstore: Which applications would be useful to your business? Lecture Notes in Mechanical
Engineering 7: 737–47. [CrossRef]
Olšiaková, Miriam. 2003. Poznávanie zákazníka a faktorov ovplyvňujúcich nákupné rozhodnutie. Marketing a
obchod 2003: Príležitosti a riziká jednotného Európskeho trhu, 157–60.
Öztaş, Y. Burçak Boydak. 2015. The increasing importance of mobile marketing in the light of the improvement
of mobile phones, confronted problems encountered in practice, solution offers and expectations.
Procedia—Social and Behavioral Sciences 195: 1066–73. [CrossRef]
Pacáková, Viera. 2009. Štatistické Metódy Pre Ekonómov. Bratislava: Ekonómia.
Pagano, Dennis, and Walid Maalej. 2013. User feedback in the appstore: An empirical study. Paper presented at
the 21st IEEE International Requirements Engineering Conference, Rio de Janeiro, Brazil, July 15–19.
Parobek, Ján, Hubert Palus, Erika Loucanová, Martina Kalamárová, and Branko Glavonic. 2016. Competitiveness
of central European countries in the EU forest products market with the emphasis on Slovakia. Acta Facultatis
Xylogiae Zvolen 58: 125–36.
Persaud, Ajax, and Irfan Azhar. 2012. Innovative mobile marketing via smartphones: Are consumers ready?
Marketing Intelligence and Planning 30: 418–43. [CrossRef]
Poliacikova, Eva, and Dáša Vaclavikova. 2016. Participation of Slovak products in consumer´s perception.
Marketing Identity: Brands We Love, 244–54.
Pyatnitskaya, Galina Tezievna. 2013. Innovative development of organizations: Integral parts and influencing
factors. Marketing and Management of Innovations 4: 76–91.
Rimarčík, Marián. 2007. Štatistika Pre Prax. SR: Marián Rimarčík.Soc. Sci. 2018, 7, 163 15 of 15
Roman, Dumitru, Claudia Daniela Pop, Roxana I. Roman, Bjørn Magnus Mathisen, Leendert Wienhofen,
Brian Elvesæter, and Arne J. Berre. 2014. The linked data AppStore: A software-as-a-service platform
prototype for data integration on the web. Paper presented at the 2nd International Conference on
Mining Intelligence and Knowledge Exploration, Cork, Ireland, December 10–12. Available online:
https://link.springer.com/chapter/10.1007/978-3-319-13817-6_37 (accessed on 15 September 2018).
Seneviratne, Suranga, Aruna Seneviratne, Prasant Mohapatra, and Anirban Mahanti. 2014a. Predicting user traits
from a snapshot of apps installed on a smartphone. ACM SIGMOBILE Mobile Computing and Communications
Review 18: 1–8. [CrossRef]
Seneviratne, Suranga, Aruna Seneviratne, Prasant Mohapatra, and Anirban Mahanti. 2014b. Your installed apps
reveal your gender and more! Paper presented at ACM MobiCom Workshop on Security and Privacy in
Mobile Environments (SPME ’14), Maui, Hawaii, USA, September 11.
Shankar, Venkatesh, and Sridhar Balasubramanian. 2009. Mobile marketing: A synthesis and prognosis. Journal of
Interactive Marketing 23: 118–29. [CrossRef]
SivaKumar, ArunKumar, and Abirami Gunasekaran. 2017. An Empirical Study on the Factors Affecting Online
Shopping Behavior of Millennial Consumers. Journal of Internet Commerce 16: 219–30. [CrossRef]
Smutkupt, Phumisak, Donyaprueth Krairit, and Vatcharaporn Esichaikul. 2010. Mobile marketing: Implications
for marketing strategies. International Journal for Marketing Strategies 5: 126–39.
Stacho, Zdenko, Katarína Stachová, and Monika Hudáková. 2015. Approach of companies to customers as
suitable source of incentive to innovate. Procedia Economics and Finance 34: 11–18. [CrossRef]
Strišš, Jozef. 2008. Aktuálne marketingové trendy v teórií a praxi. Žilina: Žilinská univerzita.
Tarute, Asta, Shahrokh Nikou, and Rimantas Gatautis. 2017. Mobile application driven consumer engagement.
Telematics and Informatics 34: 145–56. [CrossRef]
Tokarčíková, Emese, and Alžbeta Kucharčíková. 2015. Diffusion of innovation: The case of the Slovak mobile
communication market. International Journal of Innovation and Learning 17: 359–70. [CrossRef]
Tsai, Yao-Te, Shu-Ching Wang, Kuo-Qin Yan, and Chih-Ming Chang. 2017. Precise positioning of marketing
and behaviour intentions of location-based mobile commerce in the Internet of things. Symmetry 9: 139.
[CrossRef]
Unal, Perin, Tugba Taskaya Temizel, and P. Erhan Eren. 2017. What installed mobile applications tell about their
owners and how they affect users’ download behavior. Telemetrics and Informatics 34: 1153–65. [CrossRef]
Urbancova, Hana, Richter Petr, Kucirkova Lenka, and Jarkovska Martina. 2017. Employer branding
in the agricultural sector: Making a company attractive for the potential employees. Agricultural
Economics-Zemedelska Ekonomika 63: 217–27. [CrossRef]
Van Kerrebroeck, Helena, Malaika Brengman, and Kim Willems. 2017. When brands come to life: Experimental
research on the vividness effect of virtual reality in transformational marketing communications.
Virtual Reality 21: 177–91. [CrossRef]
Vaštíková, Miroslava. 2008. Marketing Služeb: Efektivně a Moderně. Praha: Grada Publishing.
Venkatesh, Viswanath, James Y. L. Thong, and Xin Xu. 2012. Consumer acceptance and use of information
technology: Extending the unified theory of acceptance and use of technology. MIS Quarterly 36: 157–78.
Vysekalová, Jitka, and Mikeš Jiří. 2007. Reklama—Jak Delat Reklamu. Praha: Grada Publishing.
Waheed, Abdul, and Jianhua Yang. 2017. The effect of mobile marketing and email marketing on exploratory
information seeking (EIS) behavior of the consumers: Communication through wireless technologies.
International Journal of Enterprise Information Systems 13: 76–89. [CrossRef]
Wilhite, Mary E. 2012. The Mobile Marketing Bible. USA.
Wu, Linwan, and Matthew A. Stilwell. 2017. Exploring the marketing potential of location-based mobile games.
Journal of Research in Interactive Marketing 12: 22–44. [CrossRef]
Xu, Yan, Yougui Wang, Xiaobo Tao, and Lenka Ližbetinová. 2017. Evidence of Chinese income dynamics and its
effects on income scaling law. Physsica A-Statistical Mechanics and its Applications 487: 143–52. [CrossRef]
Zaborova, Elena, Irina Glazkova, and Tatiana Markova. 2017. Distance learning: Students’ perspective. Sociological
Studies 2: 131–39.
© 2018 by the authors. Licensee MDPI, Basel, Switzerland. This article is an open access
article distributed under the terms and conditions of the Creative Commons Attribution
(CC BY) license (http://creativecommons.org/licenses/by/4.0/).You can also read