2018 Merchant Gift Card E-Commerce Evaluation
←
→
Page content transcription
If your browser does not render page correctly, please read the page content below
2018 Merchant Gift Card
E-Commerce Evaluation

                          sponsored by

        a service of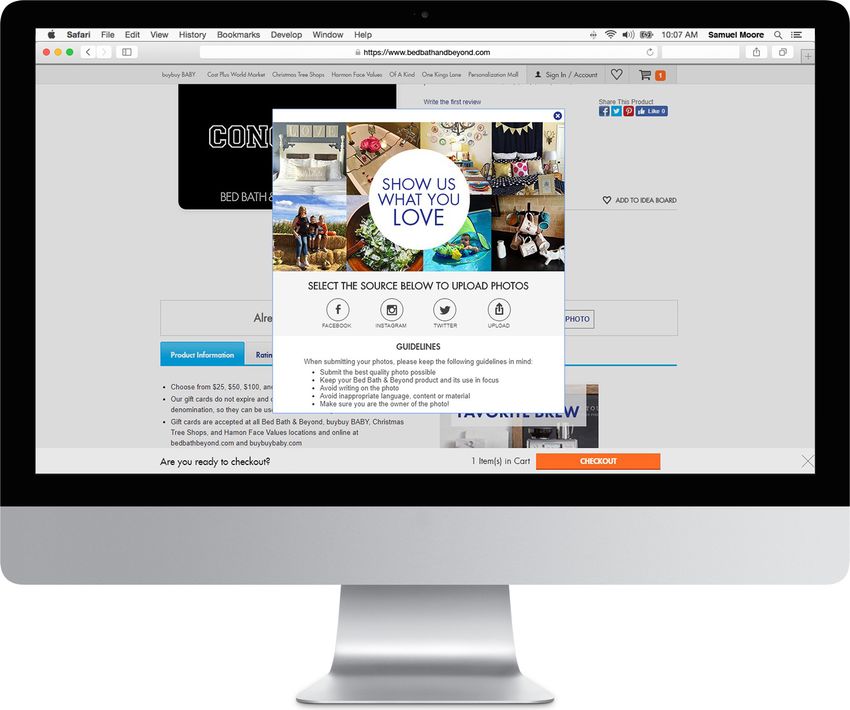
Table of Contents

    Introduction...................................................................................................................................................3

    Methodology................................................................................................................................................ 4

    Findings and Results................................................................................................................................. 6

    2018 Gift Card Trends............................................................................................................................. 10

    Common Mistakes Being Made...........................................................................................................21

    Key Takeaways for Merchants.............................................................................................................26

    Conclusion..................................................................................................................................................29

    Appendix A: Ranking of Retailers by Overall Score...................................................................30

    Appendix B: Rankings by Retail Product Category.................................................................... 33

    Appendix C: Methodology Addendum............................................................................................ 35

    About NAPCO Research....................................................................................................................... 37

    About the Sponsor.................................................................................................................................. 38

2
                                                        a service of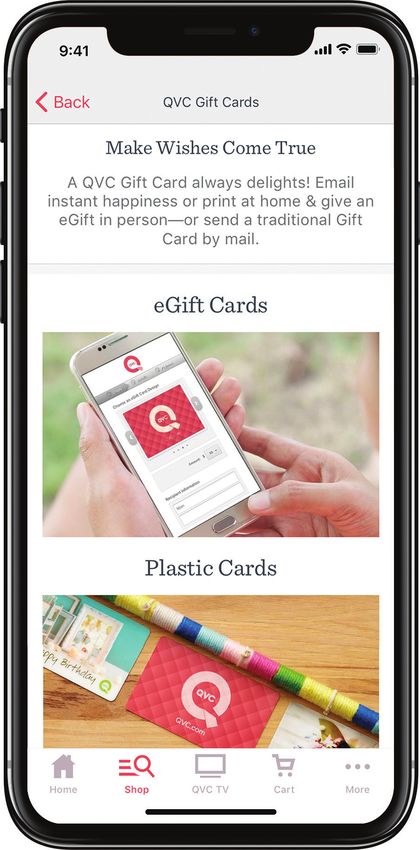
2018 Merchant Gift Card
    E-Commerce Evaluation

    INTRODUCTION
    High consumer demand for gift cards has made them a business priority for retailers.
    Consider that gift cards have been the most requested holiday gift for the last 12 years in a
    row, according to the National Retail Federation’s (NRF) annual consumer holiday survey with
    Prosper Insights & Analytics1. With the NRF forecasting this year’s total holiday sales spending
    to increase between 4.3 and 4.8 percent over 2017 for a total of $717.45 billion to $720.89
    billion in sales2, the financial benefit an optimized gift card program can’t be overstated.

    Consumers now expect to be able to buy gift cards — physical and digital — from merchants
    across multiple channels (in-store, online, mobile websites and apps). It’s the retailers and
    brands that can provide the best customer experience in each of those channels that will be
    successful selling gift cards.

    This is NAPCO Research’s second annual Merchant Gift Card E-Commerce Evaluation, offering
    merchants the opportunity to compare results to last year's to see the progress (or lack
    thereof) made in e-commerce sales channels, as well as identify areas for potential growth. In
    addition, this research serves as a benchmark for retailers to see how their e-commerce gift
    card programs measure up against other brands, both within their own product categories as
    well as across the greater retail industry at large — to determine strengths, weaknesses, and
    potential areas for improvement and growth. The results are indicative of a larger industry
    trend toward valuing gift cards, both physical and digital, as a revenue-generating product.

    ANALYSIS OF THE GIFT CARD PURCHASE AND RECIPIENT
    EXPERIENCE
    To assess the merchant gift card e-commerce landscape, NAPCO Research undertook a
    comprehensive review of the state of merchant gift card e-commerce offerings. The cross-
    platform assessment evaluated brands on more than 100 unique criteria, including key
    components such as the online consumer purchase and recipient experience of both digital
    and physical cards (e.g., payment and delivery options, ease of discoverability); business-to-
    business (B-to-B) e-commerce offerings; personalization options; and the use of gift cards for
    marketing initiatives. In addition to these criteria, which were included in last year’s evaluation,
    we introduced new criteria in the 2018 research, including scoring a brand’s Americans
    with Disabilities Act (ADA) compliance on their gift card order page when using a desktop
    computer, as well as the ease of purchasing a gift card for self-use.

     Source: NRF 2018 Holiday Spending Survey, conducted by Proper Insights & Analytics, Oct. 1-11, 2018
    1

     https://nrf.com/media/press-releases/consumers-will-spend-41-percent-more-last-year-during-winter-holidays-according
     Source: National Retail Federation, Oct. 3, 2018 https://nrf.com/media/press-releases/nrf-forecasts-holiday-sales-will-increase-during-2018-season
    2

3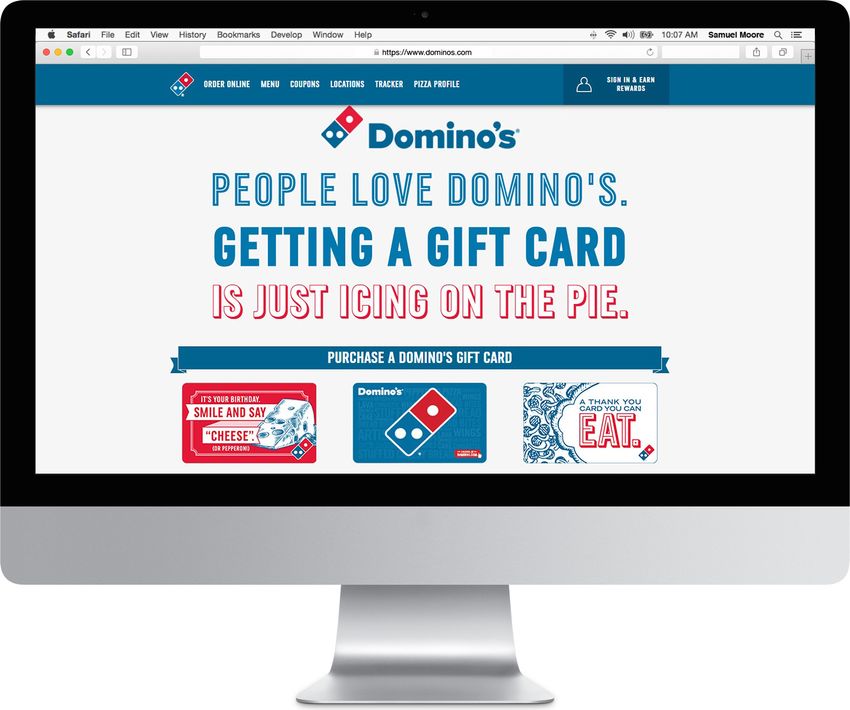
METHODOLOGY
    This assessment evaluates criteria that are impacted by a range of stakeholders across
    merchant organizations (e.g., gift card, e-commerce, marketing, finance/accounting, etc.), as
    well as gift card platform providers and fulfillment partners. It provides a holistic view into the
    merchant gift card e-commerce market and builds upon last year’s research.

    The assessment leveraged publicly accessible information about merchants’ consumer and
    B-to-B gift card e-commerce offerings and the use of gift cards for marketing. Criteria were
    designed to identify expected and emerging capabilities for merchants’ online digital and
    physical gift card offerings to consumers through desktop, mobile website and app, and
    through B-to-B channels. The study evaluated the recipient experience for both digital and
    physical cards, including redemption options. The research was conducted in July and August
    2018. For gift card purchases, we took all steps possible to ensure purchases typified actual
    consumer gift card transactions (e.g., graduation gifts were purchased for real recipients
    with real email and physical addresses, using appropriate card designs and messages for the
    occasion to replicate the actual purchase experience and minimize the risk of transactions
    being declined as potentially fraudulent).

    The gift card buying and recipient experiences were evaluated across multiple devices. We
    assessed how merchants promote the online sale of gift cards to both consumers and B-to-B
    buyers. Merchants were measured against more than 100 unique criteria, covering the specific
    elements of the purchase and recipient process. These are grouped into eight main categories
    listed below:

          •   Discoverability/Awareness

          •   Gift Card Offering Flexibility

          •   Checkout/Post-Purchase

          •   Recipient Experience

          •   B-to-B

          •   Promotions

          •   Credit Card Reward Programs

          •   Product E-Gifting

    Please see Appendix C for more details regarding methodology.

4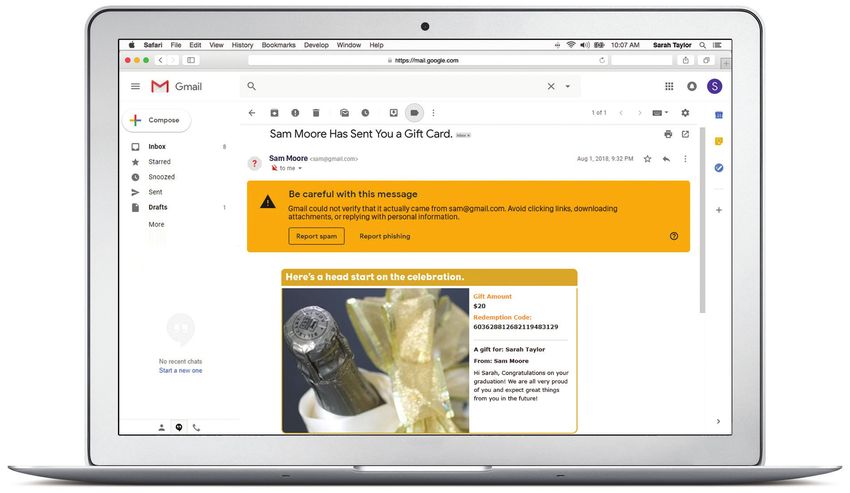
MERCHANTS WE EVALUATED
    According to Mercator, gift card sales are projected to reach $171.5 billion in 2019, up from
    $166.7 billion in 20183. When selecting this year's categories, we included as many giftable
    verticals as possible. One-hundred top merchants, determined by industry rankings, were
    chosen from the following categories (see Appendix A for the full list of retailers evaluated):

                 •    Airlines

                 •    Apparel

                 •    Consumer Electronics

                 •    Department Store

                 •    Digital Entertainment

                 •    General Merchandise

                 •    Grocery/Pharmacy

                 •    Health and Beauty

                 •    Home Goods/Furnishings

                 •    Home Improvement

                 •    Hotels

                 •    Restaurant - Casual

                 •    Restaurant - Quick Serve

                 •    Specialty Retail

                 •    Sporting Goods/Outdoor

    This year’s assessment included grocery as a new category, a rapidly growing e-commerce industry.

    3
        Source: 15th Annual U.S. Open-Loop and Closed-Loop Prepaid Cards Market Forecasts, 2017 - 2021, Sept & Nov 2018

5
FINDINGS AND RESULTS                                                 Chart 1
    For the second consecutive year, Amazon.com, Inc. topped             Top 10 Overall
    the rankings for overall best score. The e-commerce leader
    received 79 percent of the total possible points across all          MERCHANT                     SCORE
    criteria ahead of second-place finisher, Sephora (75 percent).
    Rounding out the top five were Williams-Sonoma (74 percent),         Amazon                       79%
    Bed Bath & Beyond (69 percent), and Best Buy (67 percent).           Sephora                      75%
    In addition to Amazon, which repeated its first-place ranking,
    both Sephora and Best Buy appear in the top five for the             Williams-Sonoma              74%
    second straight year.
                                                                         Bed Bath & Beyond            69%
    Consistency is what vaulted Amazon into the top spot for
                                                                         Best Buy                     67%
    the second straight year. The online retailer finished in the
    top three in six individual criteria categories, and above the       Chipotle Mexican Grill 66%
    average score in seven of the eight criteria categories (product
    e-gifting being the exception). However, there’s still room for      Gap                          66%
    improvement for Amazon. The company took sole possession             REI                          66%
    of first place in just one of the eight criteria categories (gift
    card offering flexibility), and tied for first place with 18 other   Texas Roadhouse              66%
    brands in another category (promotions). Amazon received
                                                                         Macy’s                       65%
    the maximum score in only one category: promotions.
                                                                         Victoria's Secret            65%
    The good news for retailers outside the top 10 is that Amazon
                                                                         *See the Appendix for a full ranking,
    and the other brands at the top of this year’s rankings have
                                                                         including top performers by vertical
    room for improvement in their gift card programs. However,
    as evidenced in the overall average score of 44 percent for
    the 100 retailers evaluated, there is a significant gap between
    the top scoring merchants and the rest of the field. While this
    is a slight improvement over last year’s average of 42 percent,      Figure 1
    there are clearly many areas in which the brands’ gift card          Year-Over-Year
    programs can be improved.                                            Results
    The brands that showed the biggest improvements year-                                                44
    over-year include HSN, which posted a 30 percent increase                                    35
    in percentage of total points captured; Delta Air Lines (26            6
    percent); Air Canada (21 percent); and iTunes and Gap (both 19
    percent). And a positive trend overall is that more companies
    improved their score from last year (44 in total) vs. those that     n Improved Brand Score
    saw their score drop (35 in total) — six brands’ scores stayed       n Brand Score Dropped
    the same year-over-year, and 15 brands were new to this year’s
                                                                         n Stayed the Same
    assessment. Brands are moving in the right direction, but their
                                                                         *Note: 15 brands were new to this
    rate of progress leaves room for improvement.                        year’s assessment

6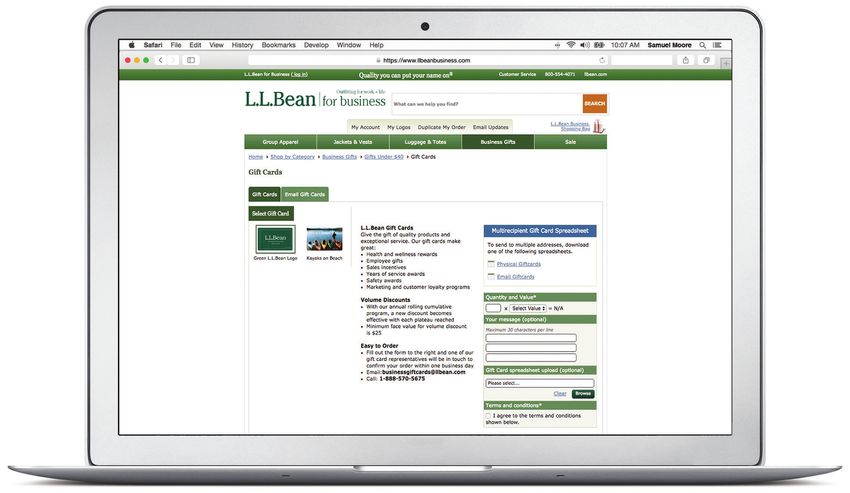
TRADITIONAL RETAIL CATEGORIES FARE BEST
    When analyzing the results by category, the overall leader may surprise you considering their
    recent well-documented struggles. Department stores had the highest average score (55
    percent), followed by health and beauty (52 percent), home goods (52 percent) and apparel (51
    percent). On the other end of the spectrum, the categories with the lowest average scores were
    digital entertainment (24 percent), grocery/pharmacy (28 percent) and hotels (31 percent).

    What stands out here is the opportunity for grocery/pharmacy merchants to quickly improve
    their gift card programs. The category was a late adopter of e-commerce, but now is one
    of the fastest-growing online retail categories4. Consider that by 2025, it is forecast that 20
    percent of grocery sales will be transacted online, up from just 2 percent to 4 percent in
    20175. Furthermore, travel categories such as hotels and airlines can capitalize on consumers’
    increasing penchant for buying experiences rather than things, particularly millennials, to
    promote the sale of their gift cards.

    PRIMARY ONLINE CUSTOMER JOURNEY A STRENGTH FOR
    MERCHANTS
    The primary online customer journey for purchasing gift cards has traditionally been desktop
    purchases of digital and physical gift cards, with digital cards then accessed by recipients via
    desktop or mobile. Getting that experience right is the starting point for any successful gift
    card program. So how are brands performing in this area?

    The 100 brands evaluated received an average of 50 percent of the total points possible for
    this criteria, higher than the overall average score across all criteria (44 percent).

    4
     Source: NPD Group, Categories Shifting Online, https://www.npd.com/wps/portal/npd/us/news/thought-leadership/2018/top-categories-shifting-online/
    5
     Source: Forbes, Online Grocery Sales to Reach $100 Billion in 2025; Amazon is Current and Future Leader,
    https://www.forbes.com/sites/pamdanziger/2018/01/18/online-grocery-sales-to-reach-100-billion-in-2025-amazon-set-to-be-market-share-leader/#44dacad362f3

7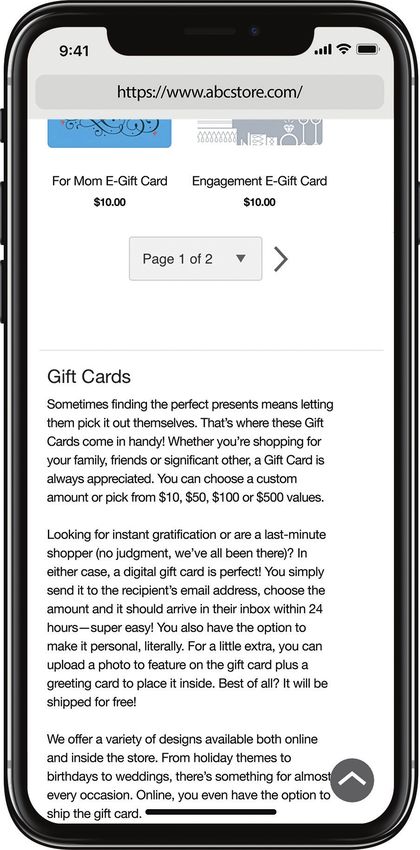
As for the individual brands with the best primary online customer journey, here’s the top 10:

               Chart 2
                 MERCHANT                                      SCORE
                  Sephora                                        82%

                  Williams-Sonoma                                80%

                  Ulta Beauty                                    80%

                  The Cheesecake Factory                         80%

                  The Home Depot                                 79%

                  Panera Bread                                   79%

                  Best Buy                                       78%

                  Bed Bath & Beyond                              78%

                  lululemon                                      78%

                  Nordstrom                                      77%

                  QVC                                            77%

                  Victoria's Secret                              77%

    An interesting observation for the top 10 performers in this sub-set of criteria is that all of them
    are using gift card e-commerce solutions powered by third-party vendors.

    THE YEAR OF MOBILE
    One of the more positive trends to emerge from this year’s evaluation is the marked
    improvement seen in brands’ mobile web and mobile app purchase experiences. The average
    score for the brands’ mobile web purchase experience was 46 percent, up 11 percentage points
    from last year. The improvement wasn’t limited to brands’ mobile websites. When evaluating
    the purchase experience for the brands with a mobile app, they received an average score
    of 28 percent vs. 21 percent last year (13 of the brands evaluated did not have a commerce-
    oriented mobile app, so they were not scored for this criteria. See Appendix C for more details
    on app scoring).

    With 125 million U.S. consumers now owning a smartphone, and 62 percent of smartphone
    users having made a purchase online using their mobile device in the last six months6, it’s clear
    that brands need to be optimizing their gift card programs for mobile users just like they would
    any other product. The merchants currently doing the best job overall for the mobile website
    gift card purchasers include Amazon (92 percent), REI (74 percent), Lands’ End (73 percent),
    Walmart (73 percent), Lowe’s (71 percent), Target (69 percent), Barnes & Noble (67 percent),
    Macy’s (66 percent), and Olive Garden, Victoria’s Secret and Williams-Sonoma (all 63 percent).

    6
     Source: OuterBox, Mobile eCommerce Stats in 2018 and the Future Trends of mCommerce, Oct. 26, 2018
    https://www.outerboxdesign.com/web-design-articles/mobile-ecommerce-statistics

8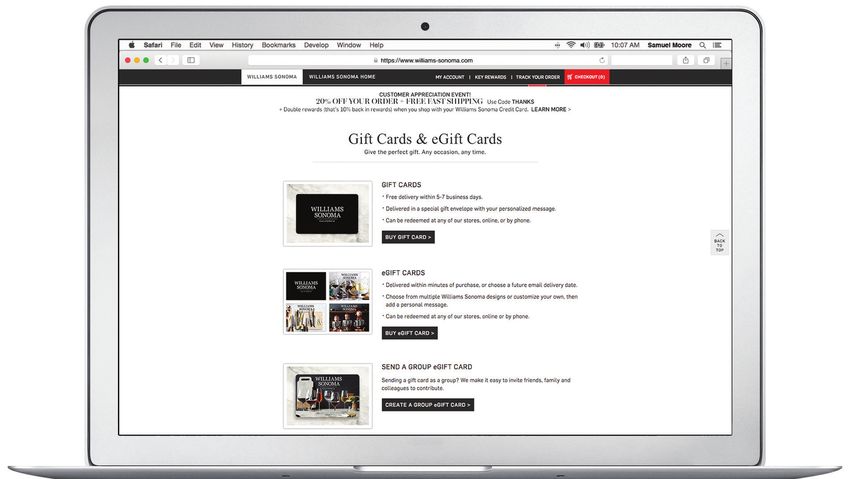
When looking specifically at the mobile app purchase journey, the merchants to model
    your experience after are Amazon (97 percent), Macy’s (70 percent), Sephora (64 percent),
    Williams-Sonoma (63 percent), Victoria’s Secret (61 percent), Overstock.com (60 percent),
    Walmart and Domino’s (tied at 59 percent), Texas Roadhouse (57 percent), and Olive Garden
    and Chipotle (both 56 percent).

    However, despite the gains made in the mobile purchase experience, we still see a drop-off
    in scores compared to the average desktop purchase experience. Brands tallied an average
    score of 52 percent on desktop, a slight boost from last year’s score of 49 percent. What is
    encouraging for merchants is that the gap between the average desktop purchase compared
    to the average mobile web experience has closed significantly, from 14 percentage points in
    2017 to just 6 percentage points this year.

    Where merchants are still coming up short is their mobile apps. Far too many brands that have
    a commerce-enabled mobile app are not making gift cards available for purchase within their
    app, a missed revenue opportunity. Consider that 28 brands with a commerce-enabled app
    received zero points for their mobile app purchase experience because they did not have gift
    cards available for purchase.

    B-TO-B PROGRAMS
    The sale of gift cards to businesses in bulk for their use in reward programs, employee
    recognition programs, sweepstakes, etc., represents an untapped revenue opportunity for
    many brands. Thirty-seven of the merchants analyzed had no mention of a B-to-B gift card
    program on their website (a slight improvement from last year’s 41). Furthermore, only 38 of
    the merchants evaluated offered both physical and digital gift cards to B-to-B buyers, although
    this was an increase from last year’s 29. Overall, merchants received, on average, 49 percent of
    the total B-to-B points available to them.

    L.L.Bean is an example of a brand that’s getting B-to-B sales of gift cards right (Figure 2). The
    company’s website featured lots of information about discounts for B-to-B purchases, the
    order process, and reasons why gift cards are a good idea for a business to purchase, as well as
    suggestions about how they could be used by a business. Furthermore, L.L.Bean’s B-to-B order
    form easily could be found on-site; offers the option to send gift cards to multiple addresses,
    with the ability to upload spreadsheets for physical or digital delivery; and provides additional
    options for ordering (phone and email). Lastly, on L.L.Bean’s gift card landing page, there was
    a section specially designed for B-to-B purchases — Business Gifts & Incentives.

9
Figure 2

     2018 GIFT CARD TRENDS
     Here are some of the notable highlights (and lowlights) that emerged from this year’s
     evaluations of 100 brands’ e-commerce gift card programs:

     OMNICHANNEL PROGRESS BEING MADE … BUT MORE
     WORK TO BE DONE
     In a significant improvement from last year, 51 of the brands evaluated offered both digital and
     physical cards in all available channels — desktop, mobile web and, for some, mobile app. In
     our 2017 report, just 36 merchants could make that same claim. What remains a challenge for
     merchants is improving the mobile purchase and recipient experience so that it’s comparable
     to desktop. Only eight of the 87 brands with a commerce app evaluated have mobile app
     purchase experiences that score equal to or better than their desktop experiences. The
     good news is that this is significantly better than last year, when that number was three. By
     comparison, for mobile websites, 32 of the brands evaluated had experiences that scored equal
     to or better than their desktop experiences.

     Perhaps it isn’t surprising that brands are struggling with selling gift cards across multiple
     channels, considering that omnichannel is a top challenge for retailers. According to a recent
     report from KPMG7 , while a little over three-quarters (77 percent) of retailers cite omnichannel
     as a top or high priority, at least two-thirds say their omnichannel efforts haven’t generated the
     ROI they need. The roadblocks to successful omnichannel selling — whether for gift cards or any
     other product — include security and compliance concerns; technology and data silos; strategy
     misalignment; people and process misalignment; and business teams' silos (e.g., online, offline).

     7
         Source: Changing the paradigm on customer centricity, https://assets.kpmg.com/content/dam/kpmg/jm/pdf/omni-channel-study-2016-retail.pdf

10
LACK OF PAYMENT OPTIONS
It makes sense that the more ways that you give a consumer to pay for an item, gift cards
included, the more likely they are to make a purchase. Therefore, it’s discouraging to see that
many of the merchants evaluated have been slow to offer alternative payment methods into
their checkout processes. This is particularly true for mobile, where it’s even more critical to
offer easy payment options such as PayPal and Apple Pay, which minimize the amount of
data entry needed as well as make transactions more secure. By 2021, mobile e-commerce
is forecast to account for nearly 54 percent of all e-commerce sales in the United States8.
Merchants won't want to fail to provide this important sales channel and potentially miss out
on the chance to cash in on this market opportunity.
In the following example from a leading quick-serve restaurant, you'll see gift card buyers are
presented with a limited option of payment choices — major credit cards, or check or money
order.
Figure 3
Beyond standard credit cards, PayPal was the most widely available payment option, with
nearly half (43) of all merchants offering it. Twenty-two percent of merchants offered Visa
Checkout and/or MasterPass as a payment option in at least one purchase channel compared
to 10 percent last year.
8
Source: Statista, Mobile commerce in the United States - Statistics & Facts, https://www.statista.com/topics/1185/mobile-commerce/
11In this example from Victoria's Secret's mobile website Figure 4
(Figure 4), the gift card buyer is given the option to pay
via a multitude of credit cards as well as PayPal.
OPPORTUNITY FOR IMPROVING ADA
COMPLIANCE
For the first time, we measured merchants’ e-commerce
gift card programs based on their level of compliance
with the U.S. Department of Justice’s Americans with
Disabilities Act (ADA) Standards for Accessible Design.
These standards state that all electronic and information
technology must be accessible to people with disabilities.
Failing to comply with the ADA risks potentially costly
litigation, whether in the form of an individual claim or
class-action lawsuit by consumers or an action by the
government.
Moreover, it makes smart business sense to have a good
customer experience for all site visitors, including those
with disabilities. Beyond the ethical responsibility of
providing each visitor with access and the ability to place
an order, there are obviously financial implications as well.
So how did merchants’ desktop websites stack up when
measured on their e-commerce gift card programs
compliance with the ADA Standards for Accessible
Design? For the most part, they performed well. When
looking at it on a holistic basis, 13 brands received a score
of zero, while nine brands received the maximum score.
Therefore, the vast majority of the brands evaluated fall
somewhere in the middle, meeting some of the needs of
visitors with disabilities, but at the same time not doing
everything needed to maximize their score in this category.
The nine brands that received the maximum score for this
category were Ann Taylor, Food Lion, Buffalo Wild Wings,
Applebee’s (Figure 5), Outback Steakhouse, Red Lobster,
Domino’s, Adidas, and CVS Pharmacy.
12Figure 5
SELF-USE PURCHASE EXPERIENCES REMAIN UNTAPPED
A recent study from Blackhawk Network* found that 69 percent of consumers have purchased
a gift card for themselves9. There are myriad reasons why consumers are purchasing gift cards
for themselves. According to a recent survey by Blackhawk and Leger, 51 percent of consumers
said they purchase gift cards for themselves to shop online, the most popular reason given,
followed by receiving a discount or taking advantage of a promotion (46 percent); collecting
credit card points (42 percent); budgeting purposes (17 percent); and earning airline miles (14
percent)10. This high level of self-use should cause brands to re-examine their e-commerce gift
card purchase experience. For example, can the customer opt to skip steps on the checkout
page, such as adding recipient’s information or personalized messaging, to make the purchase
experience faster and easier? Take a look at the example from women's clothing retailer Ann
Taylor (Figure 6), which shows how the brand's gift card program caters to self-use in addition
to gifting.
Despite the consumer demand for self-use of gift cards, the brands we evaluated are not yet
catering to this behavior. Nearly three-quarters of the merchants (74) received zero points for this
category, while only 23 received the maximum score. What this tells us is that much like B-to-B,
self-use presents an opportunity for merchants to accommodate buyers with a specific need.
*Note that CashStar Inc. is a wholly-owned subsidiary of Blackhawk Network, Inc.
9
Source: Blackhawk Network, 2018 State of Consumer Gift Card Preferences, March 2018
10
Source: 2018 US Spring Summit Research, Leger and Blackhawk Network, March 2018
13Figure 6
AGGRESSIVE FRAUD PROTECTION COSTING MERCHANTS SALES
AND CUSTOMERS
A theme to emerge this year as we went through the buying process was that more orders
were being declined as potentially fraudulent than in previous years. The buying process hadn’t
changed year-over-year, so why the uptick in declined orders? The simple answer would be
that fraud continues to be an ongoing concern for online retailers. It’s costing them money, and
they’re putting measures in place to try and prevent it. Consider that online fraud is costing
retailers 5.4 percent of their annual revenue, and fraud losses increased by 7 percent in 2017,
according to recent research by Signifyd11. When you apply that cost to the $461 billion in
annual e-commerce spending in the United States, fraud is costing merchants nearly $25 billion
each year. In addition, fraud rates for gift card e-commerce purchases are higher than other
types of card-not-present (CNP) fraud12.
So it’s understandable that retailers would want to have systems and procedures in place to
prevent instances of fraud. However, if valid transactions are being declined because of “false
positives” on fraud screening, are they going too far in their efforts or perhaps not solving
the underlying fraud problem in the right way, simply because they lack the expertise and
resources to do so? Merchants can partner with third-party providers that have expertise
in fraud protection to help address these challenges. That same Signifyd report found that
false declines (i.e., rejecting legitimate orders) account for more than half of the cost of fraud,
representing 2.9 percent of revenue. We saw signs of this trend in our own gift card buying
experience this year (see Figure 7).
11
Source: Signifyd, The True Cost of Online Fraud Might Surprise You, Sept. 5, 2018
12
Source: Riskified, CNP Fraud in Gift Cards: A Special Report, March 2017
14Figure 7
The impact of false declines on a merchant’s business has multiple layers. First, and most
obvious, the retailer isn’t receiving the revenue from what should be an approved transaction.
There’s an immediate hit to the bottom line in the short term. Second, and perhaps more
importantly, is the negative impact false declines have on customer lifetime value. If a
legitimate customer trying to purchase a gift card from your site is declined, the chances that
he or she will come back to try to buy again from that merchant are reduced dramatically.
Furthermore, the chances of that consumer recommending your company to their friends,
family, social followers, etc., is similarly shot. In fact one can imagine he or she is more likely
to take to social media to vent about their negative experience with your brand, which has a
potential negative ripple effect on your brand’s reputation and goodwill.
With this in mind, what steps can merchants take to protect themselves from fraud while not
denying legitimate orders (and the resulting poor customer experience) at the same time?
Here are a couple of opportunities and best practices:
1. Constantly monitor and be aware of your data on fraud status in real time — i.e.,
the percentage of orders that are being flagged and denied as potentially fraudulent.
Unexpected peaks should warrant further investigation.
2. Test your program by making a purchase yourself. For example, purchase a gift card
for self-use with a different shipping address than the credit card address, and see if the
transaction gets flagged and either delayed or denied.
3. Know what the experience is like for customers whose orders are cancelled. What is
the customer service protocol for follow-up, explanation, re-engagement, etc.? What are
service-level expectations for that type of scenario?
15BRANDS MAKING GIFT CARDS EASIER TO FIND
Considering the revenue gift cards can generate for a merchant’s business, it would make
sense that they would be easy to find and purchase on their websites (desktop and mobile) and
apps. Merchants seem to be getting that message, as this year’s evaluation saw improvements
in gift card discoverability, particularly on brands’ mobile apps.
The top performers on this criteria scored at 90-plus percent, with special recognition for
Williams-Sonoma (Figure 8), which received the maximum available points.
Figure 8
16The average score for this criteria was 55 percent, the highest of the eight criteria categories.
Brands that scored the highest for this criteria have links to gift card purchasing pages in
menus and gifting sections of their site (if appropriate). Their search results take consumers
directly to a clean, informative and brand-appropriate landing page, enticing the purchaser to
move forward with their gift card purchase. For example, Domino’s features gift cards as a top-
level menu option, and its landing page is easy to engage with, well-branded and informative
(Figure 9).
Figure 9
A particular emphasis on improving the discoverability of gift cards within merchants’ apps
was seen in this year’s evaluation. For example, QVC had a simple, clean and easy-to-find gift
card section on its app, inviting users to either purchase a digital or physical card, with multiple
delivery options offered (Figure 10).
17Figure 10
A problem area for discoverability was seen in site search results. Some brands did a poor job
of prominently featuring gift cards on results pages, if they were included at all. In addition,
several brands buried their gift card link in their website’s footer, leading consumers to have to
search the entire homepage to find it.
USE OF GIFT CARDS AS PROMOTIONAL TOOL REMAINS STATIC
A key way that merchants can optimize their gift card programs in addition to them being a
sales channel is to find ways to use them as promotional tools. Last year, half of the merchants
evaluated offered gift card promotions and/or used gift cards as incentives in e-commerce
marketing programs. Our evaluation this year revealed that number hasn’t changed. Fifty
brands were credited this year with points for the use of gift cards as a promotional tool.
18With significant consumer demand for gift cards, it makes sense for brands to use them as an
incentive to drive certain behaviors — e.g., registration for subscription services, boost loyalty
program engagement, encourage the use of specific payment methods, etc. This is a growth
opportunity for merchants, and they would be wise to take advantage of it.
The Honest Company, a household products CPG brand, is using gift cards as a tool to
incentivize customers to refer their friends to the brand (see Figure 11 below).
Figure 11
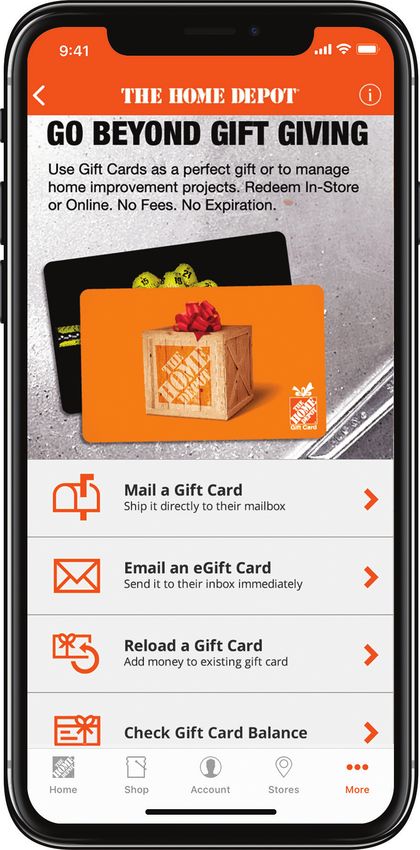
19Bed Bath & Beyond (Figure 12) is using its gift card checkout page to promote a user-
generated content initiative, asking customers to upload photos of their BB&B products in use
to Facebook, Instagram, Twitter or the company’s website and receive a gift card reward for
participating.
Figure 12
20COMMON MISTAKES BEING MADE
With the 100 brands evaluated capturing less than half of the available points (44 percent), it’s
clear that missed opportunities are happening far too frequently. Brands need to address these
problem areas to get the full potential from their gift card programs.
DISCOVERABILITY AND LACK OF PROGRAM INFORMATION
While merchants showed improvement this year in making gift cards easier to find on their
websites, mobile websites and mobile apps, there’s still room for growth. Merchants need to do a
better job of making their gift cards easily accessible across each of their channels. This includes
not only the homepage, but site search results as well. Not all consumers are going to arrive on
your site via the same path, so site search should proactively account for “gift card” searches.
In Figure 13 below, you see an example of how a leading online grocery brand has not accounted
for "gift card" site searches. This experience will likely lead visitors to abruptly leave the site.
Nearly half of the merchants (45) received 50 percent or less of the available points for
discoverability.
In addition to making gift cards easy to find, brands need to do a better job of explaining to
site visitors the process for buying and sending a gift card, as well as the benefits of doing so.
Don’t make the customer have to search far and wide for this information, and make it easy for a
potential purchaser to understand — not like this example from a leading retailer (Figure 14).
Figure 13 Figure 14
21Consider the use of bullet points or other visual elements to clearly spell out the gift card
buying process and the benefits of such a purchase. Here’s a good example of this from The
Home Depot’s mobile app:
Figure 15
22POST-PURCHASE EXPERIENCE DOESN’T MEASURE UP
The merchant’s work isn’t done when the customer clicks the “Buy” button. The customer
experience extends beyond the purchase to order fulfillment and delivery, whether the gift
card is being sent to the buyer or a recipient. In addition, customers expect a consistent brand
experience throughout the entire process. Too often the merchants evaluated failed to deliver on
those expectations. Order fulfillment and delivery is the final step in the process, and therefore
will be the one that leaves the lasting impression on a merchant’s customer if it falls short.
The average score for the merchants in this criteria was 57 percent, but nearly half (47) of
the evaluated merchants failed to reach that average score. Brands that excelled in the post-
purchase experience included Victoria’s Secret, REI, Best Buy, and BackCountry.com. Take a
look at how Victoria’s Secret shipped its physical card in a branded container, and then opened
up to a branded box which held the branded gift card (Figure 16).
Figure 16
23POOR CX Figure 18
From broken links to the inability to buy gift cards to
missing information to landing pages not optimized for
mobile devices, there were a bevy of problems related to
customer experience that could inhibit or prevent gift card
sales. Merchants should treat gift cards as they would any
other revenue-producing product and optimize the buying
experience.
Poor customer experience not only puts current revenue
at risk from the loss of immediate sales, but it also
potentially negatively impacts future earnings as well from
customers that may decide not to come back to your site
again.
See examples of a merchant that was unable to process
gift card orders (Figure 17), one that had connection
issues with its app (Figure 18), and another whose gift
card landing page wasn’t optimized for the mobile device
that it was being viewed on (Figure 19).
Figure 17 Figure 19
24LAPSES IN DATA SECURITY Figure 20
Considering the well-publicized data breaches and other
cybersecurity issues that have impacted the retail industry,
it was somewhat surprising to see the number of instances
in which sensitive personal information and other valuable
data wasn’t handled with the utmost concern for security.
For example, merchants included sensitive information
such as PIN codes in purchase confirmation emails (see
Figure 20 to the right for an example), and didn’t encrypt
personal data in customer communications (see Figure
21 below for an example). There’s no faster way to lose
a customer than to lose their trust in you to securely
manage and protect their data. Ensure you’re taking every
precaution necessary to guarantee the security of your
customers’ information.
Figure 21
DECLINING LEGITIMATE ORDERS
We experienced an increase this year in the number of orders declined due to them being
flagged as potentially fraudulent. False declines negatively impact a customer’s experience,
which has a direct correlation to sales.
Merchants are challenged to defend themselves against the very real threat of fraud, while at
the same time not being too aggressive in flagging orders, potentially alienating legitimate
buyers in the process. It’s a balancing act that they don’t seem to have mastered just yet.
25KEY TAKEWAYS FOR MERCHANTS
1. Place an emphasis on omnichannel. Consumers are increasingly shopping for all products,
including gift cards, across multiple channels. Ensure your gift cards are available in all
channels where you sell, and that the buying experience is seamless no matter the channel
they choose to purchase in. Place a particular emphasis on upgrading the mobile experience
(website and app), which to this point widely lags behind the desktop experience.
2. Cater to self-buyers. Studies have clearly demonstrated that consumers want to buy gift
cards for themselves, not just to purchase them for other people. Make it quicker and easier
for customers to purchase gift cards for themselves by enabling them to skip steps that are
necessary only for gifting (e.g., adding recipient’s information, personalized messaging). The
self-use buying process should be as quick and easy as possible.
3. Make B-to-B a bigger part of your gift card program. Promoting the sale of gift cards in
bulk to other businesses is not something all merchants are doing, and for those merchants,
there’s market share to gain here. Create a section on your gift card landing page specifically
targeted to B-to-B buyers, and include examples of the different ways that businesses can use
your brand’s gift cards to help them to easily connect the dots — e.g., gifts to employees, gift
to customers, employee bonuses, promotions, etc.
4. Consider the CX of all shoppers, including those with disabilities. Brands must be aware
of the ADA Standards for Accessible Design when creating their sites and apps. The amount of
visitors coming to your site that have a disability is likely meaningful, so there’s both an ethical
and financial responsibility to give these consumers the best experience possible. Furthermore,
the easier it is for consumers to find your gift cards and understand the process for buying
and sending them, the better your chances are of converting them into customers. This best
practice extends across desktop, mobile website and mobile app channels.
5. Strike the right balance with fraud protection. Find a happy medium between having a
stringent fraud protection service in place with a checkout experience that’s not too onerous
for customers. False declines can have a significant negative impact on both short- and long-
term revenue and customer loyalty.
6. Use gift cards as a promotional tool. Capitalize on the tremendous consumer appeal gift
cards have by making them more than just a sales channel. Run programs using gift cards
within marketing campaigns as incentives to drive specific behaviors — e.g., email sign-ups,
loyalty program engagement, customer referrals, product reviews, etc. Gift cards can have
value beyond a revenue-generating product.
7. Test your own program. You can evaluate the effectiveness and ease of use of your
e-commerce gift card program by testing it yourself. Go through the process and purchase
cards (physical and digital) in multiple channels, using different types of payments and
personalization options, then honestly grade your brand’s performance and any issues you
encountered along the way. There’s no better way to gain insights into the strengths and
weaknesses of your gift card program than becoming a customer and living the experience
first-hand.
268. Encourage innovation. Only 17 of the merchants we assessed received points for their
innovative use of gift cards. By testing new and unique ways to sell and promote gift cards, you
can differentiate your company’s program from your competitors. Here are some examples of
innovation that merchants have incorporated into their gift card programs:
• Wayfair’s use of confidence builders on the checkout page — e.g., worry-free
guarantee, PCI compliance icon, privacy protection guarantee, link to customer
service — to help ease shoppers’ concerns and boost conversions;
• Sephora’s use of video on the product detail page to give visitors ideas on how they
can spend their gift card (see Figure 22 below);
• Starbucks enabling users of its app to choose the gift card recipient from the list of
contacts already in their phone, saving them from having to enter that information;
• Target offering Spanish language faceplate designs (see Figure 23);
• QVC adding an “unwrapping” video for its e-gift card recipients;
• Gap offering a side-by-side comparison of benefits between its physical gift cards
and electronic gift cards; and
• Domino’s incorporating its gift card program into both its wedding and baby registry.
Figure 22
27Outside of what was tracked in our evaluation, there’s Figure 23
constant innovation from merchants in leveraging
gift cards to connect with customers where they are.
Contextual commerce is a growing area of opportunity
to engage with customers, and Starbucks has great
example of how to leverage it with its ability to send
e-gift cards within iMessage (see Figure 24 below).
Figure 24
28CONCLUSION
For the second consecutive year, Amazon is No. 1 on NAPCO Research’s Merchant Gift Card
E-Commerce Evaluation. The retail giant received 79 percent of the total available points in this
thorough, cross-platform assessment of the e-commerce gift card marketplace (up from last
year’s 71 percent for Amazon). While it can seem like Amazon is winning at everything right
now, gift cards included, the silver lining for other merchants is that the gap between them and
Amazon isn’t insurmountable. The company took sole possession of first place in just one of
the eight criteria categories (gift card offering flexibility), and tied for first place with 18 other
brands in another category (promotions). Amazon received the maximum score in only one
category: promotions.
Overall, even the merchants with the “best” gift card e-commerce programs have plenty of
room for improvement. Consider that the overall average for the 100 brands evaluated was only
44 percent. By our calculations, merchants are missing on more than they’re getting right. With
the right adjustments to their gift card programs — see the takeaway tips earlier in this report
— many merchants could challenge Amazon for the top spot in the rankings. Key areas to focus
on include, but are not limited to, customer experience, data security, fraud protection, B-to-B
programs, use of gift cards for promotional purposes, and ease of discoverability.
A bright spot for the merchants’ e-commerce gift card programs in our evaluations is the
primary customer journey — i.e., desktop purchase of digital and physical cards, with digital
gift cards accessed by recipients via desktop or mobile. The top primary customer journey
performers scored 80 percent or higher on a set of criteria that was designed to assess
important capabilities, including personalization, payment options and recipient experience.
That said, the primary customer journey is continuing to shift to mobile purchases (if it hasn’t
done so already), and brands appear to be falling behind for this new reality. While improvement
was seen from last year’s mobile performance, both for mobile website and mobile app, we still
see a significant gap here when compared to the average desktop purchase experience. What
is encouraging for merchants is that this gap has closed significantly in the space of a year, from
14 percentage points in 2017 to just 6 percentage points this year. That gap will have to continue
shrinking as the “primary” customer journey moves more and more to mobile.
Our research showed that merchants are moving in the right direction and making progress
in optimizing their e-commerce gift card programs, but it’s slow. In today’s fast-paced retail
environment, particularly online, merchants must be agile and able to quickly make changes to
their gift card programs to keep up with the competition. Research such as this should serve as
a resource to help your brand stay up-to-date on the latest trends in the gift card e-commerce
landscape.
There are many opportunities for merchants to improve their gift card e-commerce offerings
across channels. Start by holistically evaluating what you are doing well and what can be done
better across all aspects of your online gift card program. Collaboration between a merchant's
many internal teams that influence how a gift card offering comes to market, as well as
external platform providers and fulfillment partners, is undoubtedly required. The right mix of
technology, expertise and a merchant's own internally driven practices is the key to success in
today’s gift card market.
29APPENDIX A:
Ranking of Retailers by Overall Score
BRAND SCORE CATEGORY
Amazon 79% General Merchandise
Sephora 75% Health & Beauty
Williams-Sonoma 74% Home Goods / Furnishings
Bed Bath & Beyond 69% Home Goods / Furnishings
Best Buy 67% Consumer Electronics
Chipotle Mexican Grill 66% Restaurants - Quick Serve
Gap 66% Apparel
REI 66% Sporting Goods / Outdoors
Texas Roadhouse 66% Restaurants - Casual
Macy's 65% Department Stores
Victoria's Secret 65% Apparel
Nordstrom 64% Department Stores
Ulta Beauty 63% Health & Beauty
The Home Depot 63% Home Improvement
J.C. Penney 63% Department Stores
Barnes & Noble 61% Specialty Retail
Applebee's Neighborhood Grill & Bar 60% Restaurants - Casual
The Cheesecake Factory 60% Restaurants - Casual
Starbucks 60% Restaurants - Quick Serve
Neiman Marcus 59% Department Stores
Olive Garden 58% Restaurants - Casual
Dunkin' Donuts 57% Restaurants - Quick Serve
lululemon 57% Sporting Goods / Outdoors
Ann Taylor 57% Apparel
QVC 56% General Merchandise
Delta Air Lines 56% Airlines
Subway 55% Restaurants - Quick Serve
Lands' End 55% Apparel
IHOP 55% Restaurants - Casual
Belk 55% Department Stores
Under Armour 55% Sporting Goods / Outdoors
Office Depot 54% Specialty Retail
Panera Bread 54% Restaurants - Quick Serve
Red Lobster 54% Restaurants - Casual
DICK’S Sporting Goods 53% Sporting Goods / Outdoors
Marriott 52% Hotels
30BRAND SCORE CATEGORY
Target 52% General Merchandise
Petco 51% Specialty Retail
Walmart 51% General Merchandise
Lowe's 51% Home Improvement
The North Face 51% Apparel
Groupon 51% General Merchandise
Food Lion 51% Grocery / Pharmacy
L.L.Bean 48% Sporting Goods / Outdoors
Musician's Friend 47% Specialty Retail
Wayfair 47% Home Goods / Furnishings
Domino’s 47% Restaurants - Quick Serve
Staples 47% Specialty Retail
Talbots 46% Apparel
Cracker Barrel Old Country Store 46% Restaurants - Casual
Outback Steakhouse 45% Restaurants - Casual
J.Crew 45% Apparel
Nike 45% Sporting Goods / Outdoors
Burger King 44% Restaurants - Quick Serve
Chili's Grill & Bar 44% Restaurants - Casual
Kohl's 44% Department Stores
Fandango 44% Digital Entertainment
Overstock.com 44% General Merchandise
iTunes 43% Digital Entertainment
Dairy Queen 43% Restaurants - Quick Serve
HSN.com 43% General Merchandise
Backcountry.com 43% Sporting Goods / Outdoors
Hyatt Hotels 42% Hotels
Foot Locker 42% Sporting Goods / Outdoors
Air Canada 41% Airlines
IKEA Group USA 41% Home Goods / Furnishings
Estée Lauder 40% Health & Beauty
Omni Hotels & Resorts 37% Hotels
adidas 36% Sporting Goods / Outdoors
Hudson's Bay 36% Department Stores
Buffalo Wild Wings 36% Restaurants - Casual
Menards 35% Home Improvement
Northern Tool & Equipment 35% Home Improvement
American Airlines 33% Airlines
31BRAND SCORE CATEGORY
Four Seasons Hotels & Resorts 32% Hotels
Crutchfield 32% Consumer Electronics
Urban Outfitters 32% Apparel
Pizza Hut 31% Restaurants - Quick Serve
Bass Pro Shops 31% Sporting Goods / Outdoors
The Honest Company 30% Health & Beauty
Restoration Hardware 29% Home Goods / Furnishings
CVS Pharmacy 29% Grocery / Pharmacy
Fanatics 28% Apparel
GameStop 27% Specialty Retail
Southwest Airlines 27% Airlines
Kroger 26% Grocery / Pharmacy
Xbox 26% Digital Entertainment
Denny’s 25% Restaurants - Casual
Alaska Airlines 22% Airlines
FreshDirect 21% Grocery / Pharmacy
Arby’s 18% Restaurants - Quick Serve
Etsy.com 17% Specialty Retail
Hilton 15% Hotels
Costco 14% General Merchandise
Newegg 12% Consumer Electronics
Walgreens 11% Grocery / Pharmacy
Spotify 8% Digital Entertainment
Choice Hotels 7% Hotels
Wendy’s 3% Restaurants - Quick Serve
Google Play 0% Digital Entertainment
32APPENDIX B:
Rankings by Retail Product Category
CATEGORY BRAND SCORE
Airlines Delta Air Lines 56%
Air Canada 41%
American Airlines 33%
Apparel Gap 66%
Victoria's Secret 65%
Ann Taylor 57%
Consumer Electronics Best Buy 67%
Crutchfield 32%
Newegg 12%
Department Stores Macy's 65%
Nordstrom 64%
J.C. Penney 63%
Digital Entertainment Fandango 44%
iTunes 43%
XBox 26%
General Merchandise Amazon 79%
QVC 56%
Target 52%
Grocery / Pharmacy Food Lion 51%
CVS Pharmacy 29%
Kroger 26%
Health & Beauty Sephora 75%
Ulta Beauty 63%
Estée Lauder 40%
Home Goods / Furnishings Williams-Sonoma 74%
Bed Bath & Beyond 69%
Wayfair 47%
Home Improvement The Home Depot 63%
Lowe's 51%
Menards 35%
Hotels Marriott 52%
Hyatt Hotels 42%
Omni Hotels & Resorts 37%
33CATEGORY BRAND SCORE
Restaurants - Casual Texas Roadhouse 66%
Applebee's Neighborhood 60%
Grill & Bar
The Cheesecake Factory 60%
Restaurants - Quick Serve Chipotle Mexican Grill 66%
Starbucks 60%
Dunkin' Donuts 57%
Specialty Retail Barnes & Noble 61%
Office Depot 54%
Petco 51%
Sporting Goods / Outdoors REI 66%
lululemon 57%
Under Armour 55%
34APPENDIX C:
Methodology Addendum
At the beginning of the report, we detailed the evaluation process used to develop this
benchmark data. The overall research and buying process for both physical and digital gift
cards on desktop, mobile web and mobile apps was explained. Below we provide further detail
on the additional areas we evaluated, including how maximum scores differed for retailers with
and without commerce-oriented mobile apps.
•M
ERCHANT LIST
The one constant in the retail world is change. Brands rise and fall, a process sped up by the
disruption of e-commerce. This dynamic is reflected in the list of verticals and retailers that
made our cut for the 2018 evaluation.
erchants were selected by NAPCO Research from a variety of sources, including the Forbes
M
2000, Internet Retailer, and Nation’s Restaurant News Top 100. We added a new vertical,
Grocery/Pharmacy, to reflect the increasing strength of this category in the overall retail
marketplace.
•C
RITERIA DETAILS
101 Evaluation Criteria, 205 Max Points (166 w/out App)
DISCOVERABILITY/AWARENESS CHECKOUT / POST PURCHASE B-TO-B PROGRAM
36 POINTS (24 POINTS W/OUT APP) 34 POINTS (30 W/OUT APP) 8 POINTS
•F
indability – homepage/menu • Integrated cart •B
-to-B program findability/details
•F
indability – search •L oyalty program support •B
-to-B program registration
•L
anding page info/aesthetics •P ayment options •B
-to-B available card types
•A
vailability of digital and physical •C heckout and order completion
CREDIT CARD REWARDS
cards •P ost-purchase communication 5 POINTS
Card availability in top credit card
loyalty programs
GIFT CARD OFFERING FLEXIBILITY RECIPIENT EXPERIENCE PROMOTIONS
72 POINTS (49 W/OUT APP) 40 POINTS 6 POINTS
• Faceplate options • Delivery Promotions leveraging gift cards run
in the last year
• Personal message • Brand experience
• Advanced personalization • Redemption options PRODUCT E-GIFTING
4 POINTS
• Denominations • Mobile friendly (digital)
• Delivery time • Security (digital) Brand offers Product e-Gifting
• Self purchase flow (desktop only) • Balance check INNOVATION: BONUS POINTS ONLY
• ADA compliance (desktop only) • Reload
Innovative concepts (extra credit)
• Regift
• Physical card form factors /
packaging options
• Upsell
35•C
RITERIA WEIGHTING
Varying number of points per criteria based on importance (ranging from 1 point to 6 points)
•N
EW CRITERIA
Last year’s study used an impressive set of standards to evaluate the buying process. In 2018,
we added new criteria to even more fully describe the shopping experience.
n a scale of zero to two points, we measured how merchants complied with the Department
O
of Justice’s Americans with Disabilities Act (ADA) Standards for Accessible Design on their
gift card order page as viewed on a desktop computer, using aXe, a tool for accessibility
testing. A higher score shows a commitment to providing a better experience for shoppers
with a disability.
e also looked at the quality of the experience retailers create for consumers buying a gift
W
card for themselves. Scoring on a range of zero to two points was based on how companies
make the buying process easier to complete for a self-purchase, such as eliminating steps or
fields normally needed when purchasing a gift card for others.
•M
OBILE APPS
Retailers with commerce-oriented mobile apps were evaluated with a different maximum
score than those without mobile apps. Criteria that applied to mobile apps weren’t assessed
for those without one, and merchants without mobile apps weren’t penalized. In the final
calculation, merchants with mobile apps were assessed against a maximum score of 205
points; those without a mobile app were assessed against a maximum score of 166.
• I NNOVATION
Merchants received a bonus for innovative initiatives in the purchase, delivery or fulfillment of
gift cards at the discretion of the researcher.
•P
URCHASE GIFT CARDS WITH CREDIT CARD POINTS
Merchants received points for enabling customers to exchange credit card loyalty points
for gift cards. The top five credit card loyalty programs evaluated were American Express,
Discover, Citibank, Chase, and Capital One.
• PROMOTIONS
Merchants were evaluated based on their gift card promotional activity over the last 12
months.
•B
-TO-B
Merchants were evaluated based on whether they had a B-to-B gift card program (i.e., sell
gift cards in bulk to corporate clients). Points were awarded based on the ease of finding
the program on the merchant’s website, ease of signing up, and whether the program was
available for both digital and physical cards.
36WHO Led by a former Forrester Research analyst, the NAPCO
WE
Research team crafts custom data-centric solutions that
leverage our highly engaged audiences across the markets
in which we operate, our industry subject matter experts and
ARE
in-house research expertise. We partner with our clients to
identify their unique business problem and create solutions
that enable deeply informed decision making.
NAPCO Research can help with:
• Business goal prioritization
• Opportunity discovery
• Market segmentation
• Landscape insight
• User needs and wants
• Product features and functionality
• Content marketing strategy
• Sales strategy and tactics
• Market conditions
• Benchmarking
• Industry trends
• Brand awareness
A1811025CashStar is a leading provider of merchant solutions for
gift card ecommerce, supporting multiple touchpoints
across the customer lifecycle. Its award-winning platform,
CashStar Commerce, is a flexible and market-proven
WHO
solution that enables merchants to directly market, sell and
distribute digital and plastic gift cards across channels and
devices. With security, scalability and reliability integral to
WE
the platform’s foundation, CashStar clients can focus more
on creating great customer experiences, growing gift card
revenue and driving omni-channel engagement. CashStar
ARE
clients include top brands like SEPHORA, Starbucks, The
Home Depot, Uber and Walmart. CashStar is a Blackhawk
Network Business. To learn more about CashStar’s solutions,
please visit www.cashstar.com, follow @CashStar or
email info@cashstar.com.
About Blackhawk Network
Blackhawk Network Holdings, Inc. is a global financial
technology company and a leader in connecting brands
and people through branded value solutions. Blackhawk
platforms and solutions enable the management of stored
value products, promotions and rewards programs in
retail, ecommerce, financial services and mobile wallets.
Blackhawk’s Hawk Commerce division offers technology
solutions to businesses and direct to consumers. The Hawk
Incentives division offers enterprise, SMB and reseller partners
an array of platforms and branded value products to incent
and reward consumers, employees and sales channels.
Headquartered in Pleasanton, Calif., Blackhawk operates in 26
countries.
For more information, please visit BlackhawkNetwork.com,
CashStar.com, HawkCommerce.com, HawkIncentives.com
or our product websites GiftCards.com, GiftCardMall.com,
Cardpool.com, GiftCardLab.com and OmniCard.com.
A1811025You can also read