Dual Transcriptomic Analysis Reveals a Delayed Antiviral Response of Haliotis diversicolor supertexta against Haliotid Herpesvirus-1 - AWI
←
→
Page content transcription
If your browser does not render page correctly, please read the page content below
viruses
Article
Dual Transcriptomic Analysis Reveals a Delayed
Antiviral Response of Haliotis diversicolor supertexta
against Haliotid Herpesvirus-1
Chang-Ming Bai 1,2 , Shu-Min Zhang 1,3 , Ya-Na Li 1,4 , Lu-Sheng Xin 1,2 ,
Umberto Rosani 5,6, * and Chong-Ming Wang 1,2, *
 1    Key Laboratory of Maricultural Organism Disease Control, Ministry of Agriculture, Qingdao Key
      Laboratory of Mariculture Epidemiology and Biosecurity, Yellow Sea Fisheries Research Institute,
      Chinese Academy of Fishery Sciences, Qingdao 266071, China; baicm@ysfri.ac.cn (C.-M.B.);
      zhangshumin1223@foxmail.com (S.-M.Z.); lyn19933@163.com (Y.-N.L.); xinls@ysfri.ac.cn (L.-S.X.)
 2    Laboratory for Marine Fisheries Science and Food Production Processes, Qingdao National Laboratory for
      Marine Science and Technology, Qingdao 266237, China
 3    Department of Fisheries and Life Science, Dalian Ocean University, Dalian 116023, China
 4    Department of Fisheries, Tianjin Agriculture University, Tianjin 300380, China
 5    Department of Biology, University of Padua, 35121 Padua, Italy
 6    Alfred Wegener Institute (AWI)—Helmholtz Centre for Polar and Marine Research, Wadden Sea Station Sylt,
      25992 List, Germany
 *    Correspondence: umberto.rosani@unipd.it (U.R.); wangcm@ysfri.ac.cn (C.-M.W.);
      Tel.: +39-049-8276284 (U.R.); +86-532-85823062 (ext. 812) (C.-M.W.)

 Received: 25 February 2019; Accepted: 23 April 2019; Published: 24 April 2019

 Abstract: Haliotid herpesvirus-1 (HaHV-1) is the first identified gastropod herpesvirus, causing a
 highly lethal neurologic disease of abalone species. The genome of HaHV-1 has been sequenced,
 but the functions of the putative genes and their roles during infection are still poorly understood.
 In the present study, transcriptomic profiles of Haliotis diversicolor supertexta at 0, 24 and 60 h post
 injection (hpi) with HaHV-1 were characterized through high-throughput RNA sequencing. A total
 of 448 M raw reads were obtained and assembled into 2.08 × 10⁵ unigenes with a mean length of
 1486 bp and an N50 of 2455 bp. Although we detected increased HaHV-1 DNA loads and active
 viral expression at 24 hpi, this evidence was not linked to significant changes of host transcriptomic
 profiles between 0 and 24 hpi, whereas a rich immune-related gene set was over-expressed at 60 hpi.
 These results indicate that, at least at the beginning of HaHV-1 infection, the virus can replicate with
 no activation of the host immune response. We propose that HaHV-1 may evolve more effective
 strategies to modulate the host immune response and hide during replication, so that it could evade
 the immune surveillance at the early stage of infection.

 Keywords: abalone; transcriptome; immune-related genes; apoptosis; HaHV-1

1. Introduction
     Haliotid herpesvirus-1 (HaHV-1), one of the most devastating viral pathogens of wild and
cultivated abalones, is the first identified herpesvirus that infects gastropods [1,2]. HaHV-1 infection
was first reported in 2003 in Taiwan, where mass mortalities of cultivated Haliotis diversicolor supertexta
were reported [1]. Subsequently, a similar disease was described in the blacklip abalone (Haliotis rubra)
and in the greenlip abalone (Haliotis laevigata) in Australia in 2005 [3]. Two recent studies back-dated
the appearance of HaHV-1 infection to 1999 in H. diversicolor supertexta populations cultivated in
Southern China [4,5]. Histological lesions of HaHV-1 infection were characterized by necrotizing

Viruses 2019, 11, 383; doi:10.3390/v11040383                                     www.mdpi.com/journal/viruses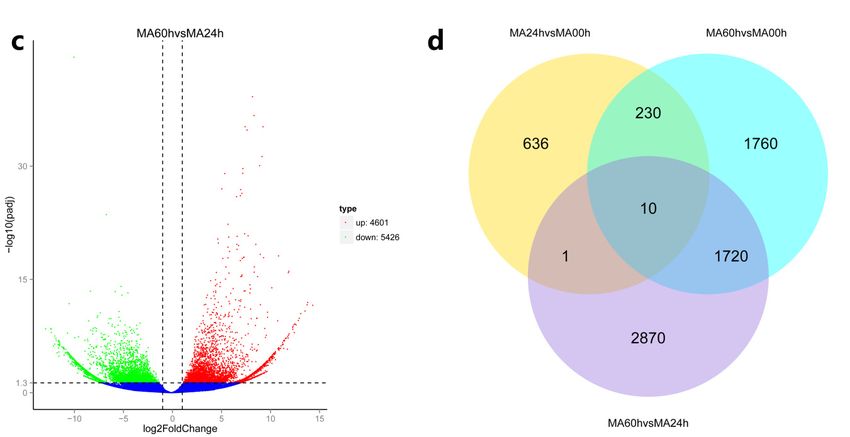
Viruses 2019, 11, 383                                                                                 2 of 14

ganglioneuritis and, therefore, this disease was named Abalone Viral Ganglioneuritis (AVG). Although
the complete genome of HaHV-1 has been sequenced, most of its putative proteins still have unknown
functions [2]. Phylogenetic analysis based on two conserved proteins, the DNA packaging ATPase
subunit of a (putative) terminase and the DNA polymerase, showed that HaHV-1 is closely related
to Ostreid herpesvirus-1 (OsHV-1), the first herpesvirus discovered to infect mollusks [6,7], whereas
HaHV-1 is only distantly related to the other herpesviruses [2]. This great divergence has prevented
the possibility to infer gene functions by homology-based prediction methods [7], greatly limiting the
knowledge on these two herpesviruses.
      Herpesviruses are large dsDNA viruses, often evolved with their host over a long period of
time resulting in a strict host–virus co-adaptation [8]. Vertebrate herpesviruses used many strategies
to circumvent the host immune responses or delay them [9–12]. The infection mechanisms and
the viral and host key genes involved during the infection process have been characterized for a
number of vertebrate herpesviruses, and they were used to develop preventative or therapeutic
measures [9,13]. Conversely, the antiviral responses of mollusks need further work to be extensively
understood [14–18]. The lack of continuous molluscan cell lines supporting viral growth and replication
in vitro greatly hampered the application of the classical virology approaches to these viruses [14].
Molecular approaches and the introduction of next-generation sequencing (NGS) techniques have
increased the possibility to understand viral genomic diversity and transcriptional landscape of
OsHV-1 [19–23]. Dual transcriptomic analysis of the cross-talk between OsHV-1 and bivalve mollusks
active infection processes have been also carried out [16,24–27]. These studies revealed a rich set of
genes and pathways in bivalves, especially in Crassostrea gigas, involved in the immune defense against
OsHV-1 infection [14,16,28–30]. One of the highly noticeable pathways revealed by these studies is
apoptosis [16,18,25], which also plays an important role in eliminating herpesvirus-infected cells in
vertebrates [31–33]. To evade elimination by apoptosis and guarantee viral propagation, herpesviruses
have evolved various strategies to suppress host cell apoptosis. OsHV-1 genome encodes several
putative inhibitors of apoptosis (IAPs) capable of suppressing host apoptosis and allowing its own
replication [7,28]. Moreover, some key anti-apoptotic factors regulating apoptotic signaling pathway
were also over-expressed during OsHV-1 infection [16,25,26,28]. The apoptosis signaling pathway
is certainly not isolated, many other key components associated with antiviral responses, including
interferon pathways, toll-like pathways, and oxidative bursts have been reported in C. gigas [14,16,25].
Another remarkable observation during the interaction between C. gigas and OsHV-1 was that the
early antiviral response (before 24 h after infection) was important to successfully counteract the viral
infection [27].
      Although it is expected that several other herpesviruses that infect invertebrates exist [2], HaHV-1
and OsHV-1 represent the most destructive viral disease of mollusks worldwide [34]. HaHV-1 was less
studied compared to OsHV-1, and no data are available to characterize the molecular mechanisms
underlying the viral pathogenesis and abalone’s countermeasures. In this study, we characterized the
dual transcriptome changes of HaHV-1 and H. diversicolor supertexta at 0, 24, and 60 h post injection (hpi).
We provided an annotated transcriptome of H. diversicolor supertexta and the first insight into its antiviral
pathways. Our analysis indicated an unexpected delay in the immune response to HaHV-1 infection.
Globally, these transcriptomic data provided a valuable resource for the gastropod research community.

2. Materials and Methods
     In April 2016, approx. 400 H. diversicolor supertexta specimens (size range from 49.73 to 58.24 mm,
n = 30) were transferred by air from Xiamen to our aquaculture facilities in Qingdao (YSFRI). The
abalones were derived from hatchery produced seeds reproduced from 50 pairs of parental abalones.
The abalones were cultivated in 50-L tanks (approximately 40 abalones per tank) supplied with
aerated, sand-filtered seawater, and fed with seaweed (Laminaria japonica). The water temperature
was maintained at approximately 18 ◦ C, and half-changed daily during the acclimation period of two
Viruses 2019, 11, 383 3 of 14
weeks. At the end of acclimation, 30 H. diversicolor supertexta were selected randomly and tested to be
negative for HaHV-1 DNA.
For viral inoculum preparation, the standard protocol used for OsHV-1 and described in [35] was
employed except for the use of natural seawater in all dilution steps. A single infected H. diversicolor
supertexta (HaHV-1-CN2003) was used as a source of HaHV-1. This specimen was originally collected
during abnormal mortality outbreaks in Guangdong Province, China in 2003 [5]. Tissue homogenates
for negative controls were prepared using HaHV-1 PCR negative H. diversicolor supertexta animals
applying the same protocol. A small aliquot of each homogenate (200 µL) was used for HaHV-1 DNA
detection and quantification, as described above.
For experimental infection, abalones were “anesthetized” (myo-relaxation) with 10 g/L of MgCl2
and randomly divided into challenged and negative control groups composed by 180 and 70 individuals,
respectively. Once the abalones were relaxed, 100 µL of viral inoculums (1.0 × 10⁴ copies of HaHV-1
DNA/µL) or control tissue homogenates were injected into the pedal muscle using 1 mL micro-syringes
equipped with 18-g needles. A total of 150 challenged abalones distributed in 50 L tanks (50 abalones
per tank) and 40 control abalones maintained in one 50 L tank were used for the time course experiment.
The remaining 30 individuals per group were maintained in 18 L tanks (10 abalones per tank) and
used for monitoring of mortality rates. Mortality was monitored every 12 h after infection, and dead
abalones were removed from the tank.
At each time point (0, 12, 24, 30, 36, 48, 60, and 72 h post injection, hpi), 6 challenged (2 abalones
per tank) and 3 control abalones were randomly sampled. The mantle of each abalone was immediately
dissected and divided into 2 pieces for DNA and RNA extraction. Dead abalones were collected from
each tank and a piece of the mantle was sampled for DNA extraction and HaHV-1 DNA quantification.
The DNA extraction was performed using the TIANampTM Marine Animals DNA Kit (Tiangen Biotech,
Beijing, China), according to the manufacturer’s protocol. The purity and quantity of the isolated DNA
were determined with a Nanodrop 2000 spectrophotometer (Thermo Fischer Scientific, Waltham, USA).
HaHV-1 DNA quantification was carried out by quantitative PCR (qPCR) targeting ORF66 (DNA
polymerase) adapted from the World Organization for Animal Health (OIE) Manual of Diagnostic
Tests for Aquatic Animals, 2017, and fully described by Bai et al (2019). We estimated the HaHV-1
infection burden of each sample as the mean genomic equivalent (GE) score (ng−1 of total DNA).
Mantle tissues of 3 abalones collected at 0, 24, and 60 hpi were selected for RNA-seq according to
the measured trend of viral infection burden. The 9 RNA samples were designated as MA00h (1–3),
MA24h (1–3), and MA60h (1–3) and sent to Beijing Novogene Technology Co. Ltd. (Beijing, China).
for RNA extraction and high-throughput sequencing using the Illumina Hiseq platform (Illumina
Inc. San Diego, USA). A total amount of 1.5 µg RNA per sample was used as the input material for
the library preparations, which were generated using the NEBNext® Ultra™ RNA Library Prep Kit
for Illumina® (NEB, Ipswich, USA) following the manufacturer’s recommendations. Index codes
were added to attribute the reads to each sample. Briefly, mRNA was purified from total RNA using
poly-T oligo-attached magnetic beads (NEB). Fragmentation was carried out using divalent cations
under elevated temperature in a NEB NextFirst® Strand Synthesis Reaction Buffer (5×). First strand
cDNA was synthesized using random hexamer primers and M-MuLV Reverse Transcriptase (RNase
H, NEB). Second strand cDNA synthesis was subsequently performed using DNA Polymerase I and
RNase H (NEB). The remaining overhangs were converted into blunt ends via exonuclease/polymerase
activities (NEB). After adenylation of the 3’ ends of the DNA fragments, NEBNext® adaptors with
hairpin loop structure were ligated to DNA. To select fragments of preferentially 250~300 bp in length,
the library fragments were purified with AMPure XP system (Beckman Coulter, Brea, USA). Then 3 µL
USER Enzyme (NEB) was used with size-selected, adaptor-ligated cDNA at 37 ◦ C for 15 min followed
by 5 min at 95 ◦ C before PCR. Subsequently, PCR was performed with Phusion High-Fidelity DNA
polymerase (NEB), Universal PCR primers, and Index (X) Primer (NEB). At last, PCR products were
purified with AMPure XP system (Beckman Coulter) and library quality was assessed on the Agilent
Bioanalyzer 2100 system (Agilent Technologies, Palo Alto, CA, USA). The clustering of the index-codedViruses 2019, 11, 383 4 of 14
samples was performed on a cBot Cluster Generation System using TruSeq PE Cluster Kit v3-cBot-HS
(Illumina Inc.) according to the manufacturer’s instructions and sequencing was carried out on an
Illumina Hiseq platform (2 × 150 paired-end reads).
Raw Illumina reads were trimmed to remove adaptor sequences, low-quality positions (Phred
quality of 20 was used as a cut-off), and reads containing poly-n and reads shorter than 50 bp.
The resulting high-quality (HQ) reads were deposited at the NCBI SRA Database and used in the
downstream analyses. Since there is no reference genome available for H. diversicolor supertexta, and
only 30–32 % of the reads can be mapped to the only available genome of Haliotis family [36], we applied
a reference-independent strategy. De-novo transcriptome assembly was performed with the Trinity
assembler (v.2.4.0) [37] setting min_kmer_cov to 2 and all other parameters to defaults. The obtained
unigenes were functionally annotation searching for similar hits in seven databases: Nr (NCBI
non-redundant protein sequences, e-value = 1e−5 ), Nt (NCBI non-redundant nucleotide sequences,
e-value = 1e−5 ), KO (KEGG Orthology database, e-value = 1e−10 ), GO (Gene Ontology, e-value = 1e−6 ),
KOG (euKaryotic Ortholog Groups, e-value = 1e−3 ), Pfam (Protein family, e-value = 1e−2 ), and
Swiss-Prot (e-value = 1e−5 ).
To produce an expression profile of the HaHV-1 genes, the clean reads were mapped on the
HaHV-1 genome (GenBank No. KU096999) with the recently improved annotation [38], applying 0.8
for both length and similarity mapping parameters (CLC Genomics, v.11, Qiagen, Hilden, Germany).
The total number of mapped reads was used as a proxy of the HaHV-1 expression value for each of the
annotated genes and compared between the 3 experimental groups. In order to classify the viral genes
as early or late-expressing genes, we considered the expression ratios between the time points. Briefly,
we measured the expression ratio between 24 hpi and 0 hpi, and between 60 hpi and 24 hpi for each
viral gene, and compared these two values in order to classify the viral genes as ‘early-expressed’ (the
ones with a 24/0 value higher than 10 timed the 60/24 value), ‘late-expressed’ (the ones with a 60/24
value higher than the 24/0 value), or stable (the remaining expressed genes, i.e., the ones with a 24/0
value slightly higher than the 60/24 value).
Differential expression analysis was performed using the DESeq R package (v.1.10.1). DESeq
provides statistical routines for determining differential expression in digital gene expression data
using a model based on the negative binomial distribution. The resulting p values were adjusted using
the Benjamini and Hochberg’s approach for controlling the false discovery rate. Genes with an adjusted
p-value < 0.05 found by DESeq were considered as differentially expressed and a pathway enrichment
analysis based on the KEGG database annotations was performed on them. GO enrichment analysis was
carried out with GOseq R packages based Wallenius non-central hyper-geometric distribution, which
can adjust for gene length bias in differentially expressed genes (DEGs) [39]. Finally, KOBAS software
was used to test the statistical enrichment of differential expression genes in KEGG pathways [40].
To validate the expression values obtained by RNA-seq analysis, 8 DEGs were selected for reverse
transcription quantitative PCR (RT-qPCR) conformation. These DEGs meet the following 3 criteria:
(i) involved in immune-related pathways, (ii) have high/middle expression levels, (iii) perfect PCR
efficiencies ranged from 95 % to 100 %. Primers were designed with Primer Premier 5 (Table S1) [41].
First strand cDNA was synthesized from 2 µg of total RNA with reverse transcriptase (Takara, Shiga,
Japan) and random primers, and the resulting products were used as a template for qPCR analysis.
qPCR was performed on CFX Connect™ Real-Time System (Bio-Rad Laboratories, Inc. Hercules,
USA) with FastStart Essential DNA Green Master (Roche Diagnostics, Risch-Rotkreuz, Swiss). qPCR
reactions were performed in 20 µL reaction system under the following thermal cycling conditions:
1 cycle of 95 ◦ C for 10 min, followed by 40 cycles of 95 ◦ C for 10 s, and 61 ◦ C for 33 s and a melt curve step
(from 65 ◦ C, gradually increasing 0.5 ◦ C/s to 95 ◦ C, with acquisition data every 1 s). Cytc1 were used as
the internal standards to normalize the relative expression levels among samples (Zhang SM et al. [42]).
All reactions were performed in triplicates and the expression values were calculated as the mean of
relative mRNA expression using the 2−∆∆CT method [43].Viruses 2019, 11, 383 5 of 14
3. Results and Discussion
3.1. Abalone Mortalities and Viral DNA Quantification
We tested the susceptibility of H. diversicolor supertexta to HaHV-1 by performing a controlled
infection trial. While no mortality occurred during the acclimation period, after HaHV-1 infection the
first mortality occurred at 48 hpi (6.7% mortality) and developed quickly for the challenged group,
reaching 100 % of mortality at 96 hpi. The accumulative mortality rates were 13.3, 76.7, and 80.0 %
at 60, 72, and 84 hpi, respectively. The average amount of viral DNA was estimated as 1.05 × 10⁶
copies ng−1 of total DNA in the mantles of dead abalone. In the HaHV-1 challenged group, the viral
DNA exponentially increase after injection and reached averages of 45.9, 1.5 × 10⁶ , 4.3 × 10⁶ , 5.6 × 10⁶ ,
2.2 × 10⁷ , 6.5 × 10⁷ , and 8.0 × 10⁶ at 12, 24, 30, 36, 48, 60, and 72 hpi, respectively. No mortality or viral
DNA was detected in the negative controls at the completion of the experiment. The rapid increase of
viral DNA, as well as the high mortality rates, indicated that the experimental infection was successful
and that the abalone family we used was highly susceptible to HaHV-1 infection.
3.2. Transcriptome Assembly and Functional Annotation
A total of 448 M raw reads were generated from the nine sequenced libraries, with 155 M, 143 M,
and 150 M reads from MA00h, MA24h, and MA60h groups, respectively (Table 1, NCBI SRA accession
number: PRJNA514990 and PRJNA471241). After removing low-quality reads, we de novo assembled
435 M of clean reads. into 2.08 × 10⁵ unigenes, showing a mean length of 1486 bp and an N50 of
2455 bp. Among these, 5.25 × 10⁴ unigenes (25.2%) were in the length range of 200 to 500 bp, 6.02 ×
104 unigenes (28.9%) were between 500 to 1000 bp, 4.82 × 10⁴ unigenes (23.2%) were between 1 to 2 kb,
and 4.72 × 10⁴ unigenes (22.7%) were longer than 2 kb (Figure 1).
Table 1. Summary of the sequencing and assembly results.
Group Sample Raw Reads Clean Reads Clean Bases Error (%) Q20 (%) Q30 (%) GC (%)
MA01 48,448,828 46,980,888 7.05G 0.02 96.66 91.55 44.66
MA00h MA02 46,479,558 44,978,850 6.75G 0.01 97.43 93.28 45.49
MA03 59,916,192 58,047,078 8.71G 0.02 97.31 93.01 44.71
MA13 44,682,338 43,431,308 6.51G 0.02 97.2 92.7 43.94
MA24h MA14 49,698,546 48,290,308 7.24G 0.02 97.13 92.52 44.02
MA15 49,009,274 47,443,952 7.12G 0.02 97.26 92.77 43.23
MA49 51,712,402 50,051,266 7.51G 0.02 97.17 92.69 46.16
MA60h MA50 41,758,974 40,566,558 6.08G 0.02 96.7 91.62 45.68
MA51 56,555,122 54,822,210 8.22G 0.01 97.37 93.12 44.81
Since there is no reference genome available for H. diversicolor supertexta, or for relative species,
the assembled unigenes were subjected to functional annotation by matching them against Nr, NT, KO,
Swiss-prot, Pfam, GO, and KOG databases. As a result, 131,904 unigenes (63.37%) were annotated in at
least one database, while 6029 unigenes (2.89%) were annotated in all the seven databases. The matching
rates for the specific database were listed in Table 2. Regarding the homology search against the Nr
database, 26.1% of unigenes had top matches with the owl limpet (Lottia gigantea), followed by C.
gigas (21.9%), California sea hare (Aplysia californica) (17.3%), purple sea urchin (Strongylocentrotus
purpuratus) (1.9%), Florida lancelet (Branchiostoma floridae) (1.7%), or with other species (31.0%) (Table
S2). These annotation results mirrored the few sequence information available for the Haliotidae
family, since the only transcriptome dataset of H. diversicolor supertexta was produced to investigate
early development stages (larva and spat) [44]. Therefore, the transcriptomic data generated in the
present study will enrich the available resources of this species and will contribute to disclose the
abalones’ immune-related pathways.MA03 59,916,192 58,047,078 8.71G 0.02 97.31 93.01 44.71
MA13 44,682,338 43,431,308 6.51G 0.02 97.2 92.7 43.94
MA24h MA14 49,698,546 48,290,308 7.24G 0.02 97.13 92.52 44.02
MA15 49,009,274 47,443,952 7.12G 0.02 97.26 92.77 43.23
MA49 51,712,402 50,051,266 7.51G 0.02 97.17 92.69 46.16
MA60h
Viruses MA50
2019, 11, 383 41,758,974 40,566,558 6.08G 0.02 96.7 91.62 45.68
6 of 14
MA51 56,555,122 54,822,210 8.22G 0.01 97.37 93.12 44.81
Figure 1. Length distribution of assembled unigenes.
Table 2. Summary statistics of the Haliotis diversicolor supertexta transcriptome annotation.
Number of Percentage of
Database
Annotated Unigenes Annotated Unigenes (%)
Annotated in Nr 40,934 19.66
Annotated in NT 71,597 34.39
Annotated in KO 29,322 14.08
Annotated in SwissProt 57,899 27.81
Annotated in Pfam 81,908 39.35
Annotated in GO 82,047 39.41
Annotated in KOG 29,895 14.36
Annotated in all databases 6029 2.89
Annotated in at least one database 131,904 63.37
Total unigenes 208,144 100.00
In order to investigate the immune system of H. diversicolor supertexta, we further identified genes
and pathways involved in immunity. GO classification analysis revealed that 1870 and 22,556 unigenes
belong to “immune system process” and “response to stimulus”, respectively (Table S3), while
KEGG pathways analysis revealed 16 immune-related pathways including 1694 unigenes (Table S4).
Additionally, several pathways classified under the general term of as “signal transduction” are also
known to be involved in immune processes of mollusks, like the “HIF-1 signaling pathway”, “Jak-STAT
signaling pathway”, “NF-kappa B signaling pathway”, and “PI3K-Akt signaling pathway”.
3.3. Analysis of the HaHV-1 Expression Profile
Read mapping on the HaHV-1 genome identified 1431, 141,047, and 5,872,081 viral reads in the 0,
24 and 60 hpi samples, respectively. The presence of read mapping on the HaHV-1 genome even in
the 0 hpi samples (before injection) is due to their mapping to low-complexity repeats on the viral
genome. Total mapped reads per gene, used as a proxy of viral gene expression levels, exhibited
negligible values at 0 hpi (0–39), increased values at 24 hpi (1–9012, median 205), and reached the
highest values for most of the annotated genes at 60 hpi (1–175,765, median 9372, Table S5). Although
the viral expression appeared to diffuse along the whole HaHV-1 genome both at 24 and 60 hpi,Viruses 2019, 11, 383 7 of 14
we attempted to classify early and late viral genes. To do this, we measured the expression ratios for
each gene between the time points. This analysis revealed only 8 HaHV-1 genes with a prevalent ‘early’
expression trend, namely 7 ORFs with unknown function and one IAP. Most of the HaHV-1 ORFs
exhibited somewhat stable expression trends among the tested time points (64 genes) or a preferential
expression at 60 hpi (45 genes). These results are in agreement with the expression profiles that we
recently published based on 37 selected HaHV-1 ORFs [38]. Although in-vivo analysis prevents the
possibility to have synchronous viral infections due to the variability within cells and animals, this
analysis identified viral genes preferentially induced in the early infection and can be used for future
comparisons with similar viruses. Up-regulated viral IAPs were reported also for in bivalve species
infected with OsHV-1 [25–27]. In a detailed study recently published, de Lorgeril et al. (2018) analyzed
transcriptomic features of susceptible versus OsHV-1-resistant C. gigas families and showed that the
expressions of both endogenous and viral IAPs were significantly up-regulated in susceptible families
starting from 24 hpi, while IAPs are not modulated in the resistant family. They suggested that this
difference can explain a delayed and inefficient antiviral response of the susceptible oysters [27].
3.4. Analysis of DEGs Related to Immune Activities
Based on differential expression analysis, pairwise comparisons were carried out among the three
groups (MA00h, MA24h, and MA60h). A total of 7227 and 6914 unigenes were classified as significantly
up-regulated or down-regulated in at least one comparison pair, whereas only 10 up-regulated and
22 down-regulated DEGs are common to all comparisons (Figure 2, Table S6). In details, the comparison
between MA60h/MA00h vs. MA60h/MA24h exhibited the highest number (1730) of up-regulated
DEGs, followed by that of MA60h/MA00h vs. MA24h/MA00h (240), and between MA60h/MA24h
vs. MA24h/MA00h (11). The number of DEGs for each comparison is visualized in Figure 2d. It is
interesting that 4601 up-regulated and 5426 down-regulated DEGs were identified when comparing
MA60h and MA24h groups, which are higher numbers than those obtained comparing MA60h and
MA00h groups (3720 up-regulated and 2392 down-regulated DEGs).
Viruses 2019, 11, x FOR PEER REVIEW 8 of 15
Figure 2. Cont.Viruses 2019, 11, 383 8 of 14
Figure Volcano
2. 2.
Figure VolcanoandandVenn
Vennplots
plotsof
ofdifferentially
differentially expressed genes(DEGs).
expressed genes (DEGs).(a)
(a)Volcano
Volcano plots
plots of of DEGs
DEGs
comparing
comparing MA24h
MA24hand andMA00h
MA00hgroups;
groups; (b)
(b) Volcano plots
plots of
of DEGs
DEGscomparing
comparingMA60h
MA60h and
and MA00h
MA00h
groups;
groups; (c)(c) Volcanoplots
Volcano plotsofofDEGs
DEGscomparing
comparing MA60h
MA60h andand MA24h
MA24hgroups;
groups;(d)
(d)Venn
Venngraph
graphof of
DEGs
DEGs
among
among thethe different
different comparisons.Red
comparisons. Redspots
spots in
in panels (a),
(a), (b),
(b),and
and(c)
(c)depicted
depictedover-DEGs,
over-DEGs,green
greenspots
spots
under-DEGs, whereas blue spots referred to non-differentially expressed
under-DEGs, whereas blue spots referred to non-differentially expressed genes. genes.
3.4.1. The
3.4.1. Delayed
The DelayedImmune
ImmuneResponse
Responseof
of Abalone to HaHV-1
Abalone to HaHV-1 Infection
Infection
Although
Although 877
877and
and483483unigenes
unigeneswere
were identified
identified asas up-regulated
up-regulatedand anddown-regulated
down-regulated when
when wewe
compared
compared MA24h
MA24hvs.vs.MA00h
MA00hgroups,
groups, nono GO
GO terms withwith significant
significantchanges (p-value< <
changes(p-value 0.05)
0.05) werewere
identified(Table
identified (TableS7).
S7). Accordingly,
Accordingly,KEGG KEGGpathway
pathway enrichment analysis
enrichment showed
analysis no significantly
showed up-
no significantly
regulated pathway
up-regulated (q-value<Viruses 2019, 11, 383 9 of 14
either by diffusion through the extracellular space (cell-free mode) or by direct cell–cell contact (cell-cell
mode) [46,47]. Both mechanisms of viral spread have advantages and disadvantages [47]. The cell-free
mode is often inefficient and more vulnerable to the host immune surveillance, because they have to
overcome cellular barriers in both donor and target cells. However, the cell-free mode is necessary for
spread across long distances and to a new host. The cell-cell mode is very efficient because the barriers
could be circumvented by direct cell-to-cell transmission, while the cell-cell mode could be only used
within an organism [47]. The cell-cell mode has been recognized as a means to avoid neutralizing
Viruses 2019, 11, x FOR PEER REVIEW 9 of 15
antibodies by vertebrate herpesvirus [48]. No data is available about the spreading mechanisms
ofantiviral
HaHV-1response
within an abalone
was or among
inefficient different
to protect individuals.
the animals, However, fewer
and approximately 50% cases of enveloped
mortality occurred
HaHV-1 particles were reported [1,5,49,50] compared to that of enveloped OsHV-1 particles
within the following 12 h (from 60 hpi to 72 hpi). This temporal pattern of infection is similar [51–53].
to theIt
is,one
therefore,
observed possible that the
for highly cell-cell spreading
susceptible was more
C. gigas families, i.e.,frequently employed
the deficiency by HaHV-1,
of early antiviral and could
response
beagainst
partially responsible for the lack of early immune response.
OsHV-1 and an intense but inefficient later antiviral responses [27].
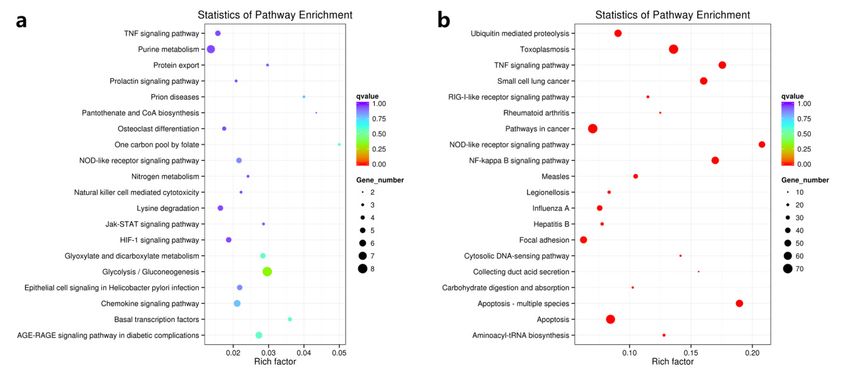
Figure 3. Scatter plot of KEGG enrichment analysis of differentially expressed genes (DEGs) between
Figure and
MA24h 3. Scatter
MA00hplot(a),
of KEGG
MA60h enrichment
and MA00h analysis
(b) andof differentially
MA60h and MA24h expressed(c).genes
Top (DEGs) between
20 up-regulated
MA24h and MA00h (a), MA60h and MA00h (b) and MA60h and MA24h (c). Top
KEGG pathways were displayed. The larger the Rich factor, the greater the degree of enrichment. The20 up-regulated
KEGG
value pathways
range wereisdisplayed.
of q value The larger
(0,1). The closer thezero,
it is to Richthe
factor,
more the greater the
significant degree
the of enrichment.
enrichment The
is. Pathways
value range of qvalue is (0,1). The closer it is to zero, the more significant
with q ≤ 0.05 are defined as pathways that are significantly enriched in DEGs. the enrichment is. Pathways
with q ≤ 0.05 are defined as pathways that are significantly enriched in DEGs.
3.4.2. A Rich Set of Immune-Related Pathways in Abalone in Response to HaHV-1 Infection
The lack of early immune response (before 24 hpi) associated with a considerable viral load is
Between MA60h and MA00h groups, there were 3720 up-regulated and 2392 down-regulated
unusual in virally-infected mollusks. This result cannot be explained by the high susceptibility of
unigenes, respectively. GO term enrichment analysis showed that most of them were classified into
abalone alone. Actually, the early immune response has been reported even for the C. gigas family
with the highest susceptibility to OsHV-1 infection, although the level was significantly lower than
that of resistant families [16,27]. The lack of immune response observed here may, therefore, be
explained by more effective HaHV-1 immune evasion strategies. Higher vertebrate herpesviruses are
equipped with sophisticated immune evasion strategies, which include the establishment of latency,
molecular mimicry, virus-induced immunosuppression, and modulation of immune recognitionViruses 2019, 11, 383 10 of 14
two GO categories (biological process and molecular function) with a p-value < 0.05 (Table S8). Further
KEGG pathway analysis classified the up-regulated DEGs into 261 pathways (Table S9), and 26 of
them were found to be significantly up-regulated with a q-value < 0.05 (Table 3). The top 20 most
up-regulated pathway terms are shown in Figure 3b. Among the 26 significantly enriched pathways,
21 were associated with immunity and disease process and five were related metabolic process.
Comparison of MA60h and MA24h groups revealed similar over-expression patterns with MA60h and
MA00h groups (Table 3 and Figure 3). These results further indicated that MA24h and MA00h groups
have similar transcriptomic profiles and the lack of immunity at 24 hpi.
Table 3. Significant up-regulated pathways in Haliotis diversicolor supertexta at 60 hpi.
MA60h VS MA00h MA60h VS MA24h
Pathway Name Pathway ID Rich Gene Rich
q Value q Value Gene No.
Factor No. Factor
Apoptosis—multiple species ko04215 0.19 1.80E-18 54 0.20 7.33E-15 57
TNF signaling pathway ko04668 0.18 3.21E-18 56 0.19 7.33E-15 60
NOD-like receptor signaling pathway ko04621 0.21 3.21E-18 48 0.21 4.48E-14 49
NF-kappa B signaling pathway ko04064 0.17 1.64E-17 55 0.16 2.12E-11 53
Toxoplasmosis ko05145 0.14 2.02E-17 69 0.15 3.14E-14 76
Small cell lung cancer ko05222 0.16 1.05E-16 55 0.17 5.89E-13 58
Apoptosis ko04210 0.08 2.61E-08 67 0.10 9.32E-07 77
Ubiquitin mediated proteolysis ko04120 0.09 1.12E-07 54 0.12 2.03E-09 71
Measles ko05162 0.10 3.44E-06 34 0.12 1.74E-05 39
Pathways in cancer ko05200 0.07 7.87E-06 70 0.09 1.65E-07 94
Aminoacyl-tRNA biosynthesis ko00970 0.13 4.28E-05 21 0.16 1.45E-05 26
RIG-I-like receptor signaling pathway ko04622 0.11 0.0003 20 0.16 4.55E-06 28
Influenza A ko05164 0.08 0.0003 41 0.08 0.0122 44
Cytosolic DNA-sensing pathway ko04623 0.14 0.0003 15 0.16 0.0007 17
Rheumatoid arthritis ko05323 0.13 0.0020 14 0.12 0.0469 13
Focal adhesion ko04510 0.06 0.0024 52 / / /
Collecting duct acid secretion ko04966 0.16 0.0033 10 / / /
Legionellosis ko05134 0.08 0.0033 24 0.13 1.90E-05 36
Carbohydrate digestion and
ko04973 0.10 0.0043 16 / / /
absorption
Hepatitis B ko05161 0.08 0.0057 25 0.11 0.0007 34
Epstein-Barr virus infection ko05169 0.06 0.0057 34 0.11 9.32E-07 56
Cysteine and methionine metabolism ko00270 0.09 0.0064 20 / / /
Ribosome biogenesis in eukaryotes ko03008 0.09 0.0098 17 / / /
Starch and sucrose metabolism ko00500 0.09 0.0115 17 / / /
Hepatitis C ko05160 0.08 0.0157 18 0.12 0.0009 26
Herpes simplex infection ko05168 0.06 0.049 25 0.10 0.0006 39
Antigen processing and presentation ko04612 / / / 0.14 6.49E-05 26
Protein processing in endoplasmic
ko04141 / / / 0.08 0.0100 48
reticulum
Toll-like receptor signaling pathway ko04620 / / / 0.10 0.0082 25
Osteoclast differentiation ko04380 / / / 0.10 0.0162 23
Endocytosis ko04144 / / / 0.08 0.0247 47
Phenylalanine, tyrosine and
ko00400 / / / 0.20 0.0299 7
tryptophan biosynthesis
RNA transport ko03013 / / / 0.08 0.0414 39
Terpenoid backbone biosynthesis ko00900 / / / 0.15 0.0414 9
The items printed in normal were pathways associated with immunity and disease process due to HaHV-1 infection,
the pathways printed in bold and italic were pathways associated with metabolic process and proposed to be
up-regulated due to the viral infection. The forward slash ‘/’ indicated the absence of data, since thesepathways
were not significantly up-regulated at the specific time points compared to the control group (MA00h).
Ten of the 21 immuno-associated pathways are involved in immunity against virus infection.
Seven of these pathways are also well-known in mollusks’ immune defense against pathogenic
infections, which include apoptosis, TNF, NOD-like, NF-kappa B, Ubiquitin-mediated proteolysis,
RIG-I-like, etc. [16,24–26]. Another three pathways, including aminoacyl-tRNA biosynthesis [54], focal
adhesion [55], and cytosolic DNA-sensing pathway [56], have been reported to be associated with
antiviral response in vertebrate animals. These results indicated that there are a rich set of genes
involved in the antiviral response in abalone. The specific role of these pathways in the antiviral process
needs further investigation. A considerable number of immune-related genes were also detected
in susceptible C. gigas compared to resistant individuals after 24 h post-infection [27]. This kind ofViruses 2019, 11, 383 11 of 14
massive and extensive reprogramming of transcriptomes is unusual for organisms and it will demand
a huge amount of energy, which may accelerate the disease process [57]. Accordingly, we identified
five up-regulated pathways related to metabolic process, and approximately 50% mortality occurred
between 60 and 72 hpi. These results indicate that late activation of immune genes, although in large
quantities, was insufficient to conquer the virus and maintain the cellular homeostasis. As a result,
several pathways involved in the disease process were over-represented, which indicated that cell and
tissue lesions have fully developed, and stood for signals of the immune failure.
A rich gene set associated directly with viral replication and assembly were also identified
in challenged abalone at 60 hpi. GO term enrichment analysis identified 11 terms interpreted
as viral tegument proteins with a significant p-value = 0.0161 compared to the negative control.
Additionally, many viral structure proteins associated with viral envelop, membrane, and capsid were
also over-expressed at 60 hpi (Table S8). Viral structural proteins are often necessary for the activation
of host antiviral response [58]. Therefore, we proposed that during HaHV-1 infection, more and more
host cells died, and the accumulated structural proteins of the virus were released out of cells, which
should be responsible for the massive enrichment of host immune-related genes.
3.5. Validation of RNA-Seq Results by RT-qPCR
Since the detection limit of RT-qPCR is relatively low compared to RNA-Seq, only unigenes with
high/middle expression levels could be used for RT-qPCR validation. The relative expression values of
RT-qPCR and RNA-seq were described as the log2 (fold change). Our results show that 22 out of the
total 24 selected genes exhibited a concordant trend between RT-qPCR and RNA-seq expression values.
The correlation between the expression levels of RT-qPCR and RNA-seq are shown in Figure S1.
4. Conclusions
In the present study, we sequenced the transcriptomes of H. diversicolor supertexta infected with
HaHV-1 and we investigated virus–host interactions at a molecular level. This work represents the first
step towards elucidating the immune mechanisms of abalone against HaHV-1. Unexpected delays of
the abalone antiviral response suggested that HaHV-1 has evolved effective strategies to evade early
immune surveillance. The over-expressed host genes at the late stages of the infection will provide
useful information to understand the molecular mechanisms of the antiviral response of gastropod
against dsDNA viruses.
Supplementary Materials: The following are available online at http://www.mdpi.com/1999-4915/11/4/383/s1,
Figure S1. Validation of transcriptomic differentially expressed genes (DEGs) by RT-qPCR. Table S1. Primers
used for RT-qPCR validation of RNA-Seq results. Table S2. Functional annotation of the assembled unigenes.
Table S3. GO annotation of the Haliotis diversicolor supertexta transcriptome. Table S4. KEGG annotation of the
Haliotis diversicolor supertexta transcriptome. Table S5. Expression of HaHV-1 genes. Table S6. List of differentially
expressed genes (DEGs) with annotations and expression values Table S7. GO annotation for up-regulated DEGs
between MA24h and MA00h groups Table S8. GO annotation for up-regulated DEGs between MA60h and MA00h
groups Table S9. KEGG pathway assignment up-regulated DEGs between MA60h and MA00h groups
Author Contributions: Conceptualization, C.-M.B. and U.R.; methodology, C.-M.B., S.-M.Z., Y.-N.L., U.R.;
software, U.R. and C.-M.B.; validation, C.-M.W., L.-S.X.; writing—original draft preparation, C.-M.B. and U.R.;
writing—review and editing, C.-M.B. and U.R.; supervision, C.-M.W.; funding acquisition, C.-M.B., U.R., and
C.-M.W.
Funding: C.-M.B. was supported by the Laboratory for Marine Fisheries Science and Food Production Processes,
grant number 2016LMFS-B16. C.-M.W. was supported by China Agriculture Research System, grant number
CARS-49. U.R. was supported by a biennial grant of the University of Padova, UNIPD-BIRD 168432.
Acknowledgments: We are grateful to Wei-Wei You from Xiamen University for providing us Haliotis diversicolor
supertexta specimen and technical assistance about abalone cultivation. We also thank Jie Shi and Wen-Hui Gao for
maintaining of abalone and collecting samples.
Conflicts of Interest: The authors declare no conflict of interest.Viruses 2019, 11, 383 12 of 14
References
1. Chang, P.H.; Kuo, S.T.; Lai, S.H.; Yang, H.S.; Ting, Y.Y.; Hsu, C.L.; Chen, H.C. Herpes-like virus infection
causing mortality of cultured abalone Haliotis diversicolor supertexta in Taiwan. Dis. Aquat. Organ. 2005, 65,
23–27. [CrossRef] [PubMed]
2. Savin, K.W.; Cocks, B.G.; Wong, F.; Sawbridge, T.; Cogan, N.; Savage, D.; Warner, S. A neurotropic herpesvirus
infecting the gastropod, abalone, shares ancestry with oyster herpesvirus and a herpesvirus associated with
the amphioxus genome. Virol. J. 2010, 7, 1–9. [CrossRef] [PubMed]
3. Hooper, C.; Hardy-Smith, P.; Handlinger, J. Ganglioneuritis causing high mortalities in farmed Australian
abalone (Haliotis laevigata and Haliotis rubra). Aust. Vet. J. 2007, 85, 188–193. [CrossRef] [PubMed]
4. Wang, J.; Guo, Z.; Feng, J.; Liu, G.; Xu, L.; Chen, B.; Pan, J. Virus infection in cultured abalone, Haliotis
diversicolor Reeve in Guangdong Province, China. J. Shellfish Res. 2004, 23, 1163–1168.
5. Bai, C.M.; Li, Y.N.; Chang, P.H.; Jiang, J.Z.; Xin, L.S.; Li, C.; Wang, J.Y.; Wang, C.M. Susceptibility of two
abalone species, Haliotis diversicolor supertexta and Haliotis discus hannai, to Haliotid herpesvirus 1
infection. J. Invertebr. Pathol. 2019, 160, 26–32. [CrossRef] [PubMed]
6. Le Deuff, R.M.; Renault, T. Purification and partial genome characterization of a herpes-like virus infecting
the Japanese oyster, Crassostrea gigas. J. Gen. Virol. 1999, 80, 1317–1322. [CrossRef]
7. Davison, A.J.; Trus, B.L.; Cheng, N.; Steven, A.C.; Watson, M.S.; Cunningham, C.; Le Deuff, R.M.; Renault, T.
A novel class of herpesvirus with bivalve hosts. J. Gen. Virol. 2005, 86, 41–53. [CrossRef] [PubMed]
8. Davison, A.J. Evolution of the herpesviruses. Vet. Microbiol. 2002, 86, 69–88. [CrossRef]
9. Banks, T.A.; Rouse, B.T. Herpesviruses—Immune escape artists? Clin. Infect. Dis. 1992, 14, 933–941.
[CrossRef]
10. Griffin, B.D.; Verweij, M.C.; Wiertz, E.J. Herpesviruses and immunity: The art of evasion. Vet. Microbiol.
2010, 143, 89–100. [PubMed]
11. Verweij, M.C.; Ressing, M.E.; Knetsch, W.; Quinten, E.; Halenius, A.; van Bel, N.; Hengel, H.; Drijfhout, J.W.;
van Hall, T.; Wiertz, E.J. Inhibition of mouse TAP by immune evasion molecules encoded by non-murine
herpesviruses. Mol. Immunol. 2011, 48, 835–845. [CrossRef]
12. Ma, G.; Azab, W.; Osterrieder, N. Equine herpesviruses type 1 (EHV-1) and 4 (EHV-4)–masters of co-evolution
and a constant threat to equids and beyond. Vet. Microbiol. 2013, 167, 123–134. [CrossRef] [PubMed]
13. Horst, D.; Ressing, M.E.; Wiertz, E.J. Exploiting human herpesvirus immune evasion for therapeutic gain:
Potential and pitfalls. Immunol. Cell Biol. 2011, 89, 359–366. [CrossRef] [PubMed]
14. Green, T.J.; Speck, P. Antiviral Defense and Innate Immune Memory in the Oyster. Viruses 2018, 10, 133.
[CrossRef] [PubMed]
15. Moreau, P.; Moreau, K.; Segarra, A.; Tourbiez, D.; Travers, M.A.; Rubinsztein, D.C.; Renault, T. Autophagy
plays an important role in protecting Pacific oysters from OsHV-1 and Vibrio aestuarianus infections.
Autophagy 2015, 11, 516–526. [CrossRef] [PubMed]
16. Segarra, A.; Mauduit, F.; Faury, N.; Trancart, S.; Dégremont, L.; Tourbiez, D.; Haffner, P.; Barbosa-Solomieu, V.;
Pepin, J.F.; Travers, M.A.; et al. Dual transcriptomics of virus-host interactions: Comparing two Pacific
oyster families presenting contrasted susceptibility to ostreid herpesvirus 1. BMC Genomics 2014, 15, 580.
[CrossRef] [PubMed]
17. Renault, T.; Faury, N.; Barbosa-Solomieu, V.; Moreau, K. Suppression substractive hybridisation (SSH) and
real time PCR reveal differential gene expression in the Pacific cupped oyster, Crassostrea gigas, challenged
with Ostreid herpesvirus 1. Dev. Comp. Immunol. 2011, 35, 725–735. [CrossRef]
18. Segarra, A.; Baillon, L.; Tourbiez, D.; Benabdelmouna, A.; Faury, N.; Bourgougnon, N.; Renault, T. Ostreid
herpesvirus type 1 replication and host response in adult Pacific oysters, Crassostrea gigas. Vet. Res. 2014, 45,
103. [CrossRef]
19. Bai, C.M.; Morga, B.; Rosani, U.; Shi, J.; Li, C.; Xin, L.S.; Wang, C.M. Long-range PCR and high-throughput
sequencing of Ostreid herpesvirus 1 indicate high genetic diversity and complex evolution process. Virology
2019, 526, 81–90. [CrossRef]
20. Burioli, E.A.V.; Prearo, M.; Houssin, M. Complete genome sequence of Ostreid herpesvirus type 1 microVar
isolated during mortality events in the Pacific oyster Crassostrea gigas in France and Ireland. Virology 2017,
509, 239–251. [CrossRef]Viruses 2019, 11, 383 13 of 14
21. Martenot, C.; Travaille, E.; Lethuillier, O.; Lelong, C.; Houssin, M. Genome exploration of six variants of the
Ostreid Herpesvirus 1 and characterization of large deletion in OsHV-1 mu Var specimens. Virus Res. 2013,
178, 462–470. [CrossRef]
22. Renault, T.; Moreau, P.; Faury, N.; Pepin, J.F.; Segarra, A.; Webb, S. Analysis of clinical ostreid herpesvirus 1
(Malacoherpesviridae) specimens by sequencing amplified fragments from three virus genome areas. J. Virol.
2012, 86, 5942–5947. [CrossRef]
23. Martenot, C.; Oden, E.; Travaille, E.; Malas, J.P.; Houssin, M. Detection of different variants of Ostreid
Herpesvirus 1 in the Pacific oyster, Crassostrea gigas between 2008 and 2010. Virus Res. 2011, 160, 25–31.
[CrossRef]
24. Rosani, U.; Varotto, L.; Domeneghetti, S.; Arcangeli, G.; Pallavicini, A.; Venier, P. Dual analysis of host and
pathogen transcriptomes in ostreid herpesvirus 1-positive Crassostrea gigas. Environ. Microbiol. 2015, 17,
4200–4212. [CrossRef]
25. He, Y.; Jouaux, A.; Ford, S.E.; Lelong, C.; Sourdaine, P.; Mathieu, M.; Guo, X. Transcriptome analysis reveals
strong and complex antiviral response in a mollusc. Fish. Shellfish Immunol. 2015, 46, 131–144. [CrossRef]
26. Bai, C.M.; Rosani, U.; Xin, L.S.; Li, G.Y.; Li, C.; Wang, Q.C.; Wang, C.M. Dual transcriptomic analysis of
Ostreid herpesvirus 1 infected Scapharca broughtonii with an emphasis on viral anti-apoptosis activities and
host oxidative bursts. Fish. Shellfish Immun. 2018, 82, 554–564. [CrossRef]
27. De Lorgeril, J.; Lucasson, A.; Petton, B.; Toulza, E.; Montagnani, C.; Clerissi, C.; Vidal-Dupiol, J.; Chaparro, C.;
Galinier, R.; Escoubas, J.M.; et al. Immune-suppression by OsHV-1 viral infection causes fatal bacteraemia in
Pacific oysters. Nat. Commun. 2018, 9, 4215. [CrossRef] [PubMed]
28. Martenot, C.; Gervais, O.; Chollet, B.; Houssin, M.; Renault, T. Haemocytes collected from experimentally
infected Pacific oysters, Crassostrea gigas: Detection of ostreid herpesvirus 1 DNA, RNA, and proteins in
relation with inhibition of apoptosis. PLoS ONE 2017, 12, e0177448. [CrossRef] [PubMed]
29. Morga, B.; Faury, N.; Guesdon, S.; Chollet, B.; Renault, T. Haemocytes from Crassostrea gigas and OsHV-1:
A promising in vitro system to study host/virus interactions. J. Invertebr. Pathol. 2017, 150, 45–53. [CrossRef]
30. Martenot, C.; Segarra, A.; Baillon, L.; Faury, N.; Houssin, M.; Renault, T. In situ localization and tissue
distribution of ostreid herpesvirus 1 proteins in infected Pacific oyster, Crassostrea gigas. J. Invertebr. Pathol.
2016, 136, 124–135. [CrossRef]
31. You, Y.; Cheng, A.C.; Wang, M.S.; Jia, R.Y.; Sun, K.F.; Yang, Q.; Wu, Y.; Zhu, D.; Chen, S.; Liu, M.F.; et al.
The suppression of apoptosis by alpha-herpesvirus. Cell Death Dis. 2017, 8, e2749. [CrossRef] [PubMed]
32. Nguyen, M.L.; Blaho, J.A. Apoptosis during herpes simplex virus infection. Adv. Virus Res. 2007, 69, 67–97.
[PubMed]
33. Goodkin, M.L.; Morton, E.R.; Blaho, J.A. Herpes simplex virus infection and apoptosis. Int. Rev. Immunol.
2004, 23, 141–172. [CrossRef]
34. Arzul, I.; Corbeil, S.; Morga, B.; Renault, T. Viruses infecting marine molluscs. J. Invertebr. Pathol. 2017, 147,
118–135. [CrossRef] [PubMed]
35. Schikorski, D.; Renault, T.; Saulnier, D.; Faury, N.; Moreau, P.; Pepin, J.F. Experimental infection of Pacific
oyster Crassostrea gigas spat by ostreid herpesvirus 1: Demonstration of oyster spat susceptibility. Vet. Res.
2011, 42, 27. [CrossRef] [PubMed]
36. Nam, B.H.; Kwak, W.; Kim, Y.O.; Kim, D.G.; Kong, H.J.; Kim, W.J.; Kang, J.H.; Park, J.Y.; An, C.M.; Moon, J.Y.;
et al. Genome sequence of pacific abalone (Haliotis discus hannai): The first draft genome in family
Haliotidae. Gigascience 2017, 6, 1–8. [CrossRef] [PubMed]
37. Grabherr, M.G.; Haas, B.J.; Yassour, M.; Levin, J.Z.; Thompson, D.A.; Amit, I.; Adiconis, X.; Fan, L.;
Raychowdhury, R.; Zeng, Q.D.; et al. Full-length transcriptome assembly from RNA-Seq data without a
reference genome. Nat. Biotechnol. 2011, 29, 644–652. [CrossRef]
38. Bai, C.M.; Rosani, U.; Li, Y.N.; Zhang, S.M.; Xin, L.S.; Wang, C.M. RNA-seq of HaHV-1-infected abalones
reveals a common transcriptional signature of Malacoherpesviruses. Sci Rep. 2019, 9, 938. [CrossRef]
39. Young, M.D.; Wakefield, M.J.; Smyth, G.K.; Oshlack, A. Gene ontology analysis for RNA-seq: Accounting for
selection bias. Genome Biol. 2010, 11, R14. [CrossRef]
40. Mao, X.Z.; Cai, T.; Olyarchuk, J.G.; Wei, L.P. Automated genome annotation and pathway identification
using the KEGG Orthology (KO) as a controlled vocabulary. Bioinformatics 2005, 21, 3787–3793. [CrossRef]
41. Singh, V.K.; Mangalam, A.K.; Dwivedi, S.; Naik, S. Primer premier: Program for design of degenerate primers
from a protein sequence. Biotechniques 1998, 24, 318–319. [CrossRef] [PubMed]Viruses 2019, 11, 383 14 of 14
42. Zhang, S.-M.; Bai, C.-M.; Li, Y.N.; Xin, L.-S.; Wang, C.-M. Selection of reference genes as internal control for
gene expression in adult abalone Haliotis diversicolor supertexta. J. Invertebr. Pathol.. submitted.
43. Livak, K.J.; Schmittgen, T.D. Analysis of relative gene expression data using real-time quantitative PCR and
the 2(T)(-Delta Delta C) method. Methods 2001, 25, 402–408. [CrossRef]
44. Huang, Z.X.; Chen, Z.S.; Ke, C.H.; Zhao, J.; You, W.W.; Zhang, J.; Dong, W.T.; Chen, J. Pyrosequencing
of Haliotis diversicolor transcriptomes: Insights into early developmental molluscan gene expression.
PLoS ONE 2012, 7, e51279. [CrossRef] [PubMed]
45. Mushegian, A.; Karin, E.L.; Pupko, T. Sequence analysis of malacoherpesvirus proteins: Pan-herpesvirus
capsid module and replication enzymes with an ancient connection to “Megavirales”. Virology 2018, 513,
114–128. [CrossRef] [PubMed]
46. Mettenleiter, T.C. Initiation and spread of alpha-herpesvirus infections. Trends Microbiol. 1994, 2, 2–4.
[CrossRef]
47. Zhong, P.; Agosto, L.M.; Munro, J.B.; Mothes, W. Cell-to-cell transmission of viruses. Curr. Opin. Virol. 2013,
3, 44–50. [CrossRef]
48. Carmichael, J.C.; Yokota, H.; Craven, R.C.; Schmitt, A.; Wills, J.W. The HSV-1 mechanisms of cell-to-cell
spread and fusion are critically dependent on host PTP1B. PLoS Pathog. 2018, 14, e1007054. [CrossRef]
49. Corbeil, S.; McColl, K.A.; Williams, L.M.; Mohammad, I.; Hyatt, A.D.; Crameri, S.G.; Fegan, M.; Crane, M.S.
Abalone viral ganglioneuritis: Establishment and use of an experimental immersion challenge system for
the study of abalone herpes virus infections in Australian abalone. Virus Res. 2012, 165, 207–213. [CrossRef]
50. Hooper, C.; Slocombe, R.; Day, R.; Crawford, S. Leucopenia associated with abalone viral ganglioneuritis.
Aust. Vet. J. 2012, 90, 24–28. [CrossRef]
51. Bai, C.; Gao, W.; Wang, C.; Yu, T.; Zhang, T.; Qiu, Z.; Wang, Q.; Huang, J. Identification and characterization
of ostreid herpesvirus 1 associated with massive mortalities of Scapharca broughtonii broodstocks in China.
Dis. Aquat. Organ. 2016, 118, 65–75. [CrossRef]
52. Renault, T.; Le Deuff, R.M.; Chollet, B.; Cochennec, N.; Gerard, A. Concomitant herpes-like virus infections
in hatchery-reared larvae and nursery-cultured spat Crassostrea gigas and Ostrea edulis. Dis. Aquat. Organ.
2000, 42, 173–183. [CrossRef] [PubMed]
53. Hine, P.; Thorne, T. Replication of herpes-like viruses in haemocytes of adult flat oysters Ostrea angasi an
ultrastructural study. Dis. Aquat. Organ. 1997, 29, 189–196. [CrossRef]
54. Abergel, C.; Rudinger-Thirion, J.; Giege, R.; Claverie, J.M. Virus-encoded aminoacyl-tRNA synthetases:
Structural and functional characterization of mimivirus TyrRS and MetRS. J. Virol. 2007, 81, 12406–12417.
[CrossRef] [PubMed]
55. Fouquet, B.; Nikolic, J.; Larrous, F.; Bourhy, H.; Wirblich, C.; Lagaudriere-Gesbert, C.; Blondel, D. Focal
Adhesion Kinase Is Involved in Rabies Virus Infection through Its Interaction with Viral Phosphoprotein P.
J. Virol. 2015, 89, 1640–1651. [CrossRef]
56. Sun, C.L.; Schattgen, S.A.; Pisitkun, P.; Jorgensen, J.P.; Hilterbrand, A.T.; Wang, L.J.; West, J.A.; Hansen, K.;
Horan, K.A.; Jakobsen, M.R.; et al. Evasion of Innate Cytosolic DNA Sensing by a Gammaherpesvirus
Facilitates Establishment of Latent Infection. J. Virol. 2015, 194, 1819–1831. [CrossRef]
57. Allam, B.; Raftos, D. Immune responses to infectious diseases in bivalves. J. Invertebr. Pathol. 2015, 131,
121–136. [CrossRef]
58. Leroy, B.; Gillet, L.; Vanderplasschen, A.; Wattiez, R. Structural Proteomics of Herpesviruses. Viruses 2016, 8,
50. [CrossRef]
© 2019 by the authors. Licensee MDPI, Basel, Switzerland. This article is an open access
article distributed under the terms and conditions of the Creative Commons Attribution
(CC BY) license (http://creativecommons.org/licenses/by/4.0/).You can also read