Recycling Agricultural Wastes and By-products in Organic Farming: Biofertilizer Production, Yield Performance and Carbon Footprint Analysis - MDPI
←
→
Page content transcription
If your browser does not render page correctly, please read the page content below
sustainability

Article
Recycling Agricultural Wastes and By-products in
Organic Farming: Biofertilizer Production, Yield
Performance and Carbon Footprint Analysis
Mariangela Diacono 1, * , Alessandro Persiani 1 , Elena Testani 2 , Francesco Montemurro 3
and Corrado Ciaccia 2
 1    Consiglio per la ricerca in agricoltura e l’analisi dell’economia agraria—Research Centre for Agriculture and
      Environment, Via Celso Ulpiani 5, 70125 Bari, Italy
 2    Consiglio per la ricerca in agricoltura e l’analisi dell’economia agraria—Research Centre for Agriculture and
      Environment, Via della Navicella 2-4, 00184 Roma (RM), Italy
 3    Consiglio per la ricerca in agricoltura e l’analisi dell’economia agraria—Research Centre for Vegetable and
      Ornamental Crops, Via Salaria 1, 63030 Monsampolo del Tronto (AP), Italy
 *    Correspondence: mariangela.diacono@crea.gov.it; Tel.: +39-080-5475052

 Received: 27 May 2019; Accepted: 10 July 2019; Published: 12 July 2019

 Abstract: The Circular Economy concept implies the re-design of existing production systems in
 agriculture, by promoting agricultural waste recycling. In an organic zucchini—lettuce rotation,
 two different agroecological tools were considered: biofertilizer and presence or absence of green
 manure (GM+ and GM−). In particular, we compared: (i) anaerobic digestate from cattle manure,
 co-composted with vegetable wastes, with the presence of GM (AD GM+); (ii) olive pomace compost,
 re-composted, with the presence of GM (OWC GM+); (iii) municipal waste compost with GM (MWC
 GM+); (iv) municipal waste compost without GM (MWC GM−). These materials were tested with
 a commercial organic fertilizer without GM (COF GM−) as a positive control. The objectives were:
 (i) assessing the environmental sustainability of biofertilizers through carbon footprint analysis by
 greenhouse gas—GHG—emissions; (ii) evaluating the agronomic performance on the vegetable
 rotation, by energy output assessment. The total carbon emissions of biofertilizers production was 63.9
 and 67.0 kg of CO2 eq Mg−1 for AD and OWC, respectively. The co-composting and re-composting
 processes emitted 31.4 and 8.4 kg CO2 per Mg of compost, respectively. In AD the ventilation phase
 of composting accounted for 37.2% of total emissions. The total CO2 emission values for the two-crop
 cycles were the highest in COF GM− and the lowest in OWC GM+, due to different fertilizer sources.
 On the average of the treatments, the input that induced the highest CO2 emission was irrigation
 (37.9%). The energy output assessment for zucchini and lettuce highlighted similar performance
 for all the treatments. Our findings demonstrated the validity of the tested processes to recycle
 agro-industrial wastes, and the potential of agroecological practices (GM) to mitigate GHG emissions.

 Keywords: anaerobic digestate; co-composting; olive pomace compost; municipal waste compost;
 circular economy; environmental sustainability; Mediterranean environment; climate change

1. Introduction
     Europe is experiencing unsustainable exploitation of natural resources, unpredictable severe
changes of climate, loss in biodiversity and increasing food waste production, in a context of a world
population increase of more than 9 billion by 2050 [1–3]. Overcoming these challenges requires research
and innovation in agriculture, to achieve radical switches in lifestyle and resource use.
     In 2015, the European Commission published ‘Closing the loop—An EU action plan for the
circular economy’ [4]. The new model of economy can support the EU’s commitments to reach the

Sustainability 2019, 11, 3824; doi:10.3390/su11143824                           www.mdpi.com/journal/sustainability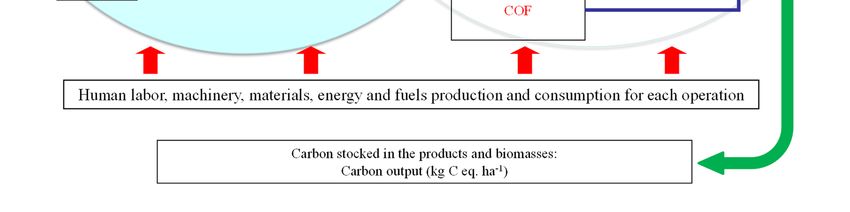
Sustainability 2019, 11, 3824                                                                         2 of 17

Sustainable Development Goal n.12 ‘Responsible consumption and production’. In closed systems,
for example, the goal is to use wastes from one sector as an input for other ones. To this aim it is
necessary to consider that different Agricultural Wastes, Co-products and By-products (AWCB) are
generated during the production, industrial manufacturing and consumption of agricultural produce.
The studies reviewed by Corrado and Sala [5] showed that food waste generation along the supply
chain ranges between 194 kilograms per capita−1 year−1 (kg/p/yr) and 389 kg/p/yr at the global level,
and between 158 kg/p/yr and 298 kg/p/yr at the European scale. In the European Union, AWCB
have been estimated to be more than 700 million Mg every year [6]. They potentially represent an
enormous loss of resources in the form of both materials and energy. In addition, the management and
incorrect disposal of AWCB have huge environmental impacts, such as groundwater contamination,
soil pollution and greenhouse gases emission to the air [7].
      In Italy, AWCB are produced in different stages of supply chain, and in particular 3.3 and 2.6% of
agri-food products and final products, respectively, from the food industry are discarded before sale
(17 and 1.7 Mt yr−1 , respectively), while the loss occurring in food retailers is about 250,000 t yr−1 [3].
      As a matter of fact, the long-term aim of the revised Waste Framework Directive (EU, 2018/851)
is to decrease the quantity of waste produced and achieve high levels of recycling, as well as phase
out landfilling except for non-recyclable wastes. In the frame of development of the European
Bioeconomy [8,9], sustainable valorization of the abovementioned AWCB through conventional or
novel processes seems crucial. Therefore, waste management and global resource depletion can be
solved together, for an eco-innovation focused on a “zero waste” society and economy. This model of
circular chain, often defined as closed loops, could recover valuable components from AWCB. Much of the
most important organic materials generated as AWCB contain, in fact, many components (e.g., proteins,
sugars and lipids) that could be utilized as substrates and nutrients in different microbial/enzymatic
processes, to originate innovative added-value products. Possible uses of residual organic materials
include production of biofertilizers and soil amendments, energy recovery, production of chemicals
(volatile organic acids, alcohols, etc.) and utilization in farm animal nutrition [10,11].
      Following the most widespread waste streams of the production chains in the study area (Southern
Italy), AWCB from farm livestock (cattle manure), olive milling (wet olive pomace and olive pruning)
and vegetable processing (aubergines, peppers) were selected for the study. For the purposes of this
research, two traditional technologies of waste treatment, namely anerobic digestion and composting
were considered, to study the contribution of integrated methodologies applied in the circular
economy [12].
      Digestates are co-products from biogas plants for methane production by anaerobic digestion of
different organic matrices (e.g., farm livestock manure) and can be separated into a solid and a liquid
fraction. In particular, according to Møller et al. [13] the solid digestate fraction can contain 60–80% of
the organic matter and phosphorus, 20–25% of the nitrogen and 10–15% of the potassium compared
to the original material. However, since phytotoxicity, viscosity and odor limit the direct application
of digestate on agricultural soils, pre-treatments are required to obtain a valuable biofertilizer, thus
allowing sustainable crop cultivation without environmental risks [14]. To improve the quality of
this pre-processed solid fraction, co-composting could be a feasible way, providing easily degradable
materials to foster the microbial activity during the treatment [15]. The co-composting process is
a controlled biological degradation under aerobic conditions, where organic material compounds are
transformed in shorter molecular chains and a more stable humus, which is important in agricultural
production and to recycle organic matter [16]. The resulting co-composted anaerobic digestate (AD)
can be easily produced at farm scale, by using raw materials available in the farm/area. The farmers
knowledge on how apply organic fertilizers and their possible positive effects (e.g., soil health,
suppressiveness, environmental benefits, etc.) is crucial [17]. Hence, soil application of this biofertilizer
needs a higher farmer’s expertise, to synchronize the mineralization rate with the plant growth,
reducing the risk of leaching of excess N.
Sustainability 2019, 11, 3824 3 of 17
Among the AWCB, olive pomace (OP) is one of the most important organic agro-industrial wastes
in Mediterranean countries, with a high content of organic matter (about 90%) that could profitably
be recycled through composting, so that it can be used in agriculture as fertilizer [18]. Olive pomace
is a semisolid fraction derived after the extraction of olive oil by two-phase centrifugation systems,
generated in huge amounts in a short period of time (October-November), which incorrect disposal
may determine a damaging environmental impact. This is due to the phytotoxic and antimicrobial
effects of phenolic compounds and the lipid fraction [19]. Re-composting the pre-processed OP with an
on-farm compost from vegetable residues could be a feasible treatment to recycle this waste, producing
a biofertilizer with an adequate degree of stability and maturity. The re-composting of OP can lead
to a decrease in the C/N ratio, compared to the starting material, and to an improvement of the
microbial activity.
There is a large literature relating to the influence of composted digestate and olive pomace both
on soils and different crops [20–23]. The combination of cover crops introduction (green manure) and
application of organic materials was also studied for different crops in organic production [24,25].
However, to the best of our knowledge there is a lack of information on environmental sustainability
assessment of recycled organic matrices applied in association with green manure on vegetable crops
in organic farming, under Mediterranean conditions.
Vandermeersch et al. [26] in particular found that food waste management options can be evaluated
according to several assessment methods. These methods are material flow analysis, energy balance,
exergy analysis and life cycle assessment. Indeed, carbon footprint method can also be applied [27],
to assess the environmental impact and sustainability of the waste recycling treatments used. The
carbon footprint is a measure of the total amount of carbon dioxide emissions that is directly and
indirectly caused by an activity or is accumulated over the life stages of a product [28]. The unit is
kg CO2 when only CO2 is considered, while if other greenhouse gases (GHG) are included the unit
changes to kg CO2 -e, indicating the mass of CO2 -equivalents. During biological waste treatments,
the organic materials are metabolized by microorganisms, so a part of their embedded carbon is
emitted into the air, and the remainder is stored as compost or digestate that can be assessed by carbon
footprint analysis.
The objectives of the research were: (i) to produce biofertilizers from AWCB so to close the organic
materials cycle from field to productive sector and return back to the field, (ii) to test the environmental
sustainability and effectiveness of co-composting procedures through carbon footprint analysis, (iii) to
evaluate the agronomic performance of the biofertilizers obtained on a zucchini–lettuce rotation under
organic farming management and Mediterranean conditions.
2. Materials and Methods
2.1. Experimental Site
The experimental field trial was carried out in 2016–2017 on an organic zucchini—lettuce rotation
at the ‘Azienda Sperimentale Metaponto’ (one of the Research Centers of the Consiglio per la ricerca in
agricoltura e l’analisi dell’economia agraria), located in Metaponto (MT)—South Italy (lat 40◦ 24’ N;
long 16◦ 48’ E and 8 meters a.s.l.).
The climate is classified as “accentuated thermomediterranean” according to the UNESCO-FAO
classification [29], with an average month temperature of 8.8 and 24.4 ◦ C in the winter and summer,
respectively. Sometimes the winter and summer temperatures fall below 0 ◦ C and rise above 40 ◦ C,
respectively. The mean rainfall is about 490 mm year−1 but it is unevenly distributed, since it is
concentrated in the winter months.
The soil of the experimental trial is classified as a Typic Epiaquert [30]. It has a clay loam texture
(60 and 36% of the clay and silt, respectively) with a soil bulk density of 1350 kg m−3 , and it contains
1.0 and 19.0 g kg−1 of N and organic matter, respectively.Sustainability 2019, 11, 3824 4 of 17
2.2. Experimental Design, Composting Processes and Measurements
2.2.1. AWCB Tested
The experiment was divided into two complementary stages. In the first one, co-composting/
re-composting processes of pre-processed organic matrices were carried out on selected wastes,
sub-products and biofertilizers (as outlined above) derived from local production systems and residues
from experimental farm activities. In the second stage, the obtained stable materials were tested in an
experimental field, in comparison with a commercial fertilizer.
The anaerobic digestate from cattle manure (80% of total dry weight) was co-composted,
in a six-weeks process, to improve the quality of this solid fraction, with (highly fermentable)
organic vegetable wastes (10%)—i.e., Aubergines, peppers—and straws (10%) acting as bulking agent,
so obtaining an anaerobic digestate-based compost (AD). The olive pomace compost was a powdery
compost obtained by olive pomace (80% of total dry weight) and olive pruning (20%), which was
supplied by the Research Centre of Composting—CESCO—in Laurino (SA), Campania region (south
of Italy). The olive pomace compost (75% of the final product) was re-composted at the CREA
experimental farm together with a Municipal Waste Compost (MWC; 5% of the total dry weight) and
an on-farm compost (20%) obtained by highly fermentable farm residues (grass clippings and straws)
and organic vegetable wastes, to obtain an olive waste-based compost (OWC). The percentage of
each raw material used for the composting process was decided also on the C/N ratio basis, to ensure
an equilibrate compost process and to obtain the best final C/N ratio. The obtained compost was
a stable material with total N content of 2.4% (dry matter) and C/N of 18 (compared to C/N of 21 of the
starting material).
All the raw materials that we have used in this research were chosen to accomplish different level
of agro-ecological intensification. In particular, the raw materials used for the co- and re-composting
processes were sampled and analyzed, to determine their Total Nitrogen (N) and Total Organic Carbon
(TOC) contents. The total N (%) and TOC (%) contents of each raw material sample were determined
by an elemental LECO analyzer (LECO, mod. RC-612; St. Joseph, MI, USA) using a dry combustion
method [31]. In Table 1 the Total N and TOC content of the raw materials used in AD and OWC
composting processes are reported.
Table 1. Total organic carbon (TOC) and Total nitrogen (N) content of the raw materials used for AD
and OWC composting processes.
TOC (%) N (%)
Straw 58.7 ± 1.21 0.1 ± 0.0
Grass clippings 52.9 ± 0.2 1.7 ± 0.1
Organic vegetable wastes
Peppers 52.7 ± 0.1 3.3 ± 0.2
Aubergines 53.3 ± 1.3 2.5 ± 0.1
On-farm compost 23.0 ± 3.2 1.9 ± 0.3
Municipal Waste Compost 30.0 2 2.0
1 mean value and standard deviation; 2 commercial data.
The mixtures were manually prepared on the experimental farm and the composting process was
carried out in static aerated piles (1.0 m high × 1.5 m base diameter) of about 300 kg each. The piles
were set up on a concrete platform to avoid the loss of percolates. During composting, the pile moisture
content was weekly checked and kept between 40 and 70%. In order to allow aeration and temperature
control, the piles were manually turned in a first stage. Then, the aeration of the co-composted AD was
ensured by the ventilation with a blower (1 kW), which was linked with a timer, ensuring 5 minutes of
aeration for each hour for the first two weeks.
No aeration with a blower was necessary for the re-composted OWC, since the original materials
were more stable and had less oxygen demand. The maturity of the compost was not monitoredSustainability 2019, 11, 3824 5 of 17
through humification index but only indirectly, considering the microbiological activity linked to
the temperature of the composting process. In particular, we monitored the temperature of the
re-composting process turning the material with a shovel once per week during the first three weeks of
the entire six-week process, whereas we did not turn the materials when the temperature was stable.
The heavy metals content (cadmium, Cd; chromium, Cr; copper, Cu; nickel, Ni; lead, Pb; zinc, Zn)
of anaerobic digestate (AD) and olive wastes compost (OWC) before and after the co-/re-composting
processes was determined by inductively coupled plasma emission spectrophotometer (ICP-AES Iris;
Thermo Optek, Milan, Italy). Data recorded from spectrophotometer have been submitted to Analysis
of Variance (by using SPSS Inc. Released 2007, SPSS for Windows, Version 16.0. SPSS Inc., Chicago,
IL, USA).
2.2.2. Experimental Design Treatment, Measurements
The experimental design was a split-plot with two factors and three replicates (blocks). The
main-plot factor was the green manure (GM) presence or not (GM+ and GM−, respectively). The
subplot factor was assigned to fertilizer (F), comparing: (i) the co-composted anaerobic digestate
(AD); (ii) the re-composted olive waste compost (OWC); (iii) a commercial organic fertilizer, based on
dried animal manure (COF) (Ca’ verde—ED & F Man Liquid Products Italia srl, Bagnasco, Italy) as
positive control; (iv) a municipal solid waste compost (MSW), as second positive control, obtained
with municipal solid waste from separate collection and biodegradable wastes from parks and gardens
management in processing plant of Tersan S.p.A. (Bari, Italy). Each sub-plot was 4 × 5 m. All the
fertilizers were allowed in organic farming, in accordance to the European Regulation (Commission
Regulation N◦ 889/2008 of 5 September 2008 for EU Council Regulation N◦ 834/2007).
The fertilizers were applied to soil at the dose of 150 kg N ha−1 , split in two amounts in separate
stages of the rotation in both years: before GM sowing (70% of the total quantity) and before zucchini
transplanting (the remaining 30%), to reduce potential N immobilization phenomena during the cash
crop cycle. No fertilization was applied before the lettuce crop. The 150 kg ha−1 of N was derived as
the sum of the marketable N uptake of both crops in our environmental conditions and, consequently,
we applied a different amount of organic materials, according with their N content.
Irrigation was done with the same volume of water in all treatments, calculated to reach 100% of
available soil water for a soil depth of 0–40 cm for each irrigation.
The green manure treatment was a mixture of common vetch (Vicia sativa L.) and oat (Avena sativa
L.) sown at rate of 80 and 220 kg ha−1 for vetch and oat, respectively, on 3rd November 2016. The green
manure crops sowing was replicated on 28th December 2017, mainly due to the dry period occurred on
the autumn 2016 (data not reported). The GM was then chopped and incorporated into the soil (about
at 20 cm depth) by plowing on 26th April 2017. Zucchini (cv President) 25-days old seedlings were
hand-transplanted at an inter-row × row distance of 1.0 × 1.0 m (1.0 plant m−2 ) on 3rd May in 2017.
The harvest began the 9th of June and was completed by the 25th July, with a cropping cycle of 81 days.
Lettuce (var. Iceberg,) transplanting was done after a rotary tillage and it occurred on 24th August
2017. Lettuce harvest was completed on 23rd October, with a cropping cycle of 60 days. Furthermore,
no chemicals to control pests and diseases were used in both cropping cycles.
In order to compare the systems production capacity including different crops, according to other
studies [32,33], yields were transformed in energy output equivalent. The energy output was obtained
by multiplying the productions by their corresponding energy equivalents [34].
At GM termination, the aboveground biomass was sampled by placing two randomly-selected
1.0 × 1.0 m2 quadrat within each sub-plot. Samples were dried for 48 h at 70◦ to determine dry content,
and total N content (%) of each biomass sample was determined by LECO analyzer (dry combustion),
thus allowing the calculation of the above soil biomass N (N content × biomass dry weight). At zucchini
and lettuce harvest stage, yield and residues (Mg ha−1 ) were sampled from a 1.0 m2 area in the middle
of each sub-plot. Biomasses were then dried for 48 h at 70◦ C for the dry content determination. At the
beginning and at the end of the rotation, two soil samples (0–30 cm depth) were randomly taken fromSustainability 2019, 11, 3824 6 of 17
each sub-plot, air dried, 2-mm sieved and then analyzed for organic carbon content by means of an
elemental
Sustainability 2019,analyzer (LECO,
11, x FOR PEER mod.
REVIEWRC-612; St. Joseph, MI, USA), using a dry combustion method 6 of 18 [31].
To answer to the specific aims of this study, only selected treatments—corresponding to different
To answer
and to the specific aims
actual scenarios—were of this
taken intostudy, only selected
consideration. treatments
Therefore, – corresponding
results to the
are reported for different
following
and treatment
actual scenarios – were taken
combinations: into consideration.
AD GM+, OWC GM+, MWC Therefore,
GM+, MWCresultsGM−
are reported
and COFfor the following
GM−. The flowchart
treatment
of the combinations:
entire analyzedAD GM+, is
systems OWC GM+, in
described MWC GM+,
Figure 1. MWC GM- and COF GM-. The
flowchart of the entire analyzed systems is described in Figure 1.
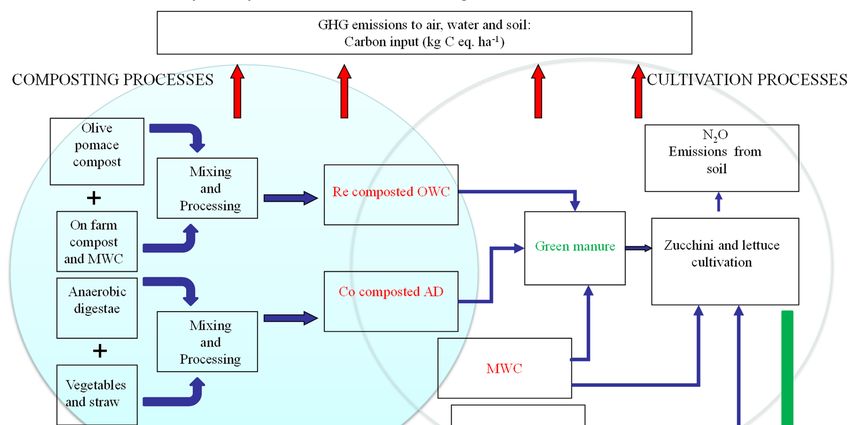
Figure 1. Flowchart to describe the analyzed systems: the system boundaries of the composting
Figure 1. Flowchart
processes to describe
and cultivation the analyzed systems: the system boundaries of the composting
processes.
processes and cultivation processes.
2.2.3. Statistical Analysis
2.2.3. Statistical analysis
A parametric one-way Analysis of Variance (ANOVA) was used to verify the effect of the treatments
A energy
on parametric one-way
output, and theAnalysis of Variance
Duncan Multiple (ANOVA)
Range was was
Test (DMRT) usedperformed
to verify for
themean
effectcomparisons
of the
treatments onprobability
(p ≤ 0.05 energy output,
level).and the Duncan
Statistical Multiple
analysis Rangeout
was carried Test
by(DMRT) wasfor
using SPSS performed
Windows,for mean 16.0.
Version
comparisons (p ≤ 0.05 probability level). Statistical analysis was carried out by using SPSS for
2.3. Environmental
Windows, Version 16.0.Impact and Sustainability Assessment
Greenhouse Gases Emissions
2.3. Environmental impact and sustainability assessment
To assess the environmental impact and the sustainability of the different fertilization strategies
2.3.1.implemented
Greenhouse gases in theemissions
field trial, the global warming potential (GWP) analysis was applied [35]. The
GWP is the total array
To assess the environmental of GHGimpactemissions
and the(CO 2 , N2 O and
sustainability of CH ), which fertilization
the4different is producedstrategies
directly and
indirectly during the cultivation cycles. However, we did not take
implemented in the field trial, the global warming potential (GWP) analysis was applied into account the CH 4 [35].ammonia
and The
GWPemissions in our
is the total operations,
array since the CH
of GHG emissions (CO4 in the composting process was already included in the
2, N2O and CH4), which is produced directly and
coefficient
indirectly during reported in the Table
the cultivation 2. Furthermore,
cycles. However, wethe didCH emission
not4take is considered
into account the CHnegligible
4 and ammonia
when the
aerobicinconditions
emissions occurred,
our operations, sinceasthe
reported
CH4 ininthe
Luske [36] and Brown
composting processetwasal. [37]. Pampuro
already included et al.
in[38]
the also
coefficient reported in the Table 2. Furthermore, the CH4 emission is considered negligible when theCH4
showed that if during the composting process the materials are adequately turned and aerated the
emissions
aerobic are reduced.
conditions occurred,Moreover,
as reported in calculations
in Luske [36]the CHBrown
and 4 emission
et al.was
[37].not included
Pampuro et since during
al. [38] also the
showed that if during the composting process the materials are adequately turned and aerated the
CH4 emissions are reduced. Moreover, in calculations the CH4 emission was not included since
during the processes (in our conditions) this emission is much less than N2O, as reported by PratibhaSustainability 2019, 11, 3824 7 of 17
processes (in our conditions) this emission is much less than N2 O, as reported by Pratibha et al. [35].
Also, since we re-composted the materials and considering their nature, the amounts of the ammonia
should be considered negligible [37].
The GHG emissions were transformed into CO2 equivalent by using GWP equivalent factors of
1 and 310 for CO2 and N2 O, respectively [39]. In this study, the amount of GHG emissions in terms
of CO2 equivalent was estimated both in the composting processes and in the subsequent crop cycle
activities by means of several parameters, including human labor, machineries, fuels, fertilizers, seeds
and pesticides, and marketable yields (Table 2). More specifically, also the emissions by the composts
used as raw materials before co-composting and re-composting are already included in the considered
coefficients (Table 2). The labor time was measured for each operation, and the diesel consumption
was directly measured in the farm. The machineries and implements weight for each operation were
calculated as follows:
W = M × t/l
where:
W = machinery and implement weights for each operation (kg)
M = mass (kg)
t = duration of each operation (h)
l = lifespan of the tools (h)
The variability factor was the fertilization strategy used, whereas the soil and phytosanitary
managements were not changed in the different treatments. The GHG values of unit inputs were
obtained by multiplying each input by its own emission coefficient taken from the literature (Table 3)
and were reported by Mg of compost produced and by production unit (hectare) per year, for the
whole cultivation cycle. The GHG emissions were divided both by category (e.g., human labor, fuels,
fertilizers) and operations (e.g., sowing, tillage, fertilizers application) [27,32,40].
Table 2. Greenhouse gases (GHG) coefficients (kg CO2 eq unit−1 ) of farm facilities for horticultural
crops production.
GHG Coefficient
Inputs Unit References
(kg CO2 eq./unit)
Human labor h 0.36 [40]
Machinery MJ 0.071 [41]
Electricity) kWh 0.608 [42]
Fuels
Diesel L 2.76 [41]
Fertilizers
MWC/Industrial/ on farm Composts kg 0.040–0.063 [43–45]
Anaerobic digestate (AD) 0.031 [46]
Nitrogen (N) kg 5.29 [47]
Phosphate (P2 O5 ) kg 0.52 [47]
Potash (K2 O) kg 0.38 [47]
Chemicals
Insecticides kg 5.1 [48]
Fungicides kg 3.9 [49]
Herbicides kg 6.3 [49]
Irrigation water m3 0.27 [40]
Plastic pipes PE kg 2.2 [50]
Aside from the CO2 equivalent emissions measured during the crop’s cultivation operations,
a further direct and indirect GHG impact of fertilizers use, and plants biomass decomposition arises
from N2 O emissions from soils. Nitrous oxide is produced in soils mainly due to microbially-mediated
processes (nitrification and denitrification) [51]. The direct and indirect N2 O emissions from theSustainability 2019, 11, 3824 8 of 17
fertilizer application and the plant biomass decomposition were estimated by IPCC methodology [39],
by using the coefficients reported in Table 3.
Table 3. Parameters and emission factors used in the calculation of greenhouse gas emissions.
Factor Unit Coefficient Reference
Emission factor (EF) kg N2 O-N kg−1 0.0125 [39]
Leaching factor of N (FRACLeach ) % 0.3 [39]
Volatilization of NH3 and NOx (FRACgas ) % 0.1 [39]
Leaching emission factor (EFLeach ) kg N2 O-N kg−1 0.025 [39]
Volatilization emission factor (EFvolat ) kg N2 O-N kg−1 0.01 [39]
The direct soil N2 O emissions (N2 ODirect), in terms of CO2 equivalents, from the application of
N fertilizer (NF) and the N derived from the green manure and crop residues biomass degradation
(NB) were estimated following the equation by Pratibha et al. [35]:
N2ODirect = (NF + NB) × EF × (44/28) × 310
where:
44/28 = coefficient converting N2 O–N into N2 O
310 = global warming potential coefficient.
The indirect soil N2 O emissions (N2 OIndirect) from nitrate leaching and volatilization of NH3
and NOx were calculated as:
N2OIndirect = ((NF + NB) × FRACLeach × EFLeach
+NF × FRACGas × EFvolat) × (44/28) × 310
where:
NF = N derived from fertilizers application (kg ha−1 )
NB = N derived from the green manure and residues biomasses degradation (kg ha−1 )
FracLeach = fraction of N lost by leaching and runoff (%);
FRACGas = fraction of volatilized nitrogen from fertilizer (%).
EFleach = leaching emission factor (kg N2 O-N kg−1 )
EFvolat = volatilization emission factor (kg N2 O-N kg−1 )
The total carbon output, that is the sum of the carbon equivalent of the zucchini and lettuce yields,
was calculated as:
Carbon Output (CO)
= (Zucchini Yield dry matter × TOC) + (Lettuce Yield dry matter × TOC)
The carbon balance (CB), the difference between total carbon output and total carbon input, and
the carbon efficiency (CE) of the different cropping systems were calculated according to Lal [49]:
Carbon balance = carbon output (CO) − carbon input (CI )
Carbon e f f iciency (CE) = carbon output (CO) / carbon input (CI )
where:
Carbon input (CI) = Sum of total GHG emission in CO2 eq. × 12/44 (stoichiometric coefficient from
CO2 to C)Sustainability 2019, 11, 3824 9 of 17
3. Results
3.1. Co-Composting and Re-Composting Processes
Main changes due to co-composting and re-composting of the main chemical parameters of OWC
and AD are reported in Table 4. The results evidence opposite trends for TOC, N and heavy metals
(Cd, Cr, Cu, Ni, Pb, Zn) for both composts. An opposite trend for TOC and N concentrations vs heavy
metal contents before and after the process for both the studied materials can be detected. In particular,
TOC decreased by 17.8 and 23.5% for AD and OWC, respectively, whereas N decreased by 8.33% in
both composting processes (no significant differences except TOC in OWC). Conversely, heavy metals
content significantly increased between 82.8% of Cu and 95.8% of Ni in AD, and between 84.7% of Cd
and 97.6% of Pb in OWC.
Table 4. Chemical parameter (dry weight) changes before and after the co-/re-composting processes of
anaerobic digestate (AD) and olive wastes compost (OWC).
Pre-Processed Materials Parameter Before Process After Process P Value ∆ (%)
TOC (%) 30.4 25.8 0.056 −17.8
N (%) 2.57 2.51 0.245 -8.33
Cd (ppm) 0.07 b 1 0.56 a 0.000 +87.1
Cr (ppm) 0.43 b 8.23 a 0.000 +94.8
AD
Cu (ppm) 1.85 b 10.7 a 0.000 +82.8
Ni (ppm) 0.11 b 2.7 a 0.000 +95.8
Pb (ppm) 0.31 b 2.5 a 0.000 +87.9
Zn (ppm) 13.1 b 90.0 a 0.000 +85.4
TOC (%) 56.3 a 45.6 b 0.013 -23.5
N (%) 2.63 2.37 0.284 -8.33
Cd (ppm) 0.02 b 0.16 a 0.012 +84.7
Cr (ppm) 0.09 b 2.59 a 0.024 +96.5
OWC
Cu (ppm) 0.88 b 11.9 a 0.009 +92.6
Ni (ppm) 0.06 b 1.97 a 0.008 +96.9
Pb (ppm) 0.11 b 4.56 a 0.043 +97.6
Zn (ppm) 3.05 b 40.3 a 0.010 +92.4
1 Mean values in each row followed by a different letter are significantly different according to p value ≤ 0.05.
3.2. Environmental Sustainability Assessment
3.2.1. Composting Processes Analysis
Emissions of carbon dioxide during the composting processes for each of the two on-farm composts
were estimated (Figure 2). The results illustrate that the total carbon emission associated with the AD
on-farm co–composting process was 63.9 kg of CO2 eq t−1 . The main factors that contributed to this
result were the raw materials, that represent 50.9% of the total impact, and the emission associated to
the energy use for the ventilation, that was the 37.2% of the total emissions (Figure 2). In particular,
this last GHG emission was generated by the energy consumption of the compost aeration phase by
the blower.
Higher values for the OWC re-composting were found, and the emission associated with the
treatment process was 67 kg of CO2 eq t−1 . Considering the estimated GHG emissions of each
management operation, the raw materials showed the highest value (87.4%), followed by moisture
control and compost turning.Sustainability 2019, 11, 3824 10 of 17
Sustainability 2019, 11, x FOR PEER REVIEW 10 of 18
80
70
60
Moisture control
kg CO2 eq. ton-1
50
Compost turning
40 Ventilation
30 Mixture preparation
20 Raw materials
10
0
AD co-composting OWC re-composting
Figure 2. 2.
Figure GHGGHGemission
emission values forfor
values ADADand OWC
and composting
OWC processes
composting divided
processes byby
divided each treatment
each treatment
operation (kg(kg
operation 2 eq
COCO t−1 compost
t-1 compost
2 eq produced).
produced).
3.2.2.
3.2.2. Cropping
Cropping Cycle
cycle Analysis
analysis
Table
Table 5 shows
5 shows the
the COCO 2 emissions
2 emissions forfor zucchini
zucchini andand lettuce
lettuce production.
production. The
The total
total COCO 2 emission
2 emission
values for the two-crops cycle were the highest in COF GM− as compared
values for the two-crops cycle were the highest in COF GM- as compared to the other treatments, to the other treatments,
followed
followed bybyMWCMWC GM+GM+ (−4%
(-4% than
than COF COF GM−)
GM-) andand
ADAD GM+ GM+ (- 7(−7%
% thanthan
COFCOF GM−),
GM-), whereas
whereas OWC
OWC
GM+ showed the lowest emissions (−9% than COF GM−). On the average
GM+ showed the lowest emissions (-9% than COF GM-). On the average of all the five treatment of all the five treatment
combinations,
combinations, thethe input
input that
that caused
caused thethe highest
highest COCO 2 emission
2 emission was was
thethe water
water forfor irrigation
irrigation (37.9%),
(37.9%),
followed
followed bybyfertilizers
fertilizers(23.6
(23.6%)
%) and
and fuels
fuels(14.7%).
(14.7 %).The
Theemission
emission associated to the
associated fertilizers
to the varied
fertilizers across
varied
the treatments from 29.6% of COF GM− to 19.3% of OWC GM+. Furthermore,
across the treatments from 29.6 % of COF GM- to 19.3 % of OWC GM+. Furthermore, since no since no chemicals were
used in both
chemicals werecropping
used in cycles, they did not
both cropping contribute
cycles, they did to GHG emissions and,
not contribute to GHGtherefore, they are
emissions and,not
reported in the table.
therefore, they are not reported in the table.
Table 5. Greenhouse gases emissions of zucchini and lettuce productions divided by input categories
Table 5. Greenhouse gases emissions of zucchini and lettuce productions divided by input categories
(kg CO2 eq. ha −1 year−1 ). AD = co-composted anaerobic digestate; OWC = re-composted olive wastes
(kg CO2 eq. ha-1 year-1). AD = co-composted anaerobic digestate; OWC = re-composted olive wastes
compost; MWC = municipal solid waste compost; COF = commercial organic fertilizer; GM+ = green
compost; MWC = municipal solid waste compost; COF= commercial organic fertilizer; GM+ = green
manure; GM− = no green manure.
manure; GM- = no green manure.
AD GM+ OWC GM+ MWC GM+ MWC GM− COF GM−
OWC MWC MWC COF
AD GM+ kg CO2 eq kg CO2 eq kg CO2 eq kg CO2 eq kg CO2 eq
Inputs % % % % %
ha−1 year−1 GM+ ha−1 year−1 GM+ha−1 year−1 ha−1 year−1
GM- ha−1 year−1
GM-
Human labor 204 6.5 186 6.0 196 6.0 164 5.2 211 6.2
Machinery 256 kg
8.1CO2 256 kg CO2
8.3 256 7.8kg CO2 229 7.3 kg CO2292
6.7
kg CO2 eq
Fuels 514 16.3 508 16.4 -1 511 15.5 409 13.1 413 12.1
Inputs % eq ha-1 % eq ha % eq ha-1 % eq ha -1 %
Fertilizers 640 20.3 598 19.3 778 23.7 778 24.9 1007 29.6
ha-1 year-1
Irrigation equipment 330 10.4
year-1 330 10.7
year-1 330 10.0year-1 330 10.6 year-1330 9.7
Water 1215 38.5 1215 39.3 1215 37.0 1215 38.9 1215 35.7
HumanTotal emissions 3159 3092 3285 3125 3405
labor 204 6.5 186 6.0 196 6.0 164 5.2 211 6.2
Among the
Machinery 256
different8.1agricultural
256
operations
8.3
(Table
256
6), 7.8
the highest
229
value7.3
of total 229
GHG emissions,
6.7
as overall average, was found for irrigation (37.9%). Moreover, fertilization (24.4%) and irrigation
Fuels 514 16.3 508 16.4 511 15.5 409 13.1 413 12.1
system preparation (10.4%) showed high values.
The data 640
Fertilizers on N2 O-based
20.3 CO2598 emission19.3
from soils
778 revealed
23.7 that the
778sum of GWP from
24.9 1007 zucchini
29.6 and
lettuce cultivation was the highest in MWC GM+, followed by AD GM+ and OWC GM+ (Table 7).
Irrigation
The 60.5% of the GWP derived from the direct emissions, while the 39.5% derived from the indirect
equipment 330 10.4 330 10.7 330 10.0 330 10.6 330 9.7
emissions (leaching and volatilization). Moreover, the GWP related to GM− was −27% than the
Water 1215 38.5 1215 39.3 1215 37.0 1215 38.9 1215 35.7
GM+ treatment.
Total
emissions 3159 3092 3285 3125 3405Sustainability 2019, 11, 3824 11 of 17
Table 6. Greenhouse gases emissions of zucchini and lettuce productions divided by crop operation
(kg CO2 eq. ha−1 year−1 ). AD = co-composted anaerobic digestate; OWC = re-composted olive wastes
compost; MWC = municipal solid waste compost; COF = commercial organic fertilizer; GM+ = green
manure; GM− = no green manure.
AD GM+ OWC GM+ MWC GM+ MWC GM− COF GM−
Crop Operations
kg CO2 eq. kg CO2 eq. kg CO2 eq. kg CO2 eq. kg CO2 eq.
% % % % %
ha−1 year−1 ha−1 year−1 ha−1 year−1 ha−1 year−1 ha−1 year−1
Tillage 61 1.9 61 2 61 1.9 82 2.6 82 2.4
Harrowing/seedbed
304 9.6 304 10 304 9.3 304 9.7 304 8.9
preparation
Irrigation systems
333 10.5 333 11 333 10.1 333 10.6 333 9.8
preparation
Fertilization 670 21.2 628 20 808 24.6 808 25.9 1025 30.1
Irrigation 1216 38.5 1216 39 1216 37.0 1216 38.9 1216 35.7
Planting/sowing 72 2.3 72 2 72 2.2 30 1.0 30 0.9
Weeds control 48 1.5 48 2 48 1.5 48 1.5 48 1.4
Biomass chopping 200 6.3 200 6 200 6.1 100 3.2 100 2.9
Harvest 254 8.0 229 7 242 7.4 204 6.5 267 7.8
Table 7. Direct and indirect CO2 equivalent (kgCO2 eq. ha−1 ) emission derived from N2 O.
AD GM+ OWC GM+ MWC GM+ MWC GM− COF GM−
N2 O Based CO2 eq.
Emissions kg CO2 eq. kg CO2 eq. kg CO2 eq. kg CO2 eq. kg CO2 eq.
ha−1 year−1 ha−1 year−1 ha−1 year−1 ha−1 year−1 ha−1 year−1
Direct emissions 1555 1511 1571 1063 1150
Indirect emissions 1006 979 1016 711 763
Leaching emission 933 906 942 638 690
Volatilization
73 73 73 73 73
emission
Total GWP 2561 2490 2586 1774 1914
The highest Carbon input was found in MWC GM+, which was higher by −3% and −5% than AD
GM+ and OWC GM+, respectively (Table 8). The fertilization strategy influenced C output and AD
GM+ had the highest value, followed by MWC GM+ and OWC GM+ (Table 8).
Table 8. Carbon input (kg C eq. ha−1 ) and output (kg C eq. ha−1 ) in the different analyzed systems.
AD = co-composted anaerobic digestate; OWC = re- composted olive wastes compost; MWC =
municipal solid waste compost; COF = commercial organic fertilizer; GM+ = green manure; GM− = no
green manure.
Parameters AD GM+ OWC GM+ MWC GM+ MWC GM− COF GM−
Carbon input (CI) 1560 1522 1601 1336 1450
carbon eq. during crop
861.5 843.3 895.9 852.3 928.5
cultivation operations
carbon eq. N2 O 698.5 679.1 705.3 483.9 521.9
Carbon output (CO) 4620 3945 4174 1060 1780
carbon in the products 1229 1157 1152 657.7 1213
carbon in the green
3391 2788 3021 402.3 567.1
manure and residues
Carbon balance (CB) and carbon efficiency (CE) were higher in AD GM+, MWC GM+ and OWC
GM+ compared to the other two treatments (Figure 3). The CB was positive in all the analyzed systems
except MWC GM− that showed the lowest value (−276.17kg C ha−1 ).carbon in the green
manure and residues 3391 2788 3021 402.3 567.1
Carbon balance (CB) and carbon efficiency (CE) were higher in AD GM+, MWC GM+ and OWC
GM+ compared
Sustainability to3824
2019, 11, the other two treatments (figure 3). The CB was positive in all the analyzed systems
12 of 17
except MWC GM- that showed the lowest value (-276.17kg C ha−1).
3500.00 3.50
3000.00 3.00
Carbon balance (kg Ceq. ha-1)
2500.00 2.50
Carbon efficiency
2000.00
2.00
1500.00
1.50
1000.00
1.00
500.00
0.50
0.00
AD GM+ OWC GM+ MWC GM+ MWC GM- COF GM- 0.00
-500.00 AD GM+ OWC GM+ MWC GM+ MWC GM- COF GM-
Figure3.3.Carbon
Figure Carbonbalance
balance(kg
(kgCCeq ha−1
eqha −1) and carbon efficiency in the different analyzed systems.
) and carbon efficiency in the different analyzed systems.
3.3.
3.3. Agronomic
Agronomic Performances
performances
The
The energy
energy output
output assessment
assessment highlighted
highlighted similar
similar performance
performance for
for all
all the
the selected
selected treatments
treatments
(Table
(Table 9). Zucchini showed no significant differences among treatments, even if aa reduction
9). Zucchini showed no significant differences among treatments, even if reduction trend
trend
was
wasdetermined
determinedfor forOWC
OWCGM+GM+ and
andMWCMWCGM−. Results showed
GM-. Results showed aa different
different behavior
behavior inin lettuce,
lettuce, for
for
which the treatments without green manure (MWC GM− and COF GM−) had a significant
which the treatments without green manure (MWC GM- and COF GM-) had a significant reduction reduction
compared
comparedto totreatments
treatmentsin
inpresence
presenceofofgreen
greenmanure
manure(OWC
(OWCGM+ GM+andandMWC
MWCGM+).GM+). By By analyzing
analyzing thethe
total energy output, the MWC GM− showed the lowest output compared to all the other
total energy output, the MWC GM- showed the lowest output compared to all the other treatments, treatments,
while
whilethe
thesame
samecompost
compostshowed
showedthe
thehighest
highest(absolute)
(absolute)value
valuein
inGM
GMpresence.
presence.
Table 9. Field energy output. AD = co-composted anaerobic digestate; OWC = re-composted olive
wastes compost; MWC = municipal solid waste compost; COF = commercial organic fertilizer; GM+ =
green manure; GM− = no green manure.
Energy Output (MJ ha−1 )
Treatment Zucchini Lettuce Total
Mean St. dev Mean St. dev Mean St. dev
AD GM+ 11,426 4960.1 19,800 ab 1 4794.8 31,226 a 9544.9
OWC GM+ 8726.7 1925.6 21,633 a 3978.8 30,360 a 4546.5
MWC GM+ 10,155 2658.5 22,000 a 1983.1 32,155 a 3374.0
MWC GM− 6016.5 2413 11,183 b 3127.4 17,199 b 725.7
COF GM− 12,757 6862.6 19,066 b 7487.5 31,823 a 9957.8
Level of significance n.s. * *
Note: n.s., not significant at the probability level p > 0.05. 1 Mean values in each column followed by a different
letter are significantly different according to p value ≤ 0.05.
4. Discussion
4.1. Composting Findings
The characteristics of the materials after the composting processes confirm the compliance of their
use in organic farming with the EU and Italian regulations (EU 889/2008 and 834/2009 and Italian
Decree n. 217, 29/04/06). Since the raw materials that we have used in this research were chosen to
accomplish different level of agro-ecological intensification, our findings indicated that it is possible to
recycle particularly in organic agriculture different wastes, following the idea of “circular economy”,
which is relevant at European level [4].
The changes in chemical parameters after the processes confirm other studies, in which the TOC
value decrease was mainly related to the organic matter degradation [52,53]. Furthermore, after the
co-/re-composting processes the C/N ratio decreased both in the AD and OWC composts reaching 10.3
and 19.2, respectively. This high difference of the two composts, due to the raw materials (11.8 and 21.4
of C/N before process for AD and OWC, respectively), could influence the mineralization rate and,
consequently, the zucchini and lettuce energy outputs. The increase in heavy metal contents due toSustainability 2019, 11, 3824 13 of 17
the co- and re-composting processes are in accordance with the literature and are probably due to the
concentration effect, as a consequence of weight reduction as CO2 [54,55]. Our findings confirm the
compliance of these materials after the process with the law limits for their application to the soil as
fertilizers. However, the aerobic composting processes usually increase the complexation of heavy
metals in organic waste, since metals are strongly bound to the compost matrix, thus limiting their
solubility (and potential bioavailability to crops) in soil after application [56].
4.2. Environmental Sustainability Assessment
The results showed lower GHG emissions in the AD co-composting process than in OWC. The
difference between treatments was due to emissions related to the raw materials as it was found in
the literature [43,44,46,47]. Furthermore, Pampuro et al. [38] reported cumulative emission of GHG of
about 120 and 60 kg CO2 eq. ton−1 for turned and not turned composting process of pig slurry solid
fraction. These data are slightly higher than our emission values (Figure 2), due to the different raw
materials considered. In AD co-composting, the most important factors affecting the CO2 emissions
were the raw materials followed by the ventilation (compost aeration phase), which reached the 37%
of the co-composting emissions. No considerable differences were found for the other variables. In the
OWC re-composting process the 87% of the emissions were due to the raw materials collection while the
moisture control and the compost turning phases accounted for the 6.2 and 3.6% of the total emissions,
respectively. There are few data available on farm-composting in Europe, despite this technology has
the advantage of saving transport costs and reducing emissions [47]. Conversely, there are different
studies on composting processes for animal wastes and their GHG emissions, especially after soil
application of these materials [38,57]. The amount of CO2 emissions associated to the composting
process (excluding the materials collection phase) were comparable with the values in Pergola et al. [45].
This last study, that considered aerated composting technologies, showed that the emissions related
to the composting processes were from 1.85 to 80.94 kg CO2 eq per ton of compost produced (the
wide range of values is generated by the raw materials nature and humidity). In our study, the AD
co-composting process (aerated composting technology) and OWC re-composting process (not aerated)
emitted 31.4 and 8.4 kg CO2 per ton of compost, respectively.
The GHG analysis on the whole crop cycle reveals that GHG emitted for zucchini and lettuce
productions were higher in COF GM−, followed by MWC GM+ and AD GM+, which is mainly due
to the use of commercial fertilizers. In fact, despite of the same amount of N unit utilized, different
GHG equivalent per unit of fertilizer should be considered. Emissions from manure and composts
are lower compared to chemical and commercial fertilizers [47,58]. The analysis of the GHG input
divided by agricultural operations, in agreement with other studies in the same environment [59], also
revealed that the introduction of the cover crops as green manure implies more emissions as fuels and
labor related to their sowing and termination operations. However, the impact of these operations is
lower compared to the emissions related to the irrigation and fertilization [32]. As observed by Lal [48],
identifying strategies to reduce water consumption and the use of commercial fertilizers is crucial to
reduce the CO2 emissions. Thus, the use of irrigation methods such as the drip irrigation and the
adoption of no tillage techniques with natural mulch to reduce the soil evaporation losses [60], should
be considered by the farmers as good practices going towards a sustainable agriculture.
N2 O emission from soils is one of the key GHG source in agriculture [35], and our study reveals
that the GWP in the presence of manured cover crops was 28% higher than for GM− treatment. This
GWP increase was generated by the direct and indirect N2 O released in the biomass residues.
The carbon total input, that is sum of the carbon equivalent emissions from the processes and
the N2 O from the soil, was higher in the GM+ theses mostly because of the differences in the amount
of N2 O related to biomass residues. However, the carbon output, that is sum of the carbon in the
production and the carbon in the cover crops and plants residues, was substantially higher in the GM+
theses. The carbon in the products was directly proportional to the yields. In agreement with what was
observed in other studies [61,62], the carbon in the systems was strongly influenced by the presenceSustainability 2019, 11, 3824 14 of 17
of green manure. The data reveals that carbon balance was higher in GM+ theses and the AD GM+
was the most sustainable system. Although the carbon efficiency was higher in AD GM+, confirming
an increase of the ecosystem C pool by raising the carbon outputs with the introduction of the cover
crops and the organic fertilizers, exploiting the use efficiency of carbon input and decreasing losses are
crucial for sustainable horticultural productions [32,35,48].
4.3. Agronomic Performances
Our findings highlighted similar results for all the selected treatments, pointing out the evidence
that all the studied combinations of green manure and fertilizers are equivalent in terms of energetic
output of the system. More specifically, in the zucchini crop the energy output (absolute value) of
the AD GM+ treatment was comparable with COF GM−. This would indicate that the co-composted
material could be a possible alternative to commercial organic amendment without reducing the energy
output, at least in the short-time period. In lettuce crop, the opposite trend of energy output was
found, and in particular the OWC GM+ and MWC GM+ showed the statistically significant highest
values. This result was a consequence of the residual fertilization effects of these composts compared
to commercial and AD treatments, probably due to the difference of mineralization rate (C/N ratio of
the materials). Despite this, our results evidence a higher trend for combination of organic fertilizers
with green manure. This is in accordance with several authors, underlying the role of cover crops in
yield production, limiting possible risks of nitrogen immobilization or delayed release of nutrients,
often associated to application of soil amendments (e.g., compost) as fertilizers [18,63]. The absence
of differences among the combinations of organic fertilizer with green manure and the commercial
organic one (COF) highlighted the feasibility of co-composted AD and re-composted OWC to substitute
the standard system.
5. Conclusions
In a global climate change context and considering the increase of anthropogenic greenhouse gas
emissions, the environmental sustainability of agricultural systems may be enhanced with increased
carbon-based input use efficiency. Agro-industrial wastes and feedstock management through
composting processes have the potential to generate GHG emissions due to the composting processes
and materials transportation. However, these processes generate positive effects both directly, through
the carbon sequestration, and indirectly due to the avoided impacts of waste disposal, improved soil
quality and minimized soil loss.
The findings of this study revealed that horticultural systems, if well managed in organic farming
following an agro-ecological approach (combining green manuring and biofertilizers use), can have
considerable and positive effects on the control of GHG emissions, mainly due to a carbon sequestration
potential. The holistic approach that considers not only the anthropogenic emissions but also the effect
on the resources used in the systems and the outcome on the environment, represents the base for the
implementation of environmental-friendly organic horticultural productions. Moreover, the results on
the agronomic performances (total energy output) showed that the yield gaps between the theses with
different level of agro-ecological intensification and the control thesis with COF may be negligible.
Author Contributions: Conceptualization, M.D., A.P., E.T., F.M. and C.C.; Collection and analysis of the data,
A.P., E.T. and C.C.; writing—original draft preparation, M.D., A.P., E.T., F.M. and C.C; writing—review and
editing, M.D.
Funding: This research was funded by the European Commission’s Horizon 2020 Research and Innovation
Programme (2014–2020)—Sustainable techno-economic solutions for the agricultural value chain (AgroCycle),
under Grant Agreement n. 690142.
Acknowledgments: The authors wish to acknowledge the work of Angelo Fiore, Rosalba Scazzarriello, Marco
Favale, and Angelo Raffaele Quaranta for technical assistance and field management.Sustainability 2019, 11, 3824 15 of 17
Conflicts of Interest: The authors declare no conflict of interest. The funders had no role in the design of the
study; in the collection, analyses, or interpretation of data; in the writing of the manuscript, or in the decision to
publish the results.
References
1. Spiertz, J.H.J.; Ewert, F. Crop production and resource use to meet the growing demand for food, feed and
fuel: Opportunities and constraints. NJAS Wagen. J. Life Sci. 2009, 56, 281–300. [CrossRef]
2. Tomich, T.P.; Brodt, S.; Ferris, H.; Galt, R.; Horwath, W.R.; Kebreab, E.; Leveau, J.H.J.; Liptzin, D.; Lubell, M.;
Merel, P.; et al. Agroecology: A review from a global-change perspective. Annu. Rev. Environ. Resour. 2011,
36, 193–222. [CrossRef]
3. Mirabella, N.; Castellani, V.; Sala, S. Current options for the valorization of food manufacturing waste:
A review. J. Clean. Prod. 2014, 65, 28–41. [CrossRef]
4. European Commission. Closing the Loop—An. EU Action Plan for the Circular Economy; COM (2015) 614 Final;
European Commission: Brussels, Belgium, 2015.
5. Corrado, S.; Sala, S. Food waste accounting along global and European food supply chains: State of the art
and outlook. Waste Manag. 2018, 79, 120–131. [CrossRef] [PubMed]
6. Pavwelczyk, A. EU policy and legislation on recycling of organic wastes to agriculture. In Proceedings of the
12th International Congress International Society for Animal Hygiene, Warsaw, Poland, 4–8 September 2005;
Volume 1.
7. Kosseva, M.R. Processing of food wastes; Chapter 3. Adv. Food Nutr. Res. 2009, 58, 57–136.
8. European Commission. Communication from the Commission to the European Parliament, the Council, the European
Economic and Social Committee and the Committee of the Regions Innovating for Sustainable Growth: A Bio Economy
for Europe; COM (2012) 60 Final; European Commission: Brussels, Belgium, 2012.
9. European Commission. A Sustainable Bioeconomy for Europe: Strengthening the Connection between Economy,
Society and the Environment. Updated Bioeconomy Strategy; Directorate-General for Research and Innovation
Unit F—Bioeconomy: Brussels, Belgium, 2018; ISBN 978-92-79-94145-0. [CrossRef]
10. Westerman, P.W.; Bicudo, J.R. Management considerations for organic waste use in agriculture. Bioresour.
Technol. 2005, 96, 215–221. [CrossRef] [PubMed]
11. Kasapidou, E.; Sossidou, E.; Mitlianga, P. Fruit and vegetable co-products as functional feed ingredients in
farm animal nutrition for improved product quality. Agriculture 2015, 5, 1020–1034. [CrossRef]
12. Toop, T.A.; Ward, S.; Oldfield, T.; Hull, M.; Kirby, M.E.; Theodorou, M.K. AgroCycle—Developing a circular
economy in agriculture. Energy Proc. 2017, 123, 76–80. [CrossRef]
13. Möller, K.; Müller, T. Effects of anaerobic digestion on digestate nutrient availability and crop growth:
A review. Eng. Life Sci. 2012, 12, 242–257. [CrossRef]
14. Hao, X.; Ben, W.T.; Nelson, V. Agronomic values of anaerobically digested cattle manure and the separated
solids for barley forage production. Soil Sci. Soc. Am. J. 2016, 80, 1572–1584. [CrossRef]
15. Torres-Climent, A.; Martin-Mata, J.; Marhuenda-Egea, F.; Moral, R.; Barber, X.; Perez-Murcia, M.D.; Paredes, C.
Composting of the solid phase of digestate from biogas production: Optimization of the moisture, C/N ratio,
and pH conditions. Commun. Soil Sci. Plant. Anal. 2015, 46, 197–207. [CrossRef]
16. Oreopoulou, V.; Russ, W. Utilization of Byproducts and Treatment of Waste in the Food Industry; Springer: New
York, NY, USA, 2007.
17. Pampuro, N.; Caffaro, F.; Cavallo, E. Reuse of animal manure: A case study on stakeholders’ perceptions
about pelletized compost in northwestern Italy. Sustainability 2018, 10, 2028. [CrossRef]
18. Montemurro, F.; Ciaccia, C.; Leogrande, R.; Ceglie, F.; Diacono, M. Suitability of different organic amendments
from agro-industrial wastes in organic lettuce crops. Nutr. Cycl. Agroecosyst. 2015, 102, 243–252. [CrossRef]
19. Diacono, M.; Ferri, D.; Ciaccia, C.; Tittarelli, F.; Ceglie, F.; Verrastro, V.; Ventrella, D.; Vitti, C.; Montemurro, F.
Bioassays and application of olive pomace compost on emmer: Effects on yield and soil properties in organic
farming. Acta Agr. Scand. Sect. B Soil Plant Sci. 2012, 62, 510–518. [CrossRef]
20. Altieri, R.; Esposito, A. Evaluation of the fertilizing effect of olive mill waste compost in short-term crops.
Int. Biodeterior. Biodegrad. 2010, 64, 124–128. [CrossRef]You can also read