Structural Features of 1,3,4-Thiadiazole-Derived Ligands and Their Zn(II) and Cu(II) Complexes Which Demonstrate Synergistic Antibacterial Effects ...
←
→
Page content transcription
If your browser does not render page correctly, please read the page content below
International Journal of
            Molecular Sciences

Article
Structural Features of 1,3,4-Thiadiazole-Derived
Ligands and Their Zn(II) and Cu(II) Complexes
Which Demonstrate Synergistic Antibacterial Effects
with Kanamycin
Dariusz Karcz 1, * , Arkadiusz Matwijczuk 2 , Daniel Kamiński 3 , Bernadette Creaven 4 ,
Ewa Ciszkowicz 5 , Katarzyna Lecka-Szlachta 5 and Karolina Starzak 1
 1    Department of Analytical Chemistry (C1), Faculty of Chemical Engineering and Technology,
      Cracow University of Technology, 31155 Kraków, Poland; karolina.starzak@pk.edu.pl
 2    Department of Biophysics, University of Life Sciences in Lublin, 20-950 Lublin, Poland;
      arkadiusz.matwijczuk@up.lublin.pl
 3    Department of General and Coordination Chemistry and Crystallography, Institute of Chemical Sciences,
      Maria Curie-Sklodowska University in Lublin, 20-031 Lublin, Poland; dkami@umcs.pl
 4    School of Chemical and Pharmaceutical Sciences, Technological University Dublin, Kevin St., D2 Dublin,
      Ireland; bernie.creaven@tudublin.ie
 5    Department of Biotechnology and Bioinformatics, Faculty of Chemistry, Rzeszow University of Technology,
      35-959 Rzeszów, Poland; eciszkow@prz.edu.pl (E.C.); szlachta@prz.edu.pl (K.L.-S.)
 *    Correspondence: dariusz.karcz@pk.edu.pl; Tel.: +48-(12)-6282177

 Received: 9 July 2020; Accepted: 7 August 2020; Published: 10 August 2020

 Abstract: Classical synthetic protocols were applied for the isolation of three novel 1,3,4-thiadiazole
 derivatives which were then complexed with the biologically important Cu(II) and Zn(II) ions. All free
 ligands and their corresponding complexes were characterized using a number of spectroscopic
 techniques including Ultraviolet-visible (UV–vis), Fluorescence, Infrared (FT-IR), tandem liquid
 chromatography-mass (LC-MS), X-ray diffraction (XRD), and Nuclear Magnetic Resonance (NMR)
 spectroscopy (1 H, 13 C, HSQC, HMBC). The results obtained are consistent with the formation of
 dihydrate complexes, in which the chelation of the metal ion occurs via one of the thiadiazole
 nitrogen atoms and the deprotonated hydroxyl group of the neighboring resorcynyl moiety. The Zn(II)
 complexes utilize a 1:1 ligand–metal ratio, while in the Cu(II) complexes the ligand–metal ratio
 is 2:1. Although the antibacterial testing identified moderate activity of the compounds against the
 tested bacterial strains and additionally modest antioxidant activity, a strong synergistic antibacterial
 effect against Staphylococcus aureus, using concomitant treatment of thiadiazole derivatives with the
 commercial antibiotic kanamycin, was observed. The most active thiadiazole derivative demonstrated
 a minimal inhibitory concentration (MIC) of 500 µg/mL while it was 125 µg/mL in the presence of
 kanamycin. Moreover, in the presence of few thiadiazole derivatives the MIC value of kanamycin
 decreased from 0.39 µg/mL to 0.5 µg/mL. The antioxidant activity (IC50 ) of the most active thiadiazole
 derivative was determined as 0.13 mM which was nearly three-fold lower compared to that of
 TROLOX (0.5 mM).

 Keywords: 1,3,4-thiadiazole; thiadiazole ligands; thiadiazole complex; antibacterial; antioxidant;
 neurodegeneration; synergistic effect; kanamycin

1. Introduction
    Thiadiazoles are an important group of five-membered heterocycles demonstrating extraordinary
physiochemical properties including dual fluorescence emission [1–3], crystal solvatomorphism [4],

Int. J. Mol. Sci. 2020, 21, 5735; doi:10.3390/ijms21165735                         www.mdpi.com/journal/ijms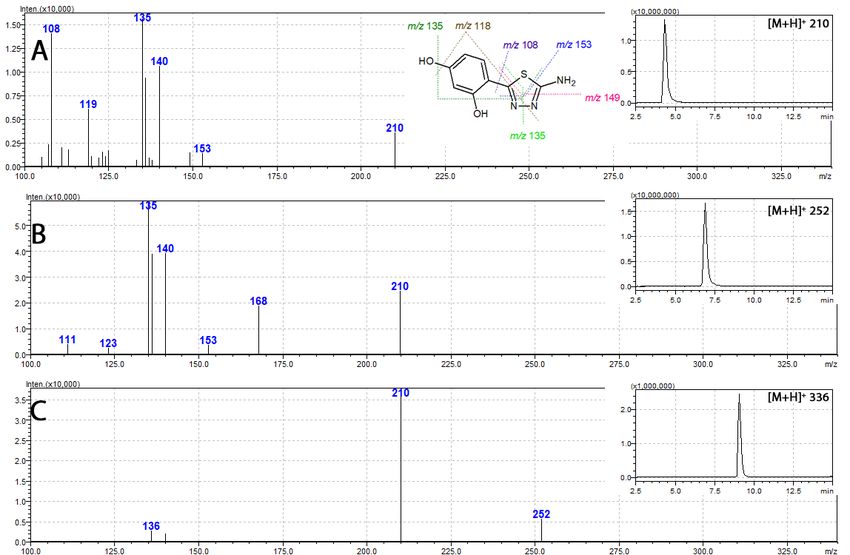
Int. J. Mol. Sci. 2020, 21, 5735                                                                    2 of 18

and keto-enol-like tautomerism [5]. Numerous reports have highlighted the antimicrobial,
anticancer, antioxidative, or anticonvulsant activities as characteristic of 1,3,4-thiadiazoles [6–8].
Due to these interesting features the thiadiazole-derived compounds were extensively studied
in our group [9–13], with several 1,3,4-thiadiazole derivatives reported to possess significant
acetylcholinesterase (AChE) and butyrylcholinesterase (BuChE) inhibition activities rendering them as
potential anti-neurodegenerative agents [14].
      Inhibition of AChE and BuChE enzymes is one of the existing approaches taken in the design
of novel anti-neurodegenerative agents. Given that neurodegenerative disorders may result from a
perturbed homeostasis of essential metals such as Cu(II) and Zn(II) [15,16], engineering of novel metal
chelators possessing AChE and BuChE inhibitory ability has been proposed as a new approach to the
treatment of neurodegenerative disorders such as Alzheimer’s or Parkinson’s diseases [17–20].
      Our previous studies on thiadiazole derivatives have focused on examination of the metal-binding
ability of 1,3,4-thiadiazoles bearing the o-hydroxyphenyl moiety at C5 carbon, which were used for the
isolation of a series of Zn(II), Cu(II), and Pd(II) complexes [21]. The spectroscopic characterization
of these complexes revealed significant structural differences in their metal–ligand ratios depending
on the central metal type; however, in all those complexes the o-hydroxyphenyl moiety together
with the neighboring thiadiazole nitrogen were identified as the metal binding sites. These findings
were consistent with widely reported fact that thiadiazole-derived ligands may demonstrate versatile
coordination modes which strongly depend on the presence of additional substituents [8,22–24].
This diversity is particularly high in case of the coordination to Cu(II) and Zn(II) ions, which are
well-known for their ability to adopt a wide variety of coordination modes [25,26].
      Our current studies focus on the isolation of 1,3,4-thiadiazole ligands 1–3, which would keep
their metal-chelating ability, while offering the possibility for additional structural modifications
(Figure 1). Therefore in this work, the o-hydroxyphenyl attached to the C5 carbon of the thiadiazole
ring remained a main structural motif, while the C2 position was substituted by the simple -NH2
group, as the family of 2-amino-1,3,4-thiadiazoles belong to the most extensively studied thiadiazole
derivatives. Secondly, regardless of the fact that the most biologically active 2-amino-1,3,4-thiadiazoles
are usually substituted with an aromatic ring at their C5 carbon, such tandems with polyphenolic
moieties are limited. This relative scarcity prompted us to revisit the classical synthetic route in the
1,3,4-thiadiazloes synthesis aiming at obtaining 2-amino-2-(2,4-dihydroxy)-1,3,4-thiadiazole 1 as a
model ligand for subsequent reaction with Zn(II) and Cu(II) salts. Introduction of additional reactive
substituents, and especially the lone electron pair donors such as -OH and -NH2 , is associated with
an increase in the number of potential metal-binding sites. In order to assess the possibility for
alternative coordination modes, compound 1 was modified by acetylating its -NH2 and both its -OH
groups. The metal coordination ability of the resulting mono-acetylated and tri-acetylated derivatives
(2 and 3, respectively) was compared to that of 1 (Figure 1). The structures of all compounds were
elucidated using spectroscopic methods. Moreover, antioxidant activity testing and antimicrobial
screening against a limited number of bacterial strains was performed on the thiadiazole free ligands
and their Zn(II) complexes. Therefore, the main aim of our current work was an isolation and structural
elucidation of newly synthesized thiadiazole derivatives and spectroscopic examination of their
metal-binding ability. Secondly, given the fact that the thiadiazole derivatives and especially the metal
complexes obtained are novel, their antibacterial and antioxidant activity was assessed for a first time.
Thirdly, based on the synergistic antifungal effects that are characteristic of the structurally similar
thiadiazoles [12], a possibility for the synergism with commercial antibacterial agent, kanamycin, was
examined. Our studies were driven by hypotheses that determination of the metal-binding ability of
thiadiazole ligands obtained may be a new approach to treatment of neurodegenerative disorders,
while the assessment of their synergistic interactions with known antibiotics may shed new light on
the formulation of more effective antibacterial medicines.
Int. J. Mol. Sci. 2020, 21, 5735 3 of 18
Int. J. Mol. Sci. 2020, 21, x FOR PEER REVIEW 3 of 19
Figure Structures
1. 1.
Figure of the
Structures 1,3,4-thiadiazole-derived
of the ligands
1,3,4-thiadiazole-derived 1, 2,1,3,2,and
ligands the numbering
3, and system
the numbering of atoms
system of
atoms
(red) used(red)
for used
the assignment of the 1 H
for the assignment the 113
of and HCand
NMR13C NMR chemical shifts.
chemical shifts.
2. 2.
Results
Results
2.1. Synthesis
2.1. Synthesisofof1,3,4-Thiadiazole-Derived
1,3,4-Thiadiazole-DerivedLigands
Ligands and
and Their Cu(II) and
Their Cu(II) and Zn(II)
Zn(II)Complexes
Complexes
InIn
thethe
first synthetic
first syntheticstepstep
2-amino-5(2,4-dihydroxyphenyl)-1,3,4-thiadiazole
2-amino-5(2,4-dihydroxyphenyl)-1,3,4-thiadiazole 1 was obtained
1 was as result
obtained as
of result
the classical
of the POCl 3 -mediated
classical POCl reaction between
3-mediated 2,4-dihydroxybenzoic
reaction acid and thiosemicarbazide.
between 2,4-dihydroxybenzoic acid and
Compound 1 was then
thiosemicarbazide. acetylated1with
Compound wasusethenofacetylated
aqueous acetic anhydride
with use yielding
of aqueous aceticthe amide derivative
anhydride yielding 2,
while the addition of catalytic amount of H SO
the amide derivative 2, while the addition 2of catalytic 4 allowed the formation of fully acetylated derivative
amount of H2SO4 allowed the formation of fully 3.
Allacetylated
thiadiazole derivatives
derivative were then reacted
1–3 thiadiazole
3. All with 1–3
derivatives Cu(II) andthen
were Zn(II) acetatewith
reacted salts, which
Cu(II) in the
and case
Zn(II)
of acetate
compounds 1 and 2inresulted
salts, which the caseinofthe formation1 of
compounds andtheir respective
2 resulted Cu(II)
in the and Zn(II)
formation complexes
of their respective 4–7.
Compound did not
Cu(II) and 3Zn(II) form any
complexes 4–7.metal complexes
Compound 3 didwith the metal
not form saltscomplexes
any metal used. Thewith synthetic
the metalpathway
salts
used. Thethe
illustrating synthetic pathway
syntheses illustrating
of thiadiazole the syntheses
derivatives of thiadiazole
is given in Figurederivatives
2. is given in Figure 2.
2.2. H-NMR Spectroscopy
The 1 H-NMR spectrum of 1 consists of six signals originating from the resorcynyl ring and the
-NH2 group. The two most downfield-positioned broad signals at 10.91 and 9.84 ppm result from the
phenolic -OH groups, while the -NH2 substituent gives rise to a broad singlet at 7.15 ppm. These signals
come from exchangeable hydrogen atoms and disappear upon the treatment of sample with D2 O
(the D2 O exchange spectrum not shown). The remaining three signals present in the aromatic region
are assigned based on their multiplicities, coupling constants, and integration (Table 1, Figure S1).
In more detail, the double doublet at 6.36 ppm represents the H10 proton coupling with another two
doublets at 7.53 and 6.38 ppm, which originate from the respective H11 and H8 protons.
Table 1. 1 H-NMR signals of the 1,3,4-thiadiazole derivatives 1–3.
1 H-NMR Signals: δ (ppm) *, Multiplicity **, and J Value (Hz)
Thiadiazole
Serivative H7 H8 H9 H10 H11 H12 H14 H16 H18
6.36, dd,
10.91, s 6.38, d, 9.84, s, 7.53, d, 7.15, s,
1 J1 = 8.5, - - -
(-OH) J = 2.3 (-OH) J = 8.5 (-NH2 )
J2 = 2.3
6.40, dd,
10.90, s 6.45, d, 9.92, s, 7.91, d, 12.32, s,
2 J1 = 8.7, 2.18, s - -
(-OH) J = 2.3 (-OH) J = 8.7 (-NH-)
J2 = 2.3
7.26, dd,
7.29, d, 8.2, d, 12.68, s,
3 - - J1 = 8.5, 2.22, s 2.31, s 2.38, s
J = 2.3 J = 8.5 (-NH-)
J2 = 2.3
* = numbering system of atoms shown in Figure 1; ** s = singlet, d = doublet, dd = double doublet.
Figure 2. Synthetic pathway for the synthesis of 1,3,4-thiadiazole-derived ligands 1–3, and their
corresponding Cu(II) and Zn(II) complexes 4–7: (A) POCl3, 75 °C; (B) Ac2O, H2O, reflux; (C) Ac2O,thiosemicarbazide. Compound 1 was then acetylated with use of aqueous acetic anhydride yielding
the amide derivative 2, while the addition of catalytic amount of H2SO4 allowed the formation of fully
acetylated derivative 3. All thiadiazole derivatives 1–3 were then reacted with Cu(II) and Zn(II)
acetate salts, which in the case of compounds 1 and 2 resulted in the formation of their respective
Cu(II)
Int. and
J. Mol. Sci.Zn(II) complexes
2020, 21, 5735 4–7. Compound 3 did not form any metal complexes with the metal4salts
of 18
used. The synthetic pathway illustrating the syntheses of thiadiazole derivatives is given in Figure 2.
Figure 2.
Figure 2. Synthetic
Synthetic pathway
pathway for
for the synthesis of
the synthesis of 1,3,4-thiadiazole-derived
1,3,4-thiadiazole-derived ligands 1–3, and
ligands 1–3, and their
their
Zn(II) complexes
corresponding Cu(II) and Zn(II) complexes 4–7:
4–7: (A) ◦
POCl33, 75 °C;
(A) POCl (B) Ac
C; (B) Ac22O, H
H22O, reflux; (C) Ac
Ac22O,
H2 SO4 , reflux; (D) Cu(CH3 COO)2 xH2 O, MeOH/H2 O, reflux; (E) Zn(CH3 COO)2 xH2O, MeOH/H2 O,
reflux. For better clarity, the hydrated water was omitted in the structures of complexes.
Selective N-acetylating of 1 with subsequent formation of 2, manifests in the disappearance of
the amine peak and gives rise to two new signals, namely the highly deshielded amide singlet at
12.32 ppm and an aliphatic -CH3 singlet at 2.18 ppm. Moreover, a significant sharpening of both -OH
signals as well as a slight downfield shift of the aromatic peaks is observed (Table 1, Figure S2).
Simultaneous acetylating of the amine and both phenolic groups in 1 resulted in the formation of
3, with the subsequent replacement of their respective signals with a series of singlets characteristic
of two methyl esters and one amide moiety formation (Table 1). Also, compared to those of 1 and 2,
further downfield shifts of the remaining signals were observed (Figure S3).
The 1 H-NMR spectra of thiadiazole derivatives 1–3 revealed the presence of additional set of low
intensity signals identified as originating from a series of isomers, which may form due to a possibility
for the rotation around the thiadiazole-resorcynyl-linking bond. Based on the integration of two sets of
signals it has been determined that the ratio between the two main isomers does not exceed 1:10 and is
most likely solvent-dependent. Although the presence of isomers makes the 1 H-NMR spectra slightly
more complicated, neither HPLC-MS nor microanalysis data indicated the presence of significant
amount of other impurities. Therefore, the structure of the major isomer was assumed as identical to
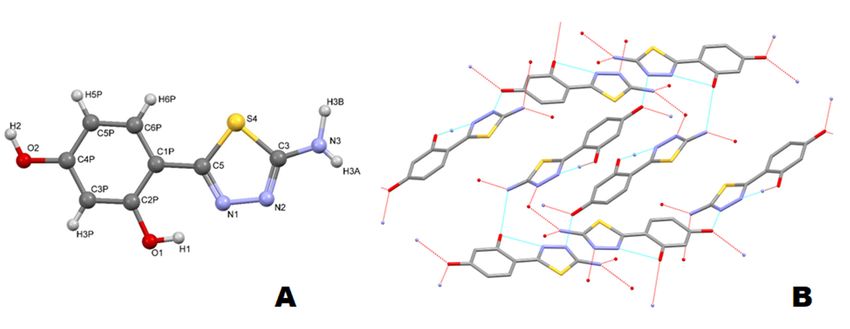
that obtained from X-ray diffraction analysis (Figure 3A).Int.
Int.J.J.Mol.
Mol. Sci. 2020, 21,
Sci. 2020, 21, 5735
x FOR PEER REVIEW 55of
of18
19
Figure 3. Crystal structure of thiadiazole 1. (A) Atoms are numbered according to the cif file (see
Figure 3. Crystal
supplementary structure
material); (B)of thiadiazole
Packing of the1. (A) Atoms
molecules in aare numbered
crystal net (foraccording to the
better clarity, thecif file (see
hydrogen
supplement);
atoms (B) Packing of the molecules in a crystal net (for better clarity, the hydrogen atoms are
are omitted).
omitted).
Due to their sparing solubility, the Zn(II) complexes 5 and 7 did not give clear NMR spectra.
Due to their
Nevertheless, sparing
in both casessolubility,
the signalthe
at Zn(II) complexes1.85 ppm
approximately and 7wasdid present,
not give evidencing
clear NMR the spectra.
key
Nevertheless,
structural featurein of
both cases
Zn(II) the signal
complexes at approximately
formed, 1.8 ppm
namely the acetate was present,
ion partaking evidencing around
in coordination the key
structural
the feature
metal center. of Zn(II)
These resultscomplexes formed,
were consistent withnamely the acetate
microanalysis data, ion partaking
which correlatedin best
coordination
with the
around the metal center. These results were consistent with microanalysis data, which
structure consisting of one thiadiazole-derived ligand and one acetate ion coordinated to the Zn(II) correlated best
with the
central structure
metal. consisting
Moreover, of one thiadiazole-derived
the residual ligand broadened
water peak was unusually and one acetate
which ion coordinated
may to the
be an evidence
for the presence of additional aqua ligands. The NMR spectra of Cu(II) complexes 4 and 6 werebenot
Zn(II) central metal. Moreover, the residual water peak was unusually broadened which may an
acquired due to their paramagnetic character, which effects in extended T2 relaxation times, thus6
evidence for the presence of additional aqua ligands. The NMR spectra of Cu(II) complexes 4 and
were not acquired
significant broadening dueof toNMR
their paramagnetic
signals. character, which effects in extended T2 relaxation times,
thus significant broadening of NMR signals.
2.3. C-NMR Spectroscopy
2.3. C-NMR Spectroscopy
The 13 C-NMR signals in thiadiazole ligands were assigned based on a routine 13 C NMR spectrum
The 13C-NMR
and additional signalsexperiments
2D-NMR in thiadiazole ligandsHMBC).
(HSQC, were assigned based on
As expected, a routine 131Cshows
compound NMR 8spectrum
carbon
and additional
signals. Compared 2D-NMR 13
to the experiments (HSQC,
C NMR spectrum of HMBC). As expected,
1 the spectrum compound
of 2 shows 1 shows
an additional two8 carbon
carbon
signals.due
signals Compared to the moiety,
to the amide 13C NMR spectrum of 1 the spectrum of 2 shows an additional two carbon
while the fully acetylated compound 3 has six additional peaks
signals2)due
(Table to the
(Figures amide moiety, while the fully acetylated compound 3 has six additional peaks
S4–S6).
(Table 2) (Figures S4–S6).
Table 2. 13 C-NMR data of the 1,3,4-thiadiazole derivatives 1–3.
13 C-NMR Signals (ppm) *
Thiadiazole
Derivative C2 C5 C6 C7 C8 C9 C10 C11 C13 C14 C15 C16 C17 C18
1 167.84 156.03 108.98 156.43 103.00 160.22 108.35 129.20 - - - - - -
2 168.79 158.87 109.15 156.35 102.88 160.94 108.62 129.03 158.89 22.88 - - - -
3 169.24 155.92 121.36 147.89 118.21 152.53 121.02 129.72 160.03 22.87 168.96 21.31 169.33 21.68
* = numbering system shown in Figure 1.
2.4. X-ray Diffraction
The asymmetric part of unit cell contains one planar molecule. In the solid state the rotation
in the molecule is prevented by a hydrogen bond between the phenolic o-hydroxyl group and the
neighboring N atom of the thiadiazole ring. Both hydroxyl groups are involved in the formation of
intermolecular hydrogen bonds (Figure 3B). The o-hydroxyl group forms an intramolecular H-bond
with the amine moiety of neighboring molecule with a distance A..H of 2.236 Å. The second phenolic
-OH interacts with two neighboring molecules acting as both an acceptor of hydrogen bond from the
amine group (A H 1.842 Å), and as a donor of H-bond to the nitrogen atoms from thiadiazole ring
(D-H A: 1.757 Å and 2.558 Å) (first and second neighboring molecule, respectively). The resorcynyl
rings of thiadiazole molecules from neighboring layers (distance of 3.36 Å) interact through π···πInt. J. Mol. Sci. 2020, 21, 5735 6 of 18
stacking interactions. The bond lengths and valence angles in the thiadiazole molecule are similar
to those previously measured for structurally similar derivatives (within error bars). The detailed
crystallographic data for 1 is given in (Figure S7, Table 3 and Tables S1–S3).
Table 3. Crystallographic parameters and details of refinement for the measured crystal of compound 1.
The labels are related to the Figure 3A.
Parameter Value
Molecular formula C8 H7 N3 O3 S
Temperature (K) 120(2)
Crystal system monoclinic
Space group I 2/a
a (Å) 13.421(2)
b (Å) 7.1590(10)
c (Å) 18.454(2)
α (◦ ) 90
β (◦ ) 100.79(2)
γ (◦ ) 90
V (Å3 ) 1741.73
Z 8
Calculated density (g cm−3 ) 1.596
Absorption coefficient (mm−1 ) 3.133
F (000) 864
Completeness 97%
θ range for data collection (◦ ) 4.88–76.15
−13 ≤ h ≤ 16
Index ranges −8 ≤ k ≤ 7
−22 ≤ l ≤ 15
6137/3789
Reflections collected/unique
(Rint = 0.0353)
Observed/restraints/parameters 1761/0/151
Goodness-of-fit on F2 1.217
R1 = 0.0551
Final R indices (I > 2 sigma(I))
wR2 = 0.1679
R1 = 0.0709
R indices (all data)
wR2 = 0.2225
Largest diff. peak and hole (e Å−3 ) 0.5/−0.7
CCDC number 1845297
2.5. IR (ATR) Spectroscopy
The IR spectra of all of the ligands and their respective Cu(II) and Zn(II) complexes are shown
in supplementary material (Figures S8–S10). The high frequency region in the FT-IR spectrum of 1
is dominated by three sharp bands at 3385, 3320, and 3206 cm−1 . Intramolecular hydrogen bonding
between the thiadiazole nitrogen and the phenolic group residing at carbon C7 results in low intensity
and significant broadening of the -OH stretching band [21,27]. It is therefore very likely that the band
at 3385 cm−1 originates from the -OH group present at the C9 carbon, whereas the two remaining
sharp bands in this region, namely at 3320 and 3206 cm−1 , represent the respective symmetrical and
asymmetrical stretches of the -NH2 group [14,21,27,28]. The thiadiazole ring formation manifests in
the presence of a strong and sharp band at approximately 1630 cm−1 characteristic of the heterocyclic
-C=N- stretches [21]. Another sharp band at 1600 cm−1 represents the N-H bending vibrations of the
amine [28]. The central part of fingerprint region (1320–1120 cm−1 ) is occupied by a series of sharp
bands attributed to the in-plane O-H bending and the C-N stretching vibrations, while the characteristic
sharp C-O stretching maxima are present at lower frequency (1270–1120 cm−1 ) [21,27]. A series of
weak intensity bands below 660 cm−1 originates from the -C-S-C- stretching of the thiadiazole ring as
well as out-of-plane vibrations of the hydroxyl O-H bonds [21].
Compared to that of 1, in the IR spectrum of N-acetylated derivative 2 two relatively sharp bands
are present at 3309 and 3158 cm−1 , most likely as result of the respective phenolic O-H and secondary
amide N-H stretching. The carbonyl C=O stretching vibration of the amide moiety is represented by a
sharp band at 1680 cm−1 [27]. The most significant change in the central part of the fingerprint regionInt. J. Mol. Sci. 2020, 21, 5735 7 of 18
is due to the appearance of sharp band at 974 cm−1 , which may be assigned to the N-H out-of-plane
bending vibration. The second most significant change in this region is a band at 623 cm−1 suggesting
the structural alterations made near the -C-S-C- system of the thiadiazole ring [21].
In the case of fully acetylated compound 3, only one broad band is present in the region above
3000 cm−1 , representing most likely the amide N-H stretching. The esterification of both phenolic
OH groups manifests in the appearance of high intensity and relatively broad band at 1771 cm−1 ,
originating from the C=O stretches of the acetate moieties. Another sharp band at 1695 cm−1 represents
the C=O stretching of the amide [27]. These features are accompanied with a series of moderate
changes in the fingerprint region of the spectrum, with prominent bands present at 1186, 1014, 882,
and 672 cm−1 .
The spectra of complexes 4–7 revealed a broad and moderate intensity bands spanning from
approximately 3500 to 3000 cm−1 suggesting the presence of hydrates, consistent with microanalysis
result and AAS (see Section 2.7). This broad band overlapped the remaining characteristic bands
which are normally expected to appear in this region, and particularly the N-H stretching. Thus,
the involvement of the -NH2 group in the complex formation cannot be confirmed by IR spectroscopy.
Nevertheless, in all cases a band with maximum intensity between 3450–3300 was still visible suggesting
that the peripheral phenolic -OH group of the resorcinol is not involved in binding to the metal center.
Compared to the spectrum of free ligand 1, the corresponding complexes 4 and 5 (Cu(II) and Zn(II)
complexes, respectively) revealed a moderate shift of the thiadiazole C=N band, from 1628 cm−1 in 1
to 1607 and 1610 cm−1 in 4 and 5, respectively. This points at the ligand–metal interaction occurring
via thiadiazole nitrogen, and is further evidenced by numerous changes in the fingerprint region of
the spectra, suggesting the metal chelating by both thiadiazole nitrogen and the nearby resorcynyl
-OH group (deprotonated). The features relevant to coordination with the metal center in complexes
incorporating the N-acetylated ligand 2 (complexes 6 and 7) are similar to those of compounds 4 and 5.
In addition, the band assigned to the C=O stretching of the amide remained unchanged in 2, 6, and 7,
evidencing that this moiety is not involved in coordination. This in turn confirmed the hypothesis that
the metal coordination occurs via the phenolic -OH and one of the thiadiazole N atoms. Additional
details were noticed in the spectra of Zn(II) complexes 5 and 7, in which the presence of acetate ion was
postulated, namely the broadening of bands present in the region of approximately 1680 cm−1 . In these
complexes, the band originating from the coordinated acetate ion is most likely overlapped with those
representing the C=N stretches. The presence of the acetate ion was confirmed by microanalysis (vide
infra) for the Zn(II) complexes.
2.6. Mass Spectrometry
Regardless of the possibility of free rotation around the resorcynyl-thiadiazole-linking bond the
HPLC analysis of each free ligand 1–3 revealed only one peak (Figure 4 insets). This suggests that at
the aqueous methanolic environment (methanol–water gradient applied for the analysis) only one
isomer is present (Figure 3A).2.6. Mass Spectrometry
Regardless of the possibility of free rotation around the resorcynyl-thiadiazole-linking bond the
HPLC analysis of each free ligand 1–3 revealed only one peak (Figure 4 insets). This suggests that at
Int.the aqueous
J. Mol. methanolic
Sci. 2020, 21, 5735 environment (methanol–water gradient applied for the analysis) only one
8 of 18
isomer is present (Figure 3A).
Figure
Figure 4. 4. Massspectra
Mass spectraofofthiadiazole
thiadiazolederivatives
derivatives 1,
1, 2,
2, and
and 33 (A,
(A, B,
B, and
and C,
C,respectively)
respectively)together
togetherwith
with
their respective mass chromatograms (insets).
their respective mass chromatograms (insets).
Tandem
Tandem massspectrometry
mass spectrometryshowed
showedsimilar
similar fragmentation
fragmentation patterns
patternsfor
forall
allthiadiazole-derived
thiadiazole-derived
ligands 1–3. Their respective mass spectra revealed an intensive signal of m/z 210,assigned
ligands 1–3. Their respective mass spectra revealed an intensive signal of m/z 210, assignedtotothat
thatofof
[M + +
H] +, which corresponds to the protonated molecular ion of 1. The presence of these fragments
[M + H] , which corresponds to the protonated molecular ion of 1. The presence of these fragments
in in spectra
spectra ofofboth
both2 2and
and3 3(Figure
(Figure4)4)points
pointsat
atthe
the loss
loss of
of acetyl
acetyl moieties
moieties as
as an
aninitial
initialfragmentation
fragmentation
steps. In more detail, the fragmentation of fully acetylated compound 3 (m/z 336 [M ++H]
steps. In more detail, the fragmentation of fully acetylated compound 3 (m/z 336 [M H])+starts
) startswith
+
with
the loss of two O-acetyl moieties and leads to the formation of m/z 252 assigned to [M + H]+ ion of 2.
the loss of two O-acetyl moieties and leads to the formation of m/z 252 assigned to [M + H]+ ion of 2.
The subsequent loss of the amide acetyl results in the formation of m/z 210, characteristic of [M + H]+
The subsequent loss of the amide acetyl results in the formation of m/z 210, characteristic of [M + H]+
of 1. Further fragmentation steps in 1, 2, and 3, are identical and rely upon the degradation of m/z 210
of 1. Further fragmentation steps in 1, 2, and 3, are identical and rely upon the degradation of m/z 210
[M + H] + ion. This involves multiple bond-breaking decomposition steps of the thiadiazole ring with
[M + H]+ ion. This involves multiple bond-breaking decomposition steps of the thiadiazole ring with
the formation of a number of characteristic signals, namely the m/z 108, 135, 149, and 153 [29]. In the
the formation of a number of characteristic signals, namely the m/z 108, 135, 149, and 153 [29]. In the
case of the metal complexes, the insolubility of their complexes did not allow for their
case of the metal complexes, the insolubility of their complexes did not allow for their characterization
characterization by mass spectrometry.
by mass spectrometry.
2.7. Elemental Analysis (C,H,N) and Atomic Absorption (AAS) Spectroscopy
2.7. Elemental Analysis (C,H,N) and Atomic Absorption (AAS) Spectroscopy
The results determined for the free thiadiazole ligands 1–3 confirmed their acceptable purities,
The results determined for the free thiadiazole ligands 1–3 confirmed their acceptable purities,
which were additionally supported by sharp melting point ranges recorded for these compounds as
which
well were
as theadditionally
NMR spectrasupported by sharp
which do not melting
show the point
presence ofranges recorded
additional for
signals these
from compounds as
impurities.
well asThe
the NMR spectra which do not show the presence of additional signals from impurities.
data obtained from Zn(II) complexes 5 and 7, suggest the structures incorporating one
The dataligand
thiadiazole obtained from
(1 and 2, Zn(II) complexes
respectively) 5 and
and one 7, suggest
acetate the structures
ion being bound to the incorporating one
central metal,
thiadiazole ligand
although some (1 and 2,may
controversy respectively)
be raised inand one
terms of acetate
the numberion of
being boundaqua
additional to the central
ligands metal,
present.
although some controversy may be raised in terms of the number of additional
Nevertheless the correlation of data obtained from CHN and AAS measurements suggests theaqua ligands present.
Nevertheless the correlation of data obtained from CHN and AAS measurements suggests the presence
of two additional water molecules present in both Zn(II) complexes. The presence of acetate counter
ion in 5 and 7 is supported by the NMR spectra, which show the characteristic acetate singlet at
approximately 1.8 ppm (see Section 2.2), while the presence of additional aqua ligands is supported
by the IR spectra, which are characteristic of broad and relatively low intensity bands spanning
between 2800 and 3400 cm−1 (Figures S9 and S10). These findings point to similar coordination modesInt. J. Mol. Sci. 2020, 21, 5735 9 of 18
in complexes 5 and 7 to those previously obtained in our group [21,30]. Therefore, it is likely that
the Zn(II) ion in 5 and 7 is coordinated with thiadiazole ligand via the deprotonated phenolic -OH
of the resorcynyl moiety and the neighboring N atom of the thiadiazole ring. Other lone electron
pair-containing substituents of the thiadiazole ligands, namely the second phenolic -OH, -NH2 group
(5), amide moiety (7), and the remaining two heteroatoms of the thiadiazole ring (N and S) are not
involved in binding with Zn(II) ion.
Both CHN and AAS data of the Cu(II) complex 6 fit best with the structure of dihydrate complex,
utilizing 2:1 ratio between thiadiazole ligand and the central metal. This corresponds well with
structures of the previously reported Cu(II) complexes, incorporating structurally similar thiadiazole
ligands [21,30], and is consistent with the lack of acetate ion in the complex structure. Also, the structure
of 6 is proposed based on the fact that the thiadiazole ligand 2 lacks the amine moiety. Compared to
that of the amine, the amide group present in 2 is characteristic of much lower affinity to the metal ions
and hence its involvement in coordination is unlikely.
The data obtained from Cu(II) complex 4 show discrepancies between the calculated and
experimentally determined values and due to that fact are less conclusive. More specifically,
the comparison of thiadiazole-derived ligands 1 and 2 structures together with the CHN and AAS
results from their respective Cu(II) complexes 4 and 6 enable the hypothesis that the formation of
4 may involve the coordination via the -NH2 group or the complex formed may be polymeric in
nature, which is consistent with the low solubility of the complexes formed. This in turn points at
the possibility of much more complicated structure of the complex 4 compared to that of 6. The more
detailed information on structures of the Cu(II) complexes formed and especially the complex 4 would
require a more in-depth studies. The microanalysis (C, H, and N) and AAS data together with the
proposed formulae of complexes are given in Table 4.
Table 4. Microanalysis (C,H,N), AAS, molecular weight, and chemical formulae of thiadiazole
derivatives 1–7.
%C %H %N %M *
Compound No Mw ** (g/mol) Chemical Formula **
Calc Found Calc Found Calc Found Calc Found
1 45.93 42.96 3.37 3.30 20.08 17.84 - - 209.22 C8 H7 N3 O2 S
2 47.80 46.34 3.61 3.41 16.72 16.21 - - 251.26 C10 H9 N3 O3 S
3 50.15 49.02 3.91 3.66 12.53 12.50 - - 335.33 C14 H13 N3 O5 S
4 37.24 26.85 3.13 2.34 16.29 10.69 12.31 24.67 516.01 C16 H16 CuN6 O6 S2
5 32.58 30.98 3.55 2.74 11.40 12.02 17.73 16.93 368.67 C10 H13 N3 O6 SZn
6 40.03 37.67 3.36 2.95 14.01 12.90 10.59 12.04 600.08 C20 H20 CuN6 O8 S2
7 35.09 37.01 3.68 3.02 10.23 11.55 15.92 13.21 470.71 C12 H15 N3 O7 SZn
* M = Metal. ** Proposed based on CHN and AAS analysis.
2.8. UV–Vis Spectroscopy
The UV–vis spectra of all compounds recorded in methanol are presented in the supplementary
material (Figure S8). Although the free thiadiazole ligands 1–3 were soluble in methanol, the overall
low solubility of complexes 4–7 made their analysis more difficult. Nevertheless, the satisfactory
quality of the spectra was achieved by preparing the 1 µM solution of each sample.
All compounds have their absorption maxima in the UV region with significant ‘tailing’ of
the bands onto the visible range of the spectra. In compounds 1 and 2 the spectra were almost
identical, each demonstrating two distinct bands at approximately 290 and 325 nm (Figure S11) and
representing the π → π* transitions. Similarly to those of previously reported structures [3,5,31]
the high energy and relatively low intensity band originates from the transitions occurring within
the phenolic ring, while the lower energy but more intensive band occurs due to the presence of
thiadiazole heterocycle, which interacts with the neighboring resorcynyl ring via intramolecular
hydrogen bond formed by the -OH group and one of the thiadiazole N atom (See Figure 3B). Moreover,
the presence of resorcinol moiety enables the possibility for keto-enol-like tautomerism, which is
another structural feature characteristic of this group of compounds and affects the energy of electronic
transitions [5]. The acetylating of -NH2 group in 1 with the formation of amide moiety in 2 does notInt. J. Mol. Sci. 2020, 21, 5735 10 of 18
alter the chromophore system, hence the lack of significant differences between the spectra of 1 and 2.
In turn, the spectrum of fully acetylated compound 3 is characteristic of only one broad band with the
maximum at 293 nm. This obviously is associated with the lack of intramolecular hydrogen bond and
steric hindrance to planarity introduced be the acetyl moieties, which affect the charge distribution at
the chromophore and result in a shift of the main absorption band towards the higher energy.
The complexation to Cu(II) and Zn(II) ions does not result in any significant shifts of the main
absorption band, except in complex 5, which has its lower energy band shifted from 294 to 342 nm.
This points at the structural similarities in all the complexes formed and supports the proposed
ligand–metal ratios. Also, the shift of the absorption maximum towards the lower energy region
observed in the spectrum of complex 5 is not extraordinary and may be assigned to the charge transfer
occurring from the metal to ligand (MLCT), which in turn evidences the complex formation [21].
A significant broadening of the lower energy band is a main feature observed in spectra of all complexes
4–7, suggesting the presence of additional transitions related to charge transfer between the ligand and
the metal center [21]. The high energy band at ~290 nm is observed in all spectra of complexes but
in all cases its intensity is much lower compared to that of the corresponding free ligand. The bands
associated with d → d* transitions in the complexes were not observed, as the concentration at which
spectra were recorded was not sufficient to record bands with low molar absorptivity values.
2.9. Fluorescence Spectroscopy
The fluorescence emission spectra of all compounds were recorded using 0.25 µM methanolic
solutions of compounds obtained by four-fold dilution of 1 µM samples, which were previously used
for the UV–vis measurements. The use of 0.25 µM solutions allowed for an elimination of inner filter
effect, while offering the possibility for direct comparison of the fluorescence of free ligands as well as
metal complexes. All spectra were recorded at identical conditions using the excitation wavelength
λEx = 290 nm. The results are presented in Figure S12 of supplementary material.
The fluorescence spectra of free ligands 1 and 2 have their respective maxima at 380 and 377 nm,
while the emission band in compound 3 shows maximum at 361 nm. These differences depend clearly
on the substituents present in compound 1–3, and particularly on the acetyl moieties. In more detail,
the compound 1, which does not have any acetyl group is characteristic of relatively low energy
emission (λEm(Ex290) = 380 nm). Compared to that of compound 1, the mono-acetylated compound 2 has
its emission maximum slightly shifted towards higher energy (λEm(Ex290) = 377 nm), while the highest
energy emission is attributed to the fully acetylated compound 3 (λEm(Ex290) = 361 nm). These differences
may be explained based on the crystallographic data, which evidenced the planar structure of the free
ligand 1 (see Section 2.4). In more detail, the planarity of 1 is stabilized by an internal hydrogen bond
between the ortho-hydroxyl group and the neighboring thiadiazole nitrogen atom. Also, this structural
feature is present in 2 suggesting its planarity similar as that of 1. In terms of the fluorescence emission,
the planarity and relative rigidity in 1 and 2 effects in nearly identical wavelengths of their fluorescence
maxima, whereas in 3 wherein the planarity is distorted the fluorescence band is positioned at the
higher energy wavelength [1,2,32].
In terms of the fluorescence intensities it is worth noting that the fluorescence intensity in 2 is
lower compared to that of 3, but higher than that of 1. Apparently, the -NH2 group in 1 contributes
(to some extent) to the non-radiative dissipation of excitation energy, most likely by the formation of
hydrogen bonds with environment (solvent or other ligand molecules). Apparently, the acetylating
of the amine group in 2 weakens the interactions mentioned, which in turn effects in an increase
in fluorescence intensity of the amide derivative formed. This effect is even more pronounced in
compound 3 which demonstrated the most intensive fluorescence in the series.
Complexation of 1 and 2 to the metal salts did not effect in any significant shift of the emission
maxima of the complexes compared to those of the corresponding free ligands, except the Zn(II)
complex 5, which had its emission maximum shifted to 413 nm. All the remaining complexes showed
their emission maxima at approximately 380 nm. It is highly likely that the planarity of ligands 1Int. J. Mol. Sci. 2020, 21, 5735 11 of 18
and 2 is distorted as result of the replacement of the internal hydrogen bond with the coordination
bonds with the central metal. Therefore, in the complex 5, the shift of emission maximum towards
lower energy may be associated with the possibility that upon complexation, the ligand 1 adopts
the non-planar geometry. Although this feature clearly evidences the that the complex is formed it
cannot be considered as unambiguous evidence for the amine group partaking in coordination to the
metal center.
Compared to the spectra of free ligands 1 and 2, a significant drop in fluorescence intensities
of their corresponding complexes was observed. Although the complexation increases the rigidity
of the ligand the coordination to metal ion may be attributed to the specific conformation which
does not necessarily favors the radiative dissipation of the excitation energy, thus the fluorescence
drop observed in the emission spectra of the complexes. In case of the Cu(II) complexes 4 and 6,
the fluorescence intensity drop is most likely associated with the internal conversion from the excited
MLCT state [21,33]. Interestingly, also the Zn(II) complexes 5 and 7 demonstrated notably lower
fluorescence intensities compared to those of their corresponding free ligands, suggesting the internal
conversion as the main relaxation pathway in the series of complexes obtained.
2.10. Antioxidant Activity
The antioxidant activity of thiadiazole ligands 1–3 was assessed with use of spectrophotometrical
method based on a reduction of DPPH· radicals at room temperature. The results obtained were
compared with those of TROLOX (Table 5). Due to the solubility issues, the antioxidant activity of the
complexes remained undetermined.
Table 5. Antioxidant activity and IC50 values of free thiadiazole ligands 1–3 and TROLOX after
30 minutes of reaction with DPPH· radicals (± standard deviation (SD) calculated from experiments
carried out in triplicate).
Compound mM Antioxidants/mM TE IC50 (mM)
1 0.08 ±0.00 0.60 ±0.01
2 0.35 ±0.03 0.13 ±0.00
3 0.41 × 10⁻³ ±0.02 × 10⁻³ 126.78 ±2.25
TROLOX 1.00 ±0.01 0.05 ±0.00
All three thiadiazole ligands 1–3 demonstrated a significantly lower antioxidant activity compared
to that of TROLOX (which equals 1 once expressed as TROLOX equivalent (TE)). Interestingly,
the N-acetylated compound 2 showed the highest activity among the compounds tested. Compared to
that of 1 the antioxidant potency of 2 was nearly 6-fold greater. The fully acetylated compound 3 showed
the highest IC50 and compared to 1 and 2 was considered inactive. These findings are consistent with
our previous studies [34,35] and with numerous other reports evidencing the polyphenolic moieties as
mandatory for high antioxidant potency [36–38].
2.11. Antibacterial Activity
The antibacterial activities against Gram-negative Escherichia coli (ATCC 10536), Pseudomonas
aeruginosa (ATCC 6538), and Gram-positive Staphylococcus aureus (ATCC 15442) bacteria were
determined were determined based on a previously reported protocol and expressed as the minimal
inhibitory concentration (MIC) [39–41]. The commercially available antibiotics ampicillin, tetracycline,
kanamycin, and erythromycin were used as the reference standards (Table 6).Int. J. Mol. Sci. 2020, 21, 5735 12 of 18
Table 6. MIC values of thiadiazole derivatives against S. aureus, E. coli, and p. aeruginosa referenced to
commercially used antibiotics.
MIC (µg/mL) (±0.01)
Compound Bacteria
1 2 3 5 7 Ampicillin Tetracycline Erythromycin Kanamycin
Staphylococcus aureus 500 - - 500 500 1.9 0.1 250 3.9
Escherichia coli 1000 - - 1000 1000 31.2 0.5 62.5 7.8
Pseudomonas
- - - - - 62.5 500 250 -
aeruginosa
The MIC values determined for free ligands 1–3 and their corresponding Zn(II) complexes 5
and 7 were in all cases much higher compared to those of the control drugs, pointing at their low
antibacterial potency. The highest activities were observed against S. aureus, where compounds 1,
5, and 7 exhibited the MIC of 0.5 mg/mL. Compared to S. aureus, the E. coli strain was twice much
resistant to the compounds tested, while p. aeruginosa remained unaffected.
Regardless the low antibacterial activity of compounds tested a rough estimation regarding their
structure–activity relationship can be made. In particular, the acetylating of -NH2 and both phenolic
-OH groups notably decreases the antibacterial activity, hence the activity of 1 is much higher compared
to that of 2 and 3. Moreover, it is worth-noticing that the complexation of 1 to Zn(II) ions does not seem
affecting the activity of the corresponding complex 5, while the complexation of inactive compound 2
effects in the activity of corresponding complex 7 being comparable to those of the free ligand 1 and
the complex 5. These aspects however would require much more in-depth study in the future.
Aiming at a more accurate assessment of the antibacterial activity of thiadiazole derivatives, a
checkerboard method [42,43] was applied for the examination of interactions between model thiadiazole
ligand 1, its corresponding Zn(II) complex 5, and the commercial drug kanamycin. More specifically,
both model compounds 1 and 5 demonstrated a strong synergistic interaction with kanamycin resulting
in a notably enhanced activity against S. aureus (Table 7). The MIC value of 0.5 µg/mL determined
for kanamycin combined with relatively inactive compound 1, was 8-fold lower compared to that
of separately tested kanamycin (3.9 µg/mL) and few orders of magnitude lower compared to that of
thiadiazole 1 alone. Interestingly, an identical result was obtained from the mixture of kanamycin with
complex 5, suggesting that the interactions between kanamycin may occur via moieties which are not
involved in the formation of metal complex. It is therefore likely that the amine, resorcynyl para-phenolic
group, and the remaining heteroatoms of the thiadiazole ring may constitute the vehicle for synergistic
action with kanamycin against S. aureus. Previously, the synergistic antifungal interactions were
documented to occur between 1,3,4-thiadiazoles and antifungal agent amphotericin B [12]. In this
context, the results obtained in our current work confirm that the synergism with various antibiotics is
yet another aspect of the biological activity of 1,3,4-thiadiazoles worth investigating.
Table 7. Synergistic effects against S. aureus demonstrated by 1 and 5 upon their combination
with kanamycin.
Compound MIC a (µg/mL) (±0.01) Combination MIC b (µg/mL) (±0.01) FIC c
1 500 125
1/kanamycin 0.375
kanamycin 3.9 0.5
5 500 125
5/kanamycin 0.375
kanamycin 3.9 0.5
a MIC = value determined in an individual compound (1, 5, and kanamycin); b MIC = value determined in a
combination of two compounds (1 or 5 with kanamycin); c FIC = fractional inhibitory concentration [40].
3. Materials and Methods
All chemicals used for the syntheses were of reagent grade or higher.
2,4-dihydroxybenzaldehyde, thiosemicarbazide, acetic anhydride, phosphorous oxychloride, Trolox
(6-Hydroxy-2,5,7,8-tetramethylchromane-2-carboxylic acid), DPPH (2,2-diphenyl-1-picrylhydrazyl),Int. J. Mol. Sci. 2020, 21, 5735 13 of 18
DMSO-d6, and MS grade methanol were purchased from Aldrich (Darmstadt, Germany). Concentrated
HCl and solid NaOH were purchased from ChemPur (Piekary Ślaskie, ˛ Poland). Ethanol, methanol,
acetonitrile, formic acid, Zn(CH3COOH)2, and Cu(CH3COOH)2 were purchased from Avantor (Gliwice,
Poland). All solvents were of 99% purity or higher (HPLC grade).
The NMR spectra, were acquired on a Bruker Avance III spectrometer (500 MHz) (Bruker, Coventry,
UK), using d6-DMSO as solvent. Signal assignments were made using standard techniques including HSQC
and HMBC experiments. The infrared spectra were recorded in the region of 4000 cm−1 to 450 cm−1 on a
Thermo Scientific Nicolet iS5 Fourier-transform infrared spectrophotometer equipped with the iD7 ATR
adapter (Shimadzu, Kyoto, Japan). The electronic absorption and steady-state fluorescence measurements,
antioxidant, and antibacterial assays were performed in 96-well plates on a Tecan Infinite 200 microplate
reader (Tecan Austria GmbH, Grödig/Salzburg, Austria). HPLC-ESI-MS analyses were performed on a
Shimadzu 8030 ESI-Triple Quad mass spectrometer (Shimadzu, Kyoto, Japan). All HPLC-MS analyses
were performed in positive ion mode. The HPLC solvents gradient was 40% B in A at 0 min to 90% B
in A at 15 min (A: 2% v/v formic acid in water; B: methanol). Helium (He) was used as a collision gas
during collision-induced (CID) MS/MS experiments and collision energy (CE) was set at −35 V. The X-ray
data collection for single crystal (T = 120K) was carried out on a SuperNova diffractometer (Oxford
Diffraction, Oxford, UK), with micro-focusing source of CuKα radiation. Indexing, integration, and scaling
was done using CrysAlis RED software [44]. The structure was solved with direct methods and then
successive least-square refinements were carried out, based on the full-matrix least-squares on F2 using the
SHELX program package [45]. All heavy atoms were refined anisotropically. Hydrogen atoms were fitted
isotropically with geometry idealized positions except those forming intermolecular H-bonds. Table S1
includes experimental details for a measured single crystal. Presented structure has been deposited in the
CCDC with no. 1845297. Melting point values were recorded on a Stuart SMP20 apparatus within the range
of 25–300 ◦C, and were uncorrected.
Synthesis of 2-amino-5-(2,4-dihydroksyphenyl)-1,3,4-thiadiazole (1)
2,4-dihydroxybenzoic acid (5.00 g, 32.00 mmol) was suspended in POCl3 (15 mL) and stirred
at room temperature for 20 min. Thiosemicarbazide (2.95 g, 32.00 mmol) was then added and the
reaction mixture was refluxed at 75 ◦ C and stirred for 12 hours. The thick, yellow slurry that formed
was cooled down to 30 ◦ C followed by quenching the excess POCl3 by slow addition of small aliquots
of water. The mixture was then refluxed at 105 ◦ C for 5 h and then it was cooled down to ambient
temperature and the pH was then brought to 8.5 with saturated NaOH. The precipitate formed was
filtered off, washed with water, and allowed to dry in air. The dry solid was washed thoroughly
with methanol and the solution was evaporated to dry under reduced pressure yielding compound 1.
Single crystals suitable for X-ray diffraction were grown in ethanol. Yield: 5.32 g (79%); C8 H7 N3 O2 S
(209.22 g/mol); calc: C 45.93, H 3.37, N 20.08%, found: C 42.96, H 3.30, N 17.84%; M.P.: 252–255 ◦ C;
1 H-NMR (DMSO): δ = 10.91 ppm (s, 1H, H9, (-OH)), 9.84 (s, 1H, H7, (-OH)), 7.53 (d, 1H, H11, J = 8.51
Hz), 7.15 (s, 2H, H12 (-NH2 )), 6.38 (d, 1H, H8, J = 2.28 Hz), 6.36 (dd, 1H, H10, J1 = 8.51, J2 = 2.28 Hz);
13 C-NMR (DMSO): 167.84 ppm (C5), 160.22 (C9), 156.43 (C7), 156.03 (C2), 129.20 (C11), 108.99 (C6),
108.35 (C10), 102.99 (C8); IR (ATR): 3385, 3320, 3206, 2656, 2584, 1628, 1604, 1530, 1514, 1472, 1317, 1268,
1174, 1125,1057, 983, 967, 831, 761, 655, 459 cm−1 ; UV-Vis (MeOH): λ1 = 294, λ2 = 324 nm; Fluorescence
(MeOH): λEm(Ex290) = 380 nm.
Synthesis of 2-acetamido-5-(2,4-dihydroksyphenyl)-1,3,4-thiadiazole (2)
Compound 1 (1.00 g, 4.78 mmol) was refluxed in the mixture of acetic anhydride (10 mL) and
water (4 mL) for 6 hours. The reaction mixture was then cooled to ambient temperature and the solid
was filtered off, washed with water, and dried. The product was recrystallized from ethanol yielding
0.86 g (72%) of 2. Yield: 0.91 g (72%); C10 H9 N3 O3 S (251.26 g/mol); calc: C 47.80, H 3.61, N 16.72%,
found: C 46.34, H 3.41, N 16.21%, M.P.: >300 ◦ C; 1 H-NMR (DMSO): δ = 12,32 (s, 1H, H12 (-NH-)), 10.90Int. J. Mol. Sci. 2020, 21, 5735 14 of 18
(s, 1H, H7(-OH)), 9.92 (s, 1H, H9 (-OH)), 7.91 (d, 1H, H11, J = 8.74 Hz), 6.45 (d, 1H, H8, J = 2.30 Hz),
6.40 (dd, 1H, H10, J1 = 8.74, J2 = 2.30 Hz), 2.18 (s, 3H, H14); 13 C-NMR (DMSO): 168.79 ppm (C2), 160.94
(C9), 158. 89 (C13), 158. 87 (C5), 156.35 (C7), 129.03 (C11), 109.15 (C6), 108.62 (C10), 102.88 (C8), 22.88
(C14); IR (ATR): 3309, 3158, 2885, 2791,1680,1626, 1597,1557, 1527, 1483, 1415, 1310, 1217, 1180, 1129,
974, 841, 804, 709, 681, 659, 623, 518, 467 cm−1 ; UV-Vis (MeOH): λ1 = 292, λ2 = 324 nm; Fluorescence
(MeOH): λEm(Ex290) = 377 nm.
Synthesis of 2-acetamido-5-((phenyl-2,4-diacetate)-yl)-1,3,4-thiadiazole (3)
Compound 1 (0.36 g, 1.70 mmol) was suspended in acetic anhydride (10 mL) and three drops
of concentrated H2 SO4 was added. The mixture was refluxed for 6 h and then cooled to ambient
temperature and the solid was filtered off, washed with water, and allowed to dry in air. The crude
product was recrystallized from ethanol yielding 0.48 g (58%) of 3. Yield: 0.48 g (58%); C14 H13 N3 O5 S
(335.33 g/mol); calc: C 50.15, H 3.91, N 12.53%, found: C 49.02, H 3.66, N 12.50%; M.P.: 269–271 ◦ C;
1 H-NMR (DMSO): δ = 12,68 (s, 1H, H12 (-NH-)), 8.23 (d, 1H, H11, J = 8.56 Hz), 7.29 (d, 1H, H8, J = 2.27
Hz), 7.26 (dd, 1H, H10, J1 = 8.56, J2 = 2.27 Hz), 2.38 (s, 3H, H18), 2.31 (s, 3H, H16), 2.22 (s, 3H, H14);
13 C-NMR (DMSO): 169.33 ppm (C17), 169.24 (C2), 168. 97 (C15), 160.03 (C13), 155.92 (C5), 152.53 (C9),
147.89 (C7), 129.72 (C11), 121.36 (C6), 121.02 (C10), 118.21 (C8), 22.86 (C14), 21.68 (C18), 21.31 (C16);
IR (ATR): 3154, 2899, 2782, 1771, 1695, 1612, 1588, 1563, 1504, 1440, 1336, 1321, 1213, 1185, 1150, 1117,
1105, 1014, 991, 900, 882, 820, 686, 672, 609, 551, 473 cm−1 ; UV-Vis (MeOH): λ1 = 293 nm; Fluorescence
(MeOH): λEm(Ex290) = 361 nm.
Synthesis of Zn(II) and Cu(II) complexes (4–7)
The Zn(II) complexes were synthesized according to the previously reported procedure [21]:
Typically, the free ligand (1.70 mmol) was dissolved in a hot mixture of 30 mL MeOH and H2 O (1:1
v/v) and equimolar amount of Zn(II) acetate monohydrate was added. The mixture was heated under
reflux for 6 h and cooled down to the ambient temperature. A fine solid formed was then collected
with the centrifuge, rinsed with water, and dried. The crude product was recrystallized from methanol.
The syntheses of Cu(II) complexes were carried out in a similar manner, except that Cu(II) acetate
monohydrate (0.85 mmol) was used. The compound 1 was used as a substrate in the synthesis of
complexes 4 and 5, while the compound 2 was applied for the synthesis of 6 and 7.
(4) Yield: 38%; C16 H16 CuN6 O6 S2 (516.01 g/mol); calc: C 37.24, H 3.13, N 16.29, Cu 12.31%, found:
C 26.85, H 2.34, N 10.69, Cu 24.67%; M.P.: >300 ◦ C; IR (ATR): 3447, 3311, 1607, 1553, 1475,1428,1239,1187,
1172, 1128, 1080, 994, 979, 825, 728, 684, 619, 456 cm−1 ; UV-Vis (MeOH): λ1 = 322 nm; Fluorescence
(MeOH): λEm(Ex290) = 380 nm.
(5) Yield: 46%; C10 H13 N3 O6 SZn (368.67 g/mol); calc: C 32.58, H 3.55, N 11.40, Zn 17.73%, found:
C 30.98, H 2.74, N 12.02, Zn 16.93%; M.P.: >300 ◦ C; IR (ATR): 3413, 3233, 1610, 1558, 1477, 1221, 1178,
1128, 1085, 992, 977, 886, 835, 675, 604, 451cm−1 ; UV-Vis (MeOH): λ1 = 294, λ2 = 342 nm; Fluorescence
(MeOH): λEm(Ex290) = 413 nm.
(6) Yield: 41%; C20 H20 CuN6 O8 S2 (600.08 g/mol); calc: C 40.03, H 3.36, N 14.01, Cu 10.59%, found:
C 37.67, H 2.95, N 12.90, Cu 12.04%; M.P.: >300 ◦ C; IR (ATR): 3159, 2910, 2770, 1681, 1598, 1540, 1476,
1413, 1368, 1311, 1219, 1179, 1142, 1130, 976, 833, 798, 760, 706, 682, 625, 603, 551, 517 cm−1 ; UV-Vis
(MeOH): λ1 = 292, λ2 = 322 nm; Fluorescence (MeOH): λEm(Ex290) = 374 nm.
(7) Yield: 42%; C12 H15 N3 O7 SZn (410.71 g/mol); calc: C 35.09, H 3.68, N 10.23, Zn 15.92%, found:
C 37.01, H 3.02, N 11.55, Zn 13.21%; M.P.: >300 ◦ C; IR (ATR): 3033, 2893, 2770, 1681, 1625, 1598, 1559,
1480, 1418, 1371, 1329, 1312, 1220, 1180, 1130, 1043, 991, 975, 842, 804, 758, 681, 631, 519, 468 cm−1 ;
UV-Vis (MeOH): λ1 = 293, λ2 = 328 nm; Fluorescence (MeOH): λEm(Ex290) = 372 nm.Int. J. Mol. Sci. 2020, 21, 5735 15 of 18
3.1. Antioxidant Assay
To a transparent, 96-well plate an increasing concentrations of individual ligands solutions were
added. Next, 40 µL of 1.0 mM DPPH· radicals methanolic solution was applied. The concentration of
each ligand (1–3) was set so that the decrease of absorption intensity of DPPH· radicals solution at λmax
519 nm after 30 minutes of the reaction kept in the dark was in the range of 10–90% of its initial value.
The total volume of all samples was 200 µL. The plate was shaken for 10 s on the reader shaker to
obtain homogeneous solutions and then the absorbance measurement at λmax 519 nm started. All data
were collected for 30 min at 25 ◦ C. The final values were the average of five exposures of the sample to
a beam of light. Each sample was repeated three times in independent experiments.
3.2. Antibacterial Activity Assay
The bacterial strains were incubated in Mueller–Hinton Broth medium at 37 ◦ C over 24 h in aerobic
conditions. The number of cells in the suspension was adjusted to that of 0.5 McFarland standard,
which was an equivalent of 108 colony-forming units (CFU). The antibacterial activities of thiadiazole
ligands and their Zn(II) complexes were determined as minimal inhibitory concentration (MIC) using
broth dilution method. All experiments were performed based on the standard protocol [39,40].
The experiments were carried out in 96-well plate and the thiadiazole derivatives were tested within
the concentration range of 7.9 µg/mL to 1 mg/mL. All experiments were run in triplicate.
Additionally, the possibility of synergistic antibacterial action was assessed with use of the
checkerboard method, in which the compounds 1–3, 5, and 7 were combined with kanamycin and the
mixtures were examined for their activity against S. aureus.
4. Conclusions
In conclusion, a series of 2-amino-5(2,4-hydroxyphenyl)-1,3,4-thiadiazole-derived homologues
were synthesized with use of classical methods and their ability to form metal complexes with Zn(II)
and Cu(II) ions was examined. All compounds were isolated with satisfactory purities and good
yields. The structures of all compounds were confirmed using a number of spectroscopic techniques
including the UV–vis, fluorescence, IR, NMR (1 H, 13 C, HSQC, HMBC), HPLC-MS, AAS, and CHN
analysis. Moreover, the structure of model thiadiazole ligand 1 was examined in detail with use of
single crystal X-ray diffraction technique. The structural features of thiadiazole derivatives isolated
were discussed for their metal binding site and especially for the involvement of the amino group in the
metal complex formation. The results obtained suggested that the metal-binding pocket in thiadiazole
ligands is formed via the neighboring ortho-phenolic group and one of the thiadiazole nitrogen atoms.
The structures of complexes Zn(II) and Cu(II) formed differ in their metal:thiadiazole ratios, which in
Zn(II) complexes is 1:1, while in Cu(II) it is 1:2. Moreover, in Zn(II) complexes, an acetate ion is present
as an additional ligand. Furthermore, all complexes are most likely form hydrates utilizing two water
molecules as additional ligands partaking in the coordination to the central metal. The results obtained
suggest that the metal complex formation does not occur via the -NH2 group present in the ligand
structure. This enables the possibility for relative ease in structural modifications of the thiadiazole
ligands isolated, while keeping the metal binding site unaltered. This structural feature appears
particularly useful once considered in terms of sparing solubility of the complexes.
Low solubility in aqueous media has a negative influence on the antibacterial activity and
manifests in the fact that all thiadiazole derivatives are characteristic of MIC values notably higher
compared to those of commercially used antibiotics. On the other hand, one of derivatives in the
series exhibited a strong synergistic effect with kanamycin against S. aureus species, making the
prospect of further investigation on that field particularly attractive. In this context, an alteration of the
amine moiety towards the products characteristic of an increased aqueous solubility would certainly
enhance the biological activity of both free ligands and their metal complexes. Such modifications are
undoubtedly necessary, especially in terms of potential applicability of thiadiazole ligands as novelYou can also read