ENHANCED PHOTOCATALYTIC AND PHOTODYNAMIC ACTIVITY OF CHITOSAN AND GARLIC LOADED CDO-TIO2 HYBRID BIONANOMATERIALS - NATURE
←
→
Page content transcription
If your browser does not render page correctly, please read the page content below
www.nature.com/scientificreports
OPEN Enhanced photocatalytic
and photodynamic activity
of chitosan and garlic loaded
CdO–TiO2 hybrid bionanomaterials
K. I. Dhanalekshmi1, P. Magesan2*, M. J. Umapathy3, Xiang Zhang1, N. Srinivasan4 &
K. Jayamoorthy5
Herein, the work addresses the synthesis of biomaterials (chitosan and garlic) loaded CdO–TiO2
hybrid nanocomposites for photocatalytic water treatment and photodynamic cancer therapeutic
applications that were reported the first time. CdO–TiO2 (CT) nanocomposites were synthesized and
loaded with the biomaterials such as chitosan and garlic by simple sol–gel method. The nanomaterials
were characterized and the photodegradation of three model pollutants, Methylene blue (MB), Methyl
orange (MO) and Rhodamine B (Rh-B) was opted to investigate the efficiency of the synthesized
photocatalyst under the solar light. From the results, the garlic-loaded CdO–TiO2 (AS-CT) hybrid
nanocomposites exhibit a superior photocatalytic activity than the chitosan-loaded CdO–TiO2
(CS-CT) and CdO–TiO2 (CT) nanocomposites under the irradiation of solar light. Additionally, the
cell viability of the synthesized nanocomposites was carried out in HeLa cell lines under different
concentrations, light doses and incubation periods using an LED light source. Compared to the
CS-CT and CT nanocomposites, an efficient photodynamic activity was achieved in the case of AS-CT
hybrid nanocomposites. Actually, the end-use properties required for both processes in AS-CT
nanocomposites appear similar due to the presence of organo sulphurus compounds.
Nanotechnology has been supporting considerably for the development, even revolutionize various industries
and technologies: transportation, medicine, food safety, energy, and environment, etc. It also been a boon in
the field of environmental and medicine for over a decade. Photocatalysis based on nanomaterials is one of the
most promising methods for environmental remediation. In this method, depending on the energy band gap, the
nanomaterials are induced by different wavelengths of UV, visible, and NIR light1. The activated nanomaterials
degrade the various chemical and microbiological pollutants in water by a photocatalytic redox mechanism.
In the domain of medicine, nanomaterials have an excellent potential for the treatment and diagnosis of can-
cer. Photodynamic Therapy (PDT) is a budding modality for cancer treatment favoring the interaction between
photosensitizers (PS) and light to initiate cell death2. In PDT, the light activates the PS, not directly reacting
with cells, but it transfers the triplet state energy to adjacent oxygen to generate a reactive singlet oxygen species
that lead to the cytotoxic r eactions3,4. Currently, many studies have addressed the feasibility of semiconductor
nanoparticles (NPs), such as T iO25,6, CdS7,8, Fe2O39–11, ZnO,12–14 etc. in photocatalysis and PDT.
Semiconductor metal oxides offer an extensive interest owing to their vast potential applications. On this
account, semiconductor NPs became extensively used in photocatalysis and cancer diagnosis. Among all the
semiconductor oxides, Titanium dioxide (TiO2) has gained much interest in the environment and medicine.
One of the applications of T iO2 semiconductor photocatalysts is the photokilling behaviour by the photoexcited
TiO2 that could be applied in the biomedical field, particularly in cancer t reatment15. During photocatalysis,
the generation of holes and electrons have redox properties that cause various photocatalytic reactions16,17. In
PDT, the presence of oxygen in the human body reacts with conduction band electrons of TiO2 generates reac-
tive oxygen species (ROS), which damages the cancerous cell’s structure. The photokilling behaviour of T iO2 is
1
School of Mechanical Engineering, Beijing Institute of Technology, Beijing 100 081, China. 2Department
of Chemistry, Bharath Institute of Higher Education and Research, Bharath University, Chennai 600 073,
Tamilnadu, India. 3Department of Chemistry, College of Engineering Guindy, Anna University, Chennai 600 025,
Tamilnadu, India. 4Department of Chemistry, Pachiyappa’s College for Men, Kanchipuram 631 501, Tamilnadu,
India. 5Department of Chemistry, St. Joseph’s College of Engineering, Chennai 600 119, Tamilnadu, India. *email:
magesh.ambi@gmail.com
Scientific Reports | (2021) 11:20790 | https://doi.org/10.1038/s41598-021-00242-5 1
Vol.:(0123456789)
www.nature.com/scientificreports/
Scheme 1. Illustration of the aim of the work.
feasible to use in PDT as a PS. However, T iO2 lacks its efficacy because of the low quantum yield and high band
gap. Moreover, T iO2 has the disadvantage of being active only under the UV light region, which could decrease
the photocatalytic activity and also, UV light could not penetrate deeply into the biological tissues. To overcome
these difficulties, certain metal oxides are doped to reduce the band gap, thereby enhancing the photocatalytic
and photodynamic a ctivity18.
Dopants are metal oxides/metal ions that are added in small quantities (< 10%). Among the various toxic
semiconductor NPs, Cadmium Oxide (CdO) is of the lowest t oxicity19,20. Hence, CdO is considered a chemi-
cally compatible nanomaterial with the human body21,22. A heavy metal such as cadmium could eradicate tumor
cells in the body even at low concentrations23–25. From this perspective, the therapy based on CdO NPs has been
developed for nano-based treatments. The characteristics of T iO2 were strongly improved by doping with CdO.
CdO, an n-type semiconductor with a band gap (2.18 eV) and a melting point of 1500 °C26. Dhatshanamurthi
and his research team synthesized CdO loaded T iO2 and used it as a photocatalyst for degrading orange-4 dye.
CdO–TiO2 possesses excellent photocatalytic activity than bare T iO2 under UV-A light27. In addition to the
photocatalytic activity, first-principle calculations were used to determine the magnetic behaviour of Cd-doped
TiO2 and found that potent ferromagnetism could be achieved by Cd doping with T iO2 in the concentration of
12.5%28. CdO nanomaterials are extensively involved in biomedical applications such as drug delivery, eradicating
cancer cells and improving cancer cells’ sensitivity for imaging and accurate observance29–32. Additionally, very
few studies have been devoted to CdO doped T iO2 nanocomposites-based PDT for cancer treatment.
In the present scenario, biomaterials-based hybrid nanomaterials have acquired more interest in environ-
mental and biomedical applications. The hybrid nanomaterials based on chitosan and garlic has been developed
for various applications. Chitosan (CS), a chitin derivative and the most abundant natural polymer, otherwise
called poly (1,4), b-D g lucopyranosamine33,34. Recently, several research findings have been reported based on CS
biopolymer35–37 and the results show that the production of new inorganic/organic nanomaterials with effective
photocatalytic behaviour due to the immobilization of semiconductors onto CS. CS increases the dissolution rate
of drugs with less solubility, targeting of drug and improves the drug a bsorption38. Due to its exceptional proper-
ties it also been applied in various biological applications such as analgesic, antimicrobial, hypocholesterolemic,
hemostatic, and antioxidant a ctivity39–41. The PDT associated with nanocarriers of CS are considered as one of the
mechanisms for cancer treatment. This approach increases the PS’s specificity for targeting tumors, the solubility
of photosensitive molecules and decreasing c ytotoxicity42,43. Garlic (Allium Sativum)(AS), an herb that contains
around 17 amino acids, 33 sulphurus compounds, and certain enzymes such as alliinase, peroxidases, myrosi-
nase etc44. The loading of garlic with T iO2 and WO3–TiO2 hybrid photocatalytic materials notably enhanced
the photocatalytic effect in the range of visible light45,46. Very few works reported that TiO2 NPs with optimized
garlic loading possess outstanding activity against cancer and microbial than the bare TiO2 NPs. Indeed, the
low price and the ease of synthesis constitute significant advantages of this material over the inorganic oxides.
To this aim, CdO doped T iO2 (CT), chitosan-loaded CdO doped T iO2 (CS-CT), and garlic-loaded CdO doped
TiO2 (AS-CT) have been successfully synthesized. The photocatalytic activity of synthesized nanocomposites
has been investigated against organic pollutants such as MB, MO and Rh-B under solar light. Additionally, the
photodynamic activity of these materials has been investigated in the HeLa cell lines under the irradiation of an
LED light source. Scheme 1 illustrates the objective of the work and application of synthesized bionanomaterials
Scientific Reports | (2021) 11:20790 | https://doi.org/10.1038/s41598-021-00242-5 2
Vol:.(1234567890)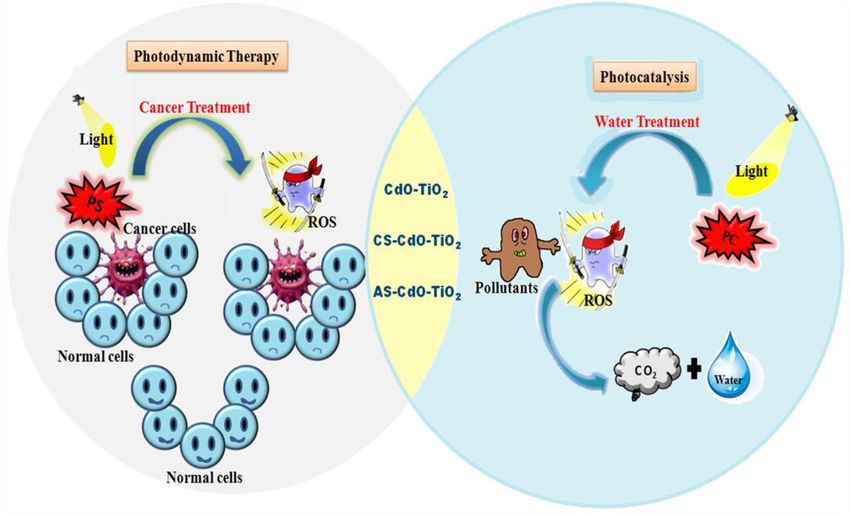
www.nature.com/scientificreports/
Figure 1. XRD of (a) CT (b) CS-CT and (c) AS-CT nanocomposites.
towards photocatalysis and PDT. Nonetheless, no previous attempts have been made to develop CS-CT and
AS-CT hybrid NPs for photocatalytic and photodynamic activity.
Result and discussion
Characterization. The XRD patterns of CT, CS-CT, and AS-CT nanocomposites were displayed in Fig. 1a–
c. The peaks give information about anatase TiO2 and cubic face-centered CdO. At angle 2θ, intense peaks
appear at 25.356°, 37.847°, 48.145°, 53.974°, 55.186°, 62.242°, 68.879° and 70.110° corresponding to the (101),
(004), (200), (105), (211), (213), (116) and (220) planes have the best fit according to the standard JCPDS card
No. 89–4921. The presence of peak at 2θ = 45.211° (Fig. 1a) corresponding to cubic CdO (05–0640) and param-
eters are: Cubic, face-centered, a = 4.689 Å, b = 4.689 Å and c = 4.689 Å, α = 90°, β = 90°, γ = 90°. The average crys-
tallite size for CT, CS-CT, and AS-CT hybrid nanocomposites are 15, 11, and 8 nm, respectively. The sharp peak
present in the XRD pattern indicates a highly crystalline structure and absence of impurity.
The effect of the catalyst relies on the morphological behaviour of the sample. The surface morphology of
the synthesized nanocomposites was determined from FE-SEM analysis. The micrographs of CT, CS-CT and
AS-CT hybrid nanocomposites were displayed in Fig. 2a–c. Compared with FE-SEM images of CT, the images
of CS-CT and AS-CT (Fig. 2b,c) displays that the NPs are uniform and spherical in shape. The results highlight
that the NPs appear spherically shaped with some irregularities. The particle size varies from 16 to 45 nm with
an average crystal size of 8–15 nm.
The TEM image of nanocomposites was presented in Fig. 3a–c. The present TEM images were undoubtedly
exposed to FE-SEM reflection. Transmission electron microscope (TEM) images in Fig. 3a–c give close view
of nanocomposites; there is no significant difference in the morphologies, which is almost spherical in shapes.
However, there is a slight difference in particle size for all three synthesized nanomaterials but fall within the
range of 16–45. This is about twice to thrice that of the average crystal size obtained from XRD and the nano-
composites are polycrystalline in nature. This result indicates that different sizes of nanocomposites might be
obtained by using biomaterials.
The elemental composition was detected by using the EDX technique. Figure 4a–c displays the EDX analysis
of CT, CS-CT, and AS-CT nanocomposites. The results proved the existence of all the elements including, Ti,
O, and Cd from T iO2 and CdO, in the synthesized nanocomposites. Similarly, presence of N and S along with
Ti, O and Cd in CS-CT and AS-CT nanocomposites confirms the existence of chitosan and garlic in the biona-
nomaterials. In addition, the presence of O is associated with the oxygen in TiO2 lattice as well as in the surface
–OH groups, and the Ti and O values are not even with the actual elemental composition of TiO2. The absolute
amount of the elements present in the materials was not determined by using the EDX analysis, but the presence
of specific elements can be d etermined47,48.
The visible light activity and the band gap of the synthesized CT, CS-CT, and AS-CT nanocomposites were
studied by using UV-DRS. As shown in Fig. 5a–c, the light absorption characteristics of CT were also modified by
loading of biomaterials. Figure 5a–c indicate that loading of biomaterial with CT nanocomposites had increased
the absorbance from UV to the visible-light region, improving the photocatalytic and photodynamic behaviour
of the nanocomposites. DRS of CdO-TiO2 and garlic-loaded CdO–TiO2 nanocomposites show absorption in
the visible region of 500–600 nm. Chitosan-loaded CdO–TiO2 nanocomposites show absorption in the UV
region. In the case of garlic-loaded CdO–TiO2 calcined at 450 and 700 °C, the absorption edge was observed in
the visible region of the solar spectrum, that represents the catalyst excitation efficiently exploits more photons.
Scientific Reports | (2021) 11:20790 | https://doi.org/10.1038/s41598-021-00242-5 3
Vol.:(0123456789)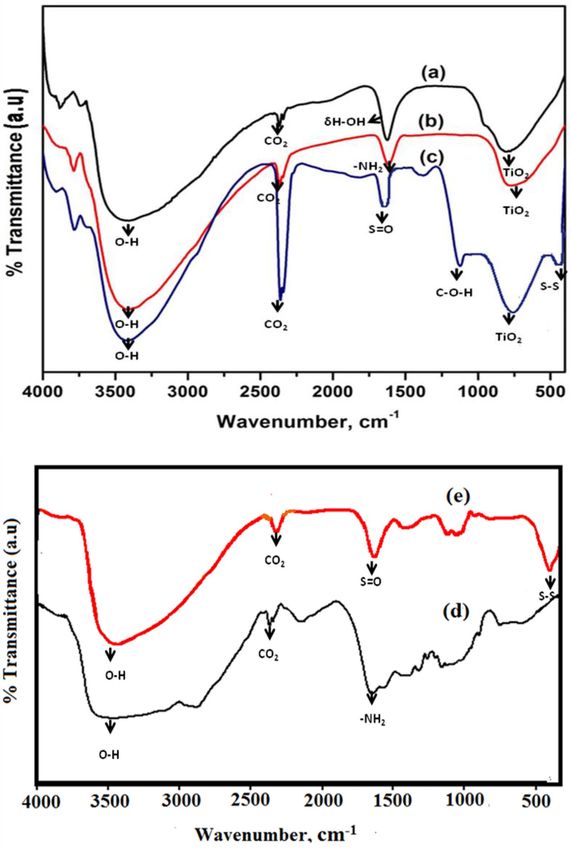
www.nature.com/scientificreports/
Figure 2. FE-SEM picture of (a) CT (b) CS-CT (c) AS-CT nanocomposites.
This kind of absorption explained the substitution of titanium lattice by S 6+, a newly isolated band formed above
the valence band of TiO2 VB and the band gap narrowed consequently49. Furthermore, the results suggest that
loading significantly promotes the band gap to red-shift, which eases the electron excitation from the VB to the
CB that results in higher photocatalytic and photodynamic activity.
In the interest of predicting the type of band-to-band transitions in the synthesized nanocomposites, the
absorbance data of the DRS was plotted into the direct band gap transitions e quation50. Figure 6a–c gives [F(R)
hν]2 Vs. photon energy plot for direct transitions. From the recorded reflectance (R), the F(R) data were deduced
by Kubelka–Munk algorithm application [F(R) = (1–R2)/2R]. F(R) depicts the sample’s absorptivity at a specific
wavelength. From the modified Kubelka–Munk algorithm plot, the corresponding wavelengths (λg) and the
absorption edges (Eg) of the nanocomposites were determined.
The interaction in metal oxides and biomaterials doped TiO2 NPs was studied using FT-IR. The FT-IR analy-
sis of the CT, CS-CT, AS-CT nanocomposites, chitosan and garlic extract were displayed in Fig. 7a–e. From
the observance of Fig. 7a, a broad and strong transmittance band at 3400 cm−1 which is attributed to the O–H
stretching vibration of TiO2 NPs. The peak at 2300 cm−1 corresponds to atmospheric CO2 vibrations, and a peak
at 1630 cm−1 represents water deformation (δH-OH). A band in the range of 650 and 800 cm−1 corresponds to
TiO2 different vibrational modes. In CS-CT hybrid nanocomposites (Fig. 7b) show a peak around 3400 cm−1
and 1630 cm−1 that indicates hydroxyl (–OH) and amine (–NH2) groups which behave as reactive and coor-
dination sites for the organic species adsorption. A band at 700 cm−1 and 2300 cm−1 attributes TiO2 and the
atmospheric CO2 vibrations. The presence of amide or amine and OH groups along with metal oxides favoring
the confirmation of the efficient dye removal by adapting the process of photodegradation-adsorption51. AS-CT
hybrid nanocomposites (Fig. 7c) display a band around 3400 cm−1 indicating OH groups stretching vibra-
tions. The observance of a band at around 460 cm−1 corresponds to the S–S stretching of sulphur and a band at
1130 cm−1 is attributed to the C–O–H bending vibration of the carboxylic (–C = O) identified in compounds
of garlic extract. The other peak observed is 1630 cm−1 indicates the C = C stretching exhibits strong stretching
vibration and matches the earlier reports. A minor shift in the band at 1636 cm−1 for garlic-loaded CdO-TiO2
corresponds to S = O. A band at 633 cm−1 corresponds to strong T iO2 stretching vibration that indicates O–-Ti–O;
Scientific Reports | (2021) 11:20790 | https://doi.org/10.1038/s41598-021-00242-5 4
Vol:.(1234567890)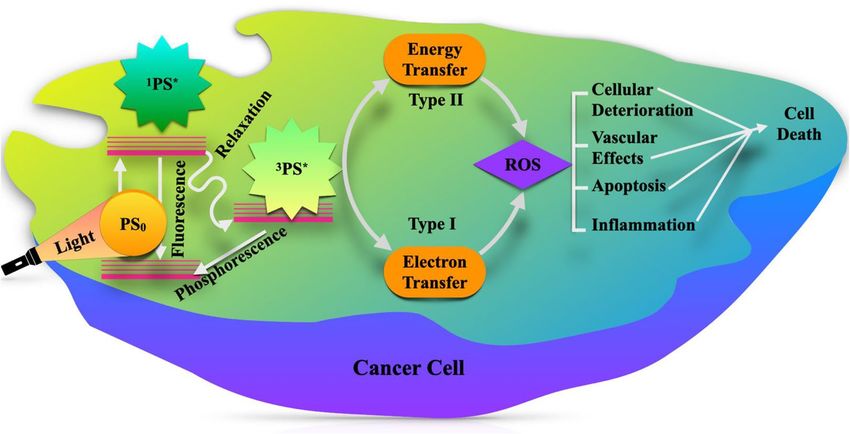
www.nature.com/scientificreports/
Figure 3. TEM picture of (a) CT (b) CS-CT and (c) AS-CT nanocomposites.
the broadening of the peak occurs when loaded with garlic. For comparison, the FT-IR spectra of chitosan and
garlic also displayed in the Fig. 7d,e. The presence of a peak at 1630 cm−1 corresponds to amine (–NH2) groups
in chitosan and the observance of a peak at 1636 cm−1 corresponds to S = O functional groups in garlic along
with the other peaks supports and matches with the synthesized bionanomaterials.
Figure 8a–e gives the TG–DTA studies of the nanocomposites. From TG–DTA, the thermal behaviour of the
nanomaterials was determined in the range of 50 and 800 °C at nitrogen atmosphere. The thermogram of CT
nanocomposite (Fig. 8a) gives weight loss around 345 °C that represents the decomposition of the residual –OH
groups. After that, there was no observance of peak since the compound remained intact. DTA graph shows a
convexity appearance centered at 375 °C indicating the residual –OH decomposition. The thermo-gravimetric
analysis of CS-CT (Fig. 8b) shows weight loss with two decompositions. The first weight loss that occurred at
115 °C is owing to the degradation of the chitosan polymer chain and the second weight loss at 354 °C is because
of the crystallization of T
iO2. The DTA of CS-CT nanocomposite reveals two prominent peaks. The first peak at
118 °C indicates the degradation of the chitosan polymer chain. The second peak at 354 °C may be correspond-
ing to the template removal and T iO2 crystallization. Thermogravimetric analysis of AS-CT nanocomposite
(Fig. 8c) shows two-weight losses with two decomposition steps. The weight loss below 300 °C is attributed to
the decomposition of the residual –OH groups and the second weight loss at 620 °C is due to the phase trans-
formation of T iO2. In DTA of AS-CT shows two convex appearances centered at 300 °C and 610 °C. The first
exothermic peak is due to the removal of the residual OH group and the second weight loss is attributed to the
phase transformation of T iO2. The TG–DTA of chitosan and garlic also displayed in the Fig. 8d,e, respectively.
The TGA of chitosan shows two weight losses at 340 °C and 400 °C, first stage of weight loss was due to decom-
position of the residual OH groups and the second stage of weight loss was attributed to the degradation of the
polymer chain. In TGA of garlic extract, the major weight loss was observed at 400 °C that represents the main
loss of natural extract. The noteworthy characteristic is that almost similar trends in mass losses were obtained
up to 800 °C for all three synthesized nanocomposites.
Photocatalytic activity. Figure 9a–c displays the photocatalytic behaviour of T
iO2, CT, CS-CT, and AS-CT
nanocomposites under solar light have been analyzed using Rh-B, MB, and MO. Compared to other dyes (MB
and MO), the degradation studies of Rh-B under the solar light irradiation show better activity for the synthe-
Scientific Reports | (2021) 11:20790 | https://doi.org/10.1038/s41598-021-00242-5 5
Vol.:(0123456789)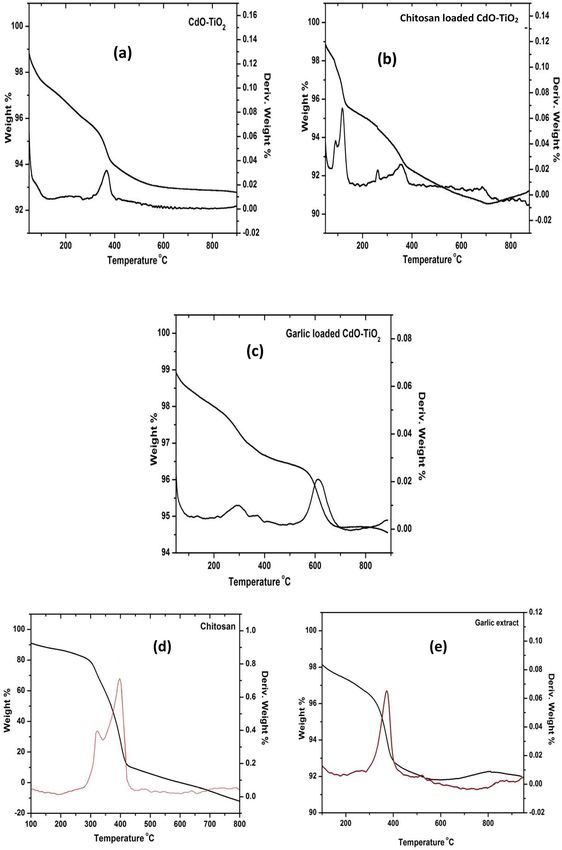
www.nature.com/scientificreports/
Figure 4. EDX of (a) CT (b) CS-CT and (c) AS-CT nanocomposites.
sized nanocomposites AS-CT, CS-CT, and CT but frail for T
iO2. The degradation order of Rh-B, MB and MO by
the nanocomposites is AS-CT > CS-CT > CT > TiO2.
Scientific Reports | (2021) 11:20790 | https://doi.org/10.1038/s41598-021-00242-5 6
Vol:.(1234567890)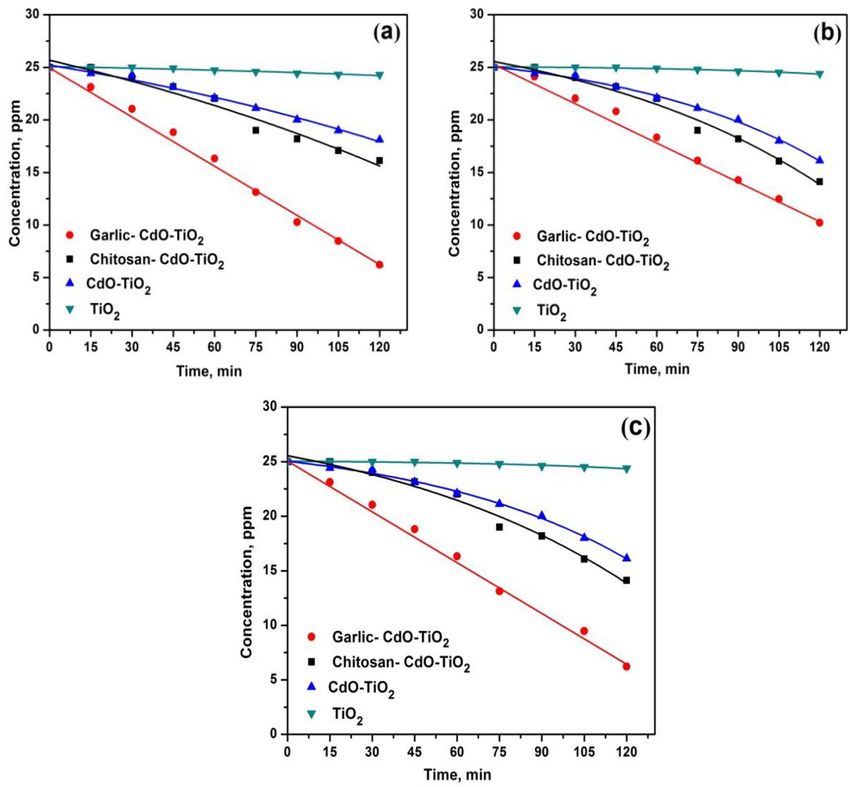
www.nature.com/scientificreports/
Figure 5. DRS of (a) CT (b) CS-CT and (c) AS-CT nanocomposites.
The exhibited higher photocatalytic efficacy of AS-CT nanocomposite may be due to organic sulphurous
compounds that possess a superior property of d egradation46.
The second higher photocatalytic degradation of the dyes by CS-CT catalyst because of the anionic dye
adsorption increased by a positively charged chitosan matrix surface. The amine groups present in the chitosan-
based nanomaterials undergo protonation (formation of protonated amine), which could adsorb the dye mol-
ecules using various types of interaction mechanisms like chelation, electrostatic attraction, etc. It could have a
higher adsorbent capacity to remove pollutants from the wastewater. It produces high active sites for complex
formation with the attracted molecules, result in enhancement of the solar light photocatalytic e fficiency52.
The CT catalyst also shows some favourable activity but not comparable with CS-CT and AS-CT nanocom-
posites. The significant photocatalytic effect of CT nanocomposite may be due to the dye-sensitized reaction.
However, the catalytic deterioration of the dyes by TiO2 NPs is sluggish and there are no remarkable changes
that could modify the degradation process.
The reason for enhanced photocatalytic activity of the biomaterials based hybrid nanomaterials is owing to
(i) the high crystallization degree of doped/loaded anatase and stability that feeble the transfer of electron and
subsequent reduction in the recombination of photo-generated holes, and/or (ii) the increase of vacancies of
oxygen result in the doping or deformity lattice defects that attract the photoinduced electrons thereby suppress
the e− − h+ recombination53–55. Generally, the doped materials may deform the lattice of T iO2 and the substitu-
tion possible either T i4+ or O
2−. Thus, h
+ in the valence band trapped by O H− or the H2O adsorption produces
the radical on the catalyst surface, whereas the photo-generated e − in the conduction band reduces the adsorbed
oxygen into ˙O2 that enhances the catalytic activity56. In addition to that, the hole itself achieves the oxidation of
the target pollutants effectively, which is adsorbed over the catalyst surface57.
The degradation behavior of the pollutants (Rh-B, MB, and MO) improved over the surface of the catalyst58
by the synergistic effect of generated radicals and holes but not processing in the bulk solution; the reason is the
lifetime of the photo-generated radicals was short and inclined to the recombination59. Additionally, the occur-
rence of the enhancement of the dye degradation in the liquid phase has been made by the adding dopants of
the slightly distorted lattice and presence of anatase phase with a high degree of crystallinity60,61.
Scientific Reports | (2021) 11:20790 | https://doi.org/10.1038/s41598-021-00242-5 7
Vol.:(0123456789)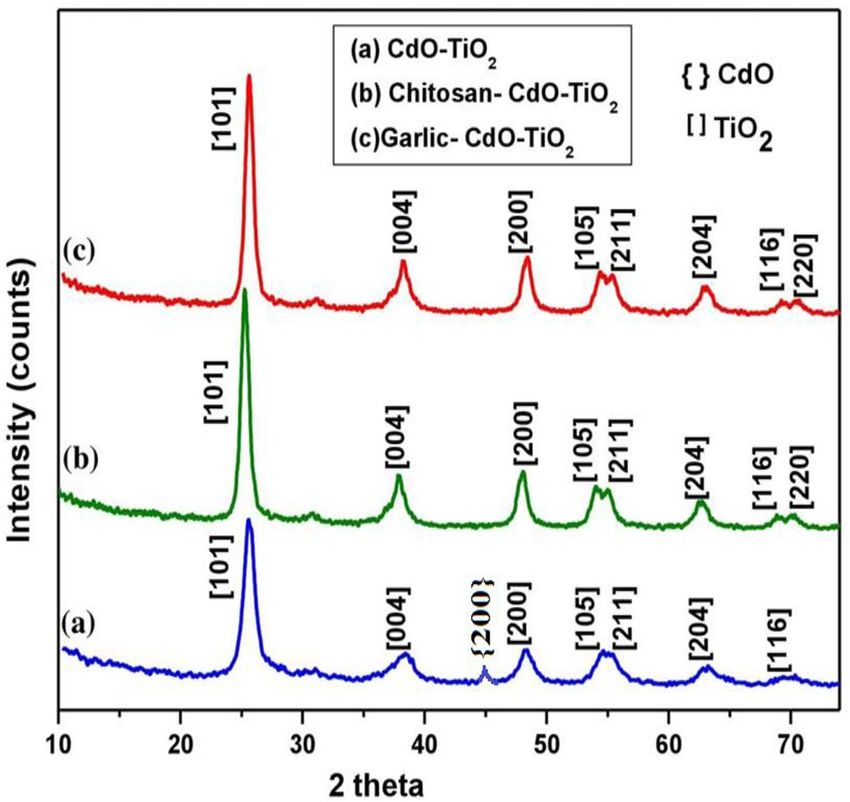
www.nature.com/scientificreports/
Figure 6. Direct band gap of the (a) CT (b) CS-CT and (c) AS-CT nanocomposites.
Recyclability and reusability. The recyclability experiment was also carried out for the synthesized
photocatalysts (Fig. 10). After each experiment, the photocatalysts were isolated from the reaction mixture,
washed thrice by using absolute alcohol, oven-dried at 80 °C. The photocatalysts exhibit favorable reusability
after 3 times of recycling. There was an observance of some extent of loss in catalytic activity after each reporting
period. The fall in the photocatalytic activity/rate of photodegradation may be the result of loss in the amount of
catalyst during the catalyst collection or weakening of the photocatalyst absorbing capacity.
Cell viability. Figure 11, 12 and 13 display the difference in cell viability with various concentrations of
nanocomposites and light doses. The plausible mechanism of PDT is provided in Fig. 14. The cell viability stud-
ies clearly explain the significant contribution of CT, CS-CT, and AS-CT nanocomposites on the Hela cells and
found to be both light dose, concentration as well as time-dependent. 100% indicates the presence of living cells
in the control dish without nanocomposites. The cell viability rate decreases with the increasing concentration
of nanocomposites and light dose.
The CT nanocomposites had no significant impact on the HeLa cells with increasing concentration, light dose
and also incubation time (Fig. 11a–d). Considering the CS-CT effect (Fig. 12a–d), LC50 was found to be 184,
174, 171 and 167 µg/ml at the light dose 53.65, 71.54, 89.43 and 107.31 J/cm2 respectively after 24 h of incuba-
tion (Fig. 12d). Also, the clear observation reveals that further increase in the concentration of the dose above
the LC50 level also had produced 60% of cell death at the different tested light doses except for the lowest dose at
36.77 J/cm2. Hence this is highly significant in considering the individual effect of CS-CT.
Figure 13a–d shows cell viability of AS-CT nanocomposite on the Hela cells. Remarkably, AS-CT had shown
increased anticancer activity when compared to the CS-CT. L C50 was found to be 189, 175, 159, 149 and 124 µg/
ml for 53.65, 71.54, 89.43, 107.31 J/cm2 respectively for the AS-CT after 24 h of incubation (Fig. 13d). At the
increased intensity of light dose tested at 89.43, 107.31 J/cm2, the concentration of anticancer activity slightly
decreased to 159, 149 µg/ml for the AS-CT nanocomposite when compared to CS-CT nanocomposite, which
was at 171 and 167 µg/ml, respectively. After 24 h of incubation, AS-CT nanocomposite shows a remarkable
decrease in cell viability concerning the light dose and it was found to be 75% of cancer cells died for 107.31 J/
cm2 of light dose at 200 µg/ml. It justifies that the garlic loading improve the anticancer effects by inhibiting Hela
cells’ growth. The efficiency of cell viability was progressively reduced with extending the incubation time. The
times of incubation were optimized in order to confirm the time required for the maximum amount of cellular
Scientific Reports | (2021) 11:20790 | https://doi.org/10.1038/s41598-021-00242-5 8
Vol:.(1234567890)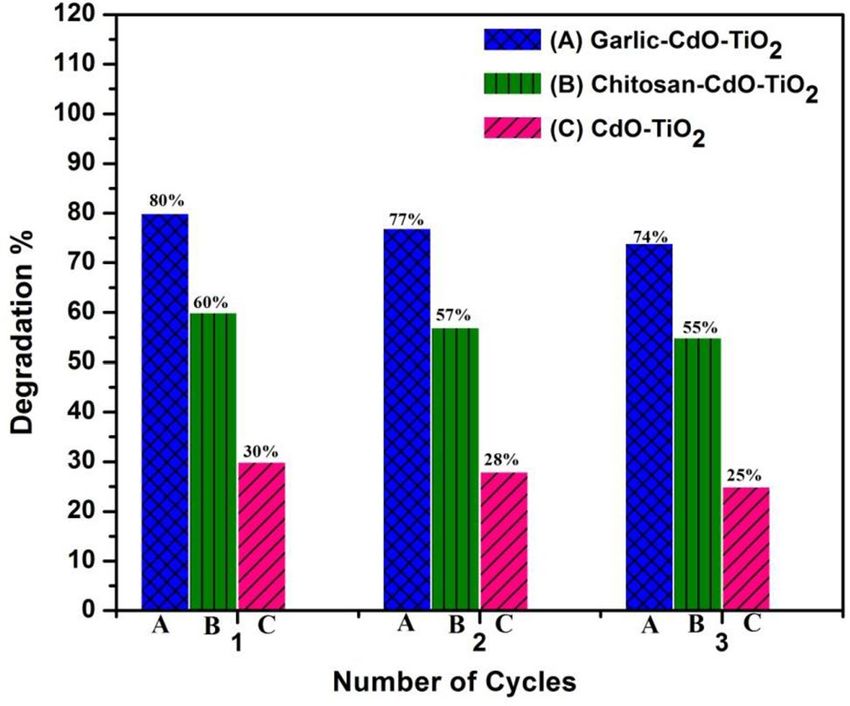
www.nature.com/scientificreports/

                                  Figure 7.  FT-IR of (a) CT (b) CS-CT (c) AS-CT nanocomposites (d) chitosan and (e) garlic.

                                  uptake by HeLa cells. The nanocomposites exhibit negligible dark cytotoxicity and significant light-triggered
                                  cytotoxicity. Meanwhile, the loading of garlic and chitosan on the surfaces of CdO-TiO2 nanocomposites facili-
                                  tates the generation of ROS, enhancing the biological activity.

                                  Conclusions
                                  Nowadays, biomaterials loaded with hybrid nanocomposites have been considered one of the foremost prevalent
                                  materials with potential applications in the environment and medicine. In this context, CT, CS-CT, and AS-CT
                                  hybrid nanocomposites were developed by simple sol–gel method. The structural, morphological and thermal
                                  properties of the nanocomposites were investigated through UV-DRS, XRD, HR-TEM, EDX, FE-SEM, TG–DTA
                                  and FT-IR analysis. The photocatalytic activity was evaluated by the degradation of Rh-B, MB and MO model
                                  pollutants under the solar light illumination. The AS-CT has an excellent photocatalytic activity towards the
                                  degradation of the pollutants over the CT, CS-CT nanocomposites.

Scientific Reports |   (2021) 11:20790 |              https://doi.org/10.1038/s41598-021-00242-5                                              9

                                                                                                                                         Vol.:(0123456789)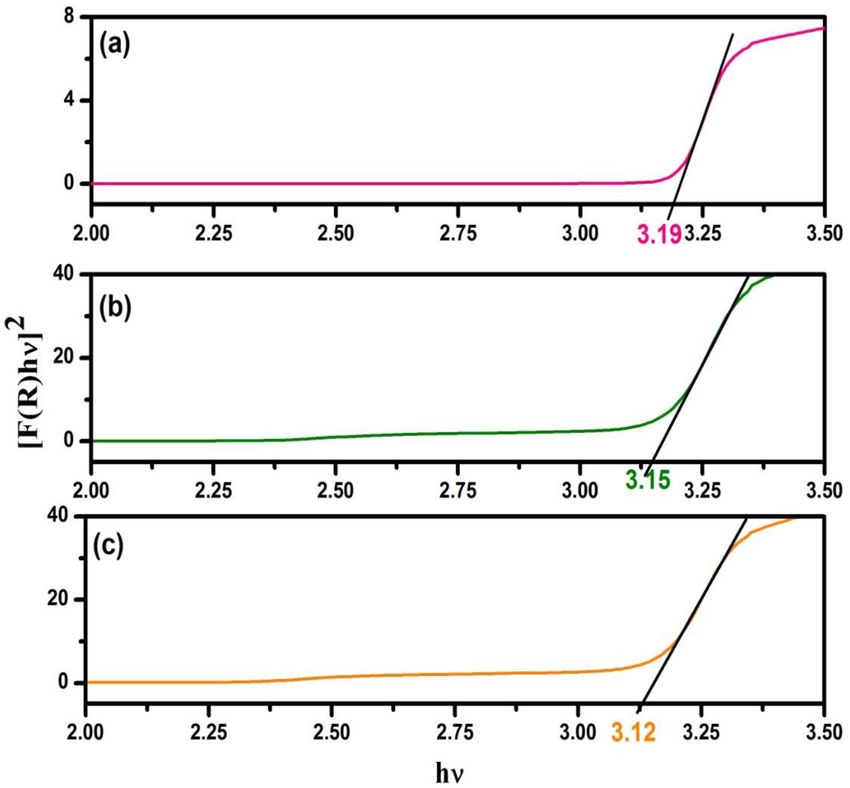
www.nature.com/scientificreports/

                                            Figure 8.  TG–DTA of (a) CT (b) CS-CT (c) AS-CT nanocomposites (d) Chitosan and (e) garlic.

          Scientific Reports |   (2021) 11:20790 |             https://doi.org/10.1038/s41598-021-00242-5                                 10

Vol:.(1234567890)
www.nature.com/scientificreports/
Figure 9. Solar light photodegradation profiles of the dyes (a) Rh-B (b) MB and (c) MO.
Figure 10. Recyclability of the synthesized nanocomposites.
Scientific Reports | (2021) 11:20790 | https://doi.org/10.1038/s41598-021-00242-5 11
Vol.:(0123456789)www.nature.com/scientificreports/
101
101 (a) (b)
100
100
99
99
98
98
97
% of Cell viability
97
% of Cell viability
96
96
95 35.77 J/cm2
95 35.77 J/cm2
53.65 J/cm2
53.65 J/cm2
94 94 71.54 J/cm2
71.54 J/cm2
89.43 J/cm2
89.43 J/cm2 93
93 107.31 J/cm2
107.31 J/cm2
92 92
91 91
90 90
0 50 100 150 200 0 50 100 150 200
Concentration (µg/ml )
Concentration (µg/ml )
35.77 J/cm2 105
102 (c) 53.65 J/cm2 (d)
71.54 J/cm2 35.77 J/cm2
100
89.43 J/cm2 53.65 J/cm2
100
107.31 J/cm2 71.54 J/cm2
95 89.43 J/cm2
98
107.31 J/cm2
% of Cell viability
90
96
% of Cell viability
94 85
92 80
90 75
88 70
86
65
84
0 50 100 150 200 0 50 100 150 200
Concentration (µg/ml )
Concentration (µg/ml )
Figure 11. Cell viability of CT nanocomposites on HeLa cells after (a) 8 h, (b) 12 h, (c) 16 h and (d) 24 h of
incubation.
Moreover, in vitro experiments on the HeLa cell line were performed to assess the PDT efficacy of those NPs
under an LED light source and it demonstrated the efficient photodynamic activity of AS-CT than the CT and
CS-CT nanocomposites. In both cases, the development of biomaterial-loaded NPs is devoted to enhancing
photocatalytic and photodynamic efficiency. In particular, extending the activity towards the visible light domain
and could enhance the generation of ROS. Most notably in AS-CT nanocomposites display better efficiency owing
to the presence of organo sulphurus compounds. The synthesized nanocomposites exhibit low toxicity, high sta-
bility and good biocompatibility in vitro and in vivo. The information thus assembled could help to design new
biomaterial-based nanocomposites specifically for photocatalytic and photodynamic applications in the future.
Experimental section
Materials. Cadmium Oxide (CdO), Titanium Tetra IsoPropoxide (TTIP), Tween-80, Ethanol and Isopropyl
alcohol (IPA) were procured from Merck. Crab shells (Chitin) were purchased at Seafood Market, Kasimedu,
Chennai, India. Methyl orange, Methylene blue, and Rhodamine B were supplied by S.D. Fine Chemicals, India.
Synthesis of CdO‑TiO2 (CT). A suspension of 0.038 g of CdO and 20 mL of distilled ethanol was allowed
to stir for 1 h for a homogeneous suspension. To the homogenous solution, 3 ml of tween-80 was added drop-
wise and continued stirring for another 30 min. Followed by 3 mL of TTIP with 10 mL IPA was added drop-wise
to the above mixture and allowed to stir for 2 h for obtaining gel. The gel obtained was separated and washed
completely by using 1:1 aqueous ethanol and dried for 6 h at 120 ºC. The resultant material was calcined at 500
ºC for 3 h.
Scientific Reports | (2021) 11:20790 | https://doi.org/10.1038/s41598-021-00242-5 12
Vol:.(1234567890)www.nature.com/scientificreports/
105 102
35.77 J/cm2
(a) 35.77 J/cm2 (b) 53.65 J/cm2
53.65 J/cm2 100
71.54 J/cm2
71.54 J/cm2
98 89.43 J/cm2
89.43 J/cm2
107.31 J/cm2
100 107.31 J/cm2
96
% of Cell viability
% of Cell viability
94
92
95
90
88
90 86
84
0 50 100 150 200 0 50 100 150 200
Concentration (µg/ml) Concentration (µg/ml)
105 110
35.77 J/cm2
(c) 53.65 J/cm2 35.77 J/cm2
100
71.54 J/cm2 100 (d) 53.65 J/cm2
89.43 J/cm2 71.54 J/cm2
95
107.31 J/cm2 90 89.43 J/cm2
107.31 J/cm2
90
% of Cell viability
80
% of Cell viability
85
70
80
60
75
50
70
65 40
60 30
0 50 100 150 200 0 50 100 150 200
Concentration (µg/ml) Concentration (µg/ml)
Figure 12. Cell viability of CS-CT nanocomposites on HeLa cells after (a) 8 h, (b) 12 h, (c) 16 h and 0 (d) 24 h
of incubation.
Synthesis of chitosan loaded CdO‑TiO2 (CS‑CT). The same procedure has been adopted up to the
formation of a gel. The procedure for the CS synthesis from crab shells has been followed from the reported
literature62. To the gel, CS solution (1 g of CS in 100 mL of 1% (v/v) acetic acid) was added and stirred for 1 h.
The resultant product was filtered off and washed completely with 1:1 aqueous ethanol and dried for 6 h at 120
ºC. The samples were calcined at 500 ºC for 3 h by a Muffle furnace.
Synthesis of garlic loaded CdO‑TiO2 (AS‑CT). The same procedure has been adopted up to the for-
mation of a gel. Freshly crushed garlic cloves were made into tiny pieces and grounded finely with a required
amount of water for getting the garlic extract. To the gel, 10 ml of as-prepared garlic extract was mixed on con-
tinuous stirring and the resultant solution was allowed for ageing (24 h) and then filtered, dried for 6 h at 120 °C
and calcinated at 500 °C for 3 h to get the corresponding AS-CT nanocomposites.
The experiments done on plants are in accordance with international, national and/or institutional guidelines.
Instrumentation. Bruker D2 Phaser Desktop X-ray Diffractometer (Cu Kα radiation (λ = 1.542 Å)) was
used to analyze the XRD. FE-SEM was investigated using a DXS-10 ACKT scanning electron microscope with
EDAX. TEM images were examined from the JEOL JEM-3010 microscope with 600 and 800 k times magnifica-
tion operated at 300 keV. Shimadzu 2100 UV–Visible spectrophotometer was used to study the DRS-UV Visible
spectra between 200 and 800 nm. FT-IR spectrum was investigated by using a Perkin Elmer RX1 using solid
Scientific Reports | (2021) 11:20790 | https://doi.org/10.1038/s41598-021-00242-5 13
Vol.:(0123456789)www.nature.com/scientificreports/
35.77 J/cm2
102 105
(a) 53.65 J/cm2
100 (b) 35.77 J/cm2
71.54 J/cm2
98 100 53.65 J/cm2
89.43 J/cm2
96 71.54 J/cm2
107.31 J/cm2
94 95 89.43 J/cm2
92 107.31 J/cm2
90 90
% of Cell viability
88
% of Cell viability
86 85
84
82 80
80
78 75
76
74 70
72
70 65
68
66 60
0 50 100 150 200 0 50 100 150 200
Concentration (µg/ml) Concentration (µg/ml)
110
105
100 35.77 J/cm2 100
35.77 J/cm2
(C)
95 53.65 J/cm2 (d) 53.65 J/cm2
71.54 J/cm2 90
71.54 J/cm2
90
89.43 J/cm2
89.43 J/cm2
85 107.31 J/cm2 80
107.31 J/cm2
% of Cell viability
80
% of Cell viability
70
75
70 60
65
50
60
55 40
50
30
45
40 20
0 50 100 150 200 0 50 100 150 200
Concentration (µg/ml) % of Cell viability
Figure 13. Cell viability of AS-CT nanocomposites on HeLa cells after (a) 8 h, (b) 12 h, (c) 16 h and (d) 24 h of
incubation.
KBr pellets. WATERS SDT Q 600 TA instrument was used to analyze the TG–DTA of the synthesized nano-
composites.
Photocatalytic activity. The required amount of MB, MO and Rh-B dye solutions were prepared with
doubly distilled water. MB, MO and Rh-B exhibit absorption maximum of 663, 464 and 555 nm and the absorb-
ance of each dye at various ppm (MB—5 ppm, MO—20 ppm, Rh-B—5 ppm) was measured to construct the
calibration curve. From the measured absorbance, the concentration of the dyes before and after illumination
was determined.
To the as-prepared dye solution (50 mL), a required quantity of photocatalyst was added and kept under an
air atmosphere at a constant rate. The photocatalyst was isolated after the illumination and the dye was measured
spectrophotometrically.
The solar light intensities were evaluated by using a New 200,000 Lux Digital Meter Light Luxmeter Meter
Photometer with Footcandle FC and the intensity was 1200 X 100 ± 100 lx and almost identical during the
experiments.
All the photocatalytic analysis was conducted under the same environment on sunny days between 12.00–2.30
p.m. and the reaction mixture (50 mL) was illuminated with sunlight. An open borosilicate glass beaker with a
Scientific Reports | (2021) 11:20790 | https://doi.org/10.1038/s41598-021-00242-5 14
Vol:.(1234567890)www.nature.com/scientificreports/
Figure 14. The plausible mechanism of PDT leading to cell death.
capacity of 50 mL, a height of 40 cm and a diameter 20 mm was taken as a reaction container and the irradiation
was applied in an open-air condition. Dye solution (50 mL) containing the photocatalysts was continuously
aired and mixed thoroughly. No solvent volatility was noticed during the illumination. Periodically, sample
solution (3 mL) was collected and the catalyst was separated by centrifugation. The sample (1 mL) solution was
accurately diluted and its absorbance was measured at 555, 663 and 464 nm to evaluate the dye Rh-B, MB and
MO degradation, respectively.
Photodynamic activity. Human cervical cancer cell line (HeLa) was collected from NCCS, Pune and cul-
tured in a medium with fetal bovine serum (10%). During analysis, HeLa cells (2 × 10⁴ cells/ml) were placed into
wells of 2.5 cm diameter containing medium and incubated at 37 °C with 95% air and 5% CO2. The different
concentrations of the samples (50, 100, 150 and 200 μg/ml) were added into the wells. The HeLa cells without the
sample were used as control and the cells with samples were incubated at 37 °C for 3 h in a 5% C O2 atmosphere
and irradiated at various time intervals (10, 15, 20, 25 and 30 min) using an LED light source (250, 300 and
410 nm). The HeLa cells viability was estimated at various incubation periods (8, 12, 16 and 24 h) after treatment.
The measurement of cell viability plays a fundamental role in all forms of cell culture. Cell-based assays are
used to study the direct cytotoxic effects of drugs. Among the cell viability assays, the MTT assay (3-[4,5-dimeth-
ylthiazol-2-yl]-2,5-diphenyl tetrazolium bromide) is one of the most prominent methods for studying the mito-
chondrial dehydrogenase activity in living cells for safety and easy to use. In this method, viable cells convert
MTT into a purple-colored formazan crystal having an absorbance maximum of around 570 nm. Thus, the color
formation provides a convenient and effective marker of only the viable cells. 10 μl of MTT was added to each
well after 8, 12, 16 and 24 h of incubation. The obtained formazan crystals were dissolved in dimethyl sulfoxide
(200 μl) and the absorbance intensity at 570 nm was d etermined63–65.
Absorbance of the irradiated sample
% of Cell viability = × 100
Absorbance of the Control
Received: 4 June 2021; Accepted: 8 October 2021
References
1. Sarina, S., Waclawik, E. R. & Zhu, H. Photocatalysis on supported gold and silver NPs under ultraviolet and visible light irradiation.
Green Chem. 15, 1814–1833 (2013).
2. Morris, R. L. et al. Cancer Res. 63, 5194 (2003).
3. Dougherty, T. J., Grinday, G. B., Fiel, R., Weishaupt, K. R. & Boyle, D. G. Photoradiation therapy II: cure of animal tumors with
heamatoporphyrin and light. J. Natl. Cancer Inst. 55, 115–121 (1973).
4. Dhanalekshmi, K. I. et al. Preparation and characterization of core-shell type Ag@SiO2 NPs for photodynamic cancer therapy.
Photodiagnosis Photodyn. Ther. 28, 324–329 (2019).
5. Diego, H. P. S., Robson, R. G., Thiago, C. C. & Vitor, M. Z. Investigation of the photocatalytic activity of titanium dioxide films
under visible light measured by electrospray mass spectrometry. New J. Chem. 42, 18259–18268 (2018).
6. Alex, A. L. S. et al. Efficacy of photodynamic therapy using TiO2 NPs doped with Zn and hypericin in the treatment of cutaneous
Leishmaniasis caused by Leishmania amazonensis. Photodiagnosis Photodyn. Ther. 30, 101 (2020).
7. Akhshay, S. B. et al. Biogenic synthesis and photocatalytic activity of CdS NPs. RSC Adv. 4, 9484–9490 (2014).
Scientific Reports | (2021) 11:20790 | https://doi.org/10.1038/s41598-021-00242-5 15
Vol.:(0123456789)www.nature.com/scientificreports/
8. Fengjuan, C., Yali, C., Dianzeng, J. & Xiaojuan, N. Facile synthesis of CdS NPs photocatalyst with high performance. Ceram. Int.
39, 1511–1517 (2013).
9. Swarup, K. M., Nillohit, M., Anup, M. & Bibhutosh, A. Synthesis, characterization and photocatalytic activity of α-Fe2O3 NPs.
Polyhedron 33, 145–149 (2012).
10. Ramesh, N. et al. A novel nanohybrid for cancer theranostics: folate sensitized F e2O3 NPs for colorectal cancer diagnosis and
photodynamic therapy. J. Mater. Chem. B 5, 3927 (2017).
11. Jena, M. et al. Optimization of parameters for maximizing photocatalytic behaviour of Z n1-xFexO nanoparticles for methyl orange
degradation using Taguchi and Grey relational analysis approach. Mater. Today Chem. 12, 187–199 (2019).
12. Tariq, K., Foad, B. & Kamal, G. Phycosynthesis and enhanced photocatalytic activity of zinc oxide NPs toward organosulfur pol-
lutants. Sci. Rep. 9, 6866 (2019).
13. Jingyuan, L. et al. The Photodynamic effect of different Size ZnO NPs on cancer cell proliferation in vitro. Nanoscale Res. Lett. 5,
1063 (2010).
14. Vidya, C., Manjunatha, C., Chandraprabha, M. N., Megha, R. & Antony Raj, M. A. L. Hazard free green synthesis of ZnO nano-
photo-catalyst using Artocarpus Heterophyllus leaf extract for the degradation of Congo red dye in water treatment applications.
J. nviron. Chem. Eng. 5, 3172–3180 (2017).
15. Huang, N., Xu, M., Yuan, C. & Yu, R. The study of the photokilling effect and mechanism of ultrafine TiO2 particles on U937 cells.
J. Photochem. Photobiol. A: Chem. 108, 229 (1997).
16. Inoue, T., Fujishima, A. & Honda, K. Photoelectrocatalytic reduction of carbon dioxide in aqueous suspensions of semiconductor
powders. Nature 277, 637 (1979).
17. Jun, O. & Tomoji, K. Photochemical formation of glycine and methylamine from glycolic acid and ammonia in the presence of
particulate cadmium sulphide. J. Chem. Soc. Chem. Commun. 19, 1480–1481 (1987).
18. Hui, Y., Xudong, W., Man, Y. & Xiaojie, Y. Band structure design of semiconductors for enhanced photocatalytic activity: the case
of TiO2. Prog. Nat. Sci. 23, 402–407 (2013).
19. Su, Y., Peng, F., Jiang, Z., Zhong, Y. & Lu, Y. In vivo distribution, pharmacokinetics, and toxicity of aqueous synthesized cadmium-
containing quantum dots. Biomaterials 32, 5855–5862 (2011).
20. Zhiyue, H., Jingchang, Z., Xiuying, Y. & Weiliang, C. Synthesis and application in solar cell of poly(3-octylthiophene)/cadmium
sulfide nanocomposite. Sol. Energy Mater. Sol. Cells 95, 483–490 (2011).
21. Eiichi, S., Yuichi, S., Abulajiang, S. E. & Osahiko, A. H. First demonstration of iodine mapping in nonliving phantoms using an
X-ray fluorescence computed tomography system with a cadmium telluride detector and a tungsten-target tube. Nucl. Instrum.
Methods Phys. Res., Sect. A 638, 187–191 (2011).
22. Pulakesh, B., Chong-H, K. & Sang, I. I. S. High-yield synthesis of quantum-confined CdS nanorods using a new dimeric cadmium
(II) complex of S-benzyldithiocarbazate as single-source molecular precursor. Solid State Sci. 12, 532–535 (2010).
23. Malekigorji, M., Curtis, A. D. M. & Hoskins, C. The use of iron oxide NPs for pancreatic cancer therapy. J. Nanomed. Res. 1, 00004
(2014).
24. Cruje, C. & Chithrani, D. B. Polyethylene glycol density and length affects nanoparticle uptake by cancer cells. J. Nanomed. Res.
1, 00006 (2014).
25. Malekigorji, M., Hoskins, C., Curtis, T. & Varbiro, G. Enhancement of the cytotoxic effect of anticancer agent by cytochrome C
functionalised hybrid nps in hepatocellular cancer cells. J. Nanomed. Res. 1, 00010 (2014).
26. Mayen-Hernandeza, S. A., Torres-Delgadoa, G. R. & Castanedo-Pereza, R. CdO+-CdTiO3 thin films prepared by sol–gel. Solar
Energy Mater. Solar Cells 90, 2280–2288 (2006).
27. Dhatshanamurthi, P., Subash, B. & Shanthi, M. Investigation on UV-A light photocatalytic degradation of an azo dye in the pres-
ence of CdO/TiO2 coupled semiconductor. Mat. Sci semicon. Proc. 35, 22–29 (2015).
28. Kai-Cheng, Z., Yong-Feng, L., Yong, L. & Yan, Z. Possible ferromagnetism in Cd-doped T iO2: a first-principles study. Physica B
422, 28–32 (2013).
29. El Sayed, A. M., El-Sayed, S., Morsi, W. M., Mahrous, S. & Hassen, A. Synthesis, characterization, optical, and dielectric properties
of polyvinyl chloride/cadmium oxide nanocomposite films. Polym. Compos. 35, 1842–1851 (2014).
30. Lim, I., Shinde, D. V., Patil, S. A., Ahn, D. Y. & Lee, W. Interfacial engineering of CdO–CdSe 3D microarchitectures with in situ
photopolymerized PEDOT for an enhanced photovoltaic performance. Photochem. Photobiol. 91, 780–785 (2015).
31. Shi, Y., Chen, Y., Tian, G., Wang, L. & Xiao, Y. Hierarchical Ag/Ag2S/CuS ternary heterostructure composite as an efficient visible-
light photocatalyst. Chem. Cat. Chem. 7, 1684–1690 (2015).
32. Van, T. K., Pham, L. Q., Kim Do, Y., Zheng, J. Y. & Kim, D. Formation of a CdO layer on CdS/ZnO nanorod arrays to enhance
their photoelectrochemical performance. Chem. Sus. Chem. 7, 3505–3512 (2014).
33. Peng, H. et al. The antitumor effect of cisplatin-loaded thermosensitive chitosan hydrogel combined with radiotherapy on naso-
pharyngeal carcinoma. Int. J. Pharm. 556, 97–105 (2019).
34. Martínez-Martínez, M. et al. Covalently crosslinked organophosphorous derivatives-chitosan hydrogel as a drug delivery system
for oral administration of camptothecin. Eur. J. Pharm Biopharm. 136, 174–183 (2019).
35. Guillard, C. et al. Solar efficiency of a new deposited titania photocatalyst: chlorophenol, pesticide and dye removal applications.
Appl. Catal. B 46, 319–332 (2003).
36. Herrmann, J. M. Heterogeneous photocatalysis: an emerging discipline involving multiphase systems. Catal. Today. 24, 157–164
(1995).
37. Legrini, O., Oliveros, E. & Braun, A. Photochemical processes for water treatment. Chem. Rev. 93, 671–698 (1993).
38. Portero, A., Remunan-Lopez, C. & Vila-Jato, J. L. Effect of chitosan and chitosan glutamate enhancing the dissolution properties
of the poorly water soluble drug nifedipine. Int. J. Pharm. 175, 75–84 (1998).
39. Kumar, M. N. V. R. A review of chitin and chitosan applications. React Funct Polym. 46, 1–27 (2000).
40. Kumar, M. N. V. R., Muzzarelli, R. A. A., Muzzarelli, C., Sashiwa, H. & Domb, A. J. Chitosan chemistry and pharmaceutical per-
spectives. Chem. Rev. 104, 6017–6084 (2004).
41. Koide, S. S. Chitin-chitosan: properties, benefits and risks. Nutr. Res. 18, 1091–1101 (1998).
42. Costa Idos, S., Abranches, R. P., Garcia, M. T. & Pierre, M. B. Chitosan based muco adhesive films containing 5-aminolevulinic
acid for buccal cancer’s treatment. J. Photochem. Photobiol. B. 140, 266–275 (2014).
43. Filip, A. et al. Effects of pdt with 5-aminolevulinic acid and chitosan on walker carcinosarcoma. Exp. Oncol. 30, 212–219 (2008).
44. Amagase, H., Petesch, B. L., Matsuura, H., Kasuga, S. & Itakura, Y. Intake of garlic and its bioactive components. J. Nutr. 131,
955–962 (2001).
45. Jurate, V. & Varma, R. S. Synthesis and visible light photoactivity of anatase Ag and garlic loaded T iO2 nanocrystalline catalyst.
RSC Adv. 2, 2399–2407 (2012).
46. Dhanalekshmi, K. I., Umapathy, M. J., Magesan, P. & Xiang, Z. Biomaterial (garlic and chitosan)-doped W O3-TiO2 hybrid nano-
composites: their solar light photocatalytic and antibacterial activities. ACS Omega 5, 31673–31683 (2020).
47. Manuel, S., Simone, B., Harpreet, K. L., Rita, B. & Elena, B. Energy dispersive X-ray (EDX) microanalysis: a powerful tool in
biomedical research and diagnosis. Eur. J. Histochem. 62, 2841 (2018).
48. Samuelson, D. A. Energy dispersive Xray microanalysis. Methods Mol Biol. 108, 413–424 (1998).
49. Liu, S. & Chen, X. A visible light response TiO2 photocatalyst realized by cationic S-doping and its application for phenol degrada-
tion. J. Hazard. Mater. 152, 48–55 (2008).
Scientific Reports | (2021) 11:20790 | https://doi.org/10.1038/s41598-021-00242-5 16
Vol:.(1234567890)www.nature.com/scientificreports/
50. Chatterjee, D. & Dasgupta, S. Visible light-induced photocatalytic degradation of organic pollutants. J. Photochem. Photobiol. C
6, 186–205 (2005).
51. Zainal, Z., Hui, L. K., Hussein, M. Z., Abdullah, A. H. & Hamadneh, I. R. Characterization of TiO2-chitosan/glass photocatalyst
for the removal of a monoazo dye via photodegradation–adsorption process. J. Hazard. Mater. 164, 138–145 (2009).
52. Wan Ngaha, W. S., Teonga, L. C. & Hanafiaha, M. A. K. M. Adsorption of dyes and heavy metal ions by chitosan composites: A
review. Carbohyd. Polym. 83, 1446–1456 (2011).
53. Periyat, P., Pillai, S. C., McCormack, D. E., Colreavy, J. & Hinder, S. J. Improved high-temperature stability and sun-light-driven
photocatalytic activity of sulfur-doped anatase T iO2. J. Phys. Chem. C 112, 7644–7652 (2008).
54. Li, H., Zhang, X., Huo, Y. & Zhu, J. Supercritical preparation of a highly active S-doped TiO2 photocatalyst for methylene blue
mineralization. Environ. Sci. Technol. 41, 4410–4414 (2007).
55. Hebenstreit, E. L. D., Hebenstreit, W. & Diebold, U. Structures of sulfur on T iO2 (110) determined by scanning tunneling micros-
copy, X-ray photoelectron spectroscopy and low-energy electron diffraction. Surf. Sci. 470, 347–360 (2001).
56. Hamadanian, M., Reisi-Vanani, A. & Majedi, A. Preparation and characterization of S-doped TiO2nanoparticles, effect of calcina-
tion temperature and evaluation of photocatalytic activity. Mater. Chem. Phys. 116, 376–382 (2009).
57. Zhang, F. et al. TiO2-assisted photodegradation of dye pollutants II. Adsorption and degradation kinetics of eosin in TiO2 disper-
sions under visible light irradiation. Appl. Catal. B Environ. 15, 147–156 (1998).
58. Znad, H. & Kawase, Y. Synthesis and characterization of S-doped Degussa P25 with application in decolorization of Orange II dye
as a model substrate. J. Mol. Catal. A: Chem. 314, 55–62 (2009).
59. Heinlaan, M., Ivask, A., Blinova, I., Dubourguier, H. C. & Kahru, A. Toxicity of nanosized and bulk ZnO, CuO and T iO2 to bacteria
Vibrio fischeri and crustaceans Daphnia magna and Thamnocephalusplatyurus. Chemosphere 71, 1308–1316 (2008).
60. Liu, Y., Liu, J., Lin, Y., Zhang, Y. & Wei, Y. Simple fabrication and photocatalytic activity of S-doped T
iO2 under low power LED
visible light irradiation. Ceram. Int. 35, 3061–3065 (2009).
61. Colón, G., Hidalgo, M. C., Navío, J. A., Kubacka, A. & Fernández-García, M. Influence of sulfur on the structural, surface proper-
ties and photocatalytic activity of sulfated TiO2. Appl. Catal. B: Environ. 90(3–4), 633–641 (2009).
62. Magesan, P., Sanuja, S. & Umapathy, M. J. Novel hybrid chitosan blended MoO3–TiO2 nanocomposite film: evaluation of its solar
light photocatalytic and antibacterial activities. RSC Adv. 5, 42506–42515 (2015).
63. Mossman, T. Rapid colorimetric assay for cellular growth and survival: application to proliferation and cytotoxicity assays. J.
Immun. Methods 65, 55–63 (1983).
64. Roy, I., Ohulchanskyy, T. Y. & Pudavar, H. E. Ceramic-based NPs entrapping water-insoluble photosensitizing anticancer drugs:
a novel drug—carrier system for photody-namic therapy. J Am. Chem. Soc. 125, 7860–7865 (2003).
65. Wu, R. W. K., Yow, C. M. N., Wong, C. K. & Lam, Y. H. Photodynamic therapy(PDT)-initiation of apoptosis via activation of
stress-activatedp38 MAPK and JNK signal pathway in H460 cell lines. Photodiagnosis Photodyn. Ther. 8, 254–263 (2011).
Author contributions
K.I.D, N.S, K.J, X.Z contributed to the synthesis, instrumentations, photocatalytic and photodynamic studies.
M.P and M.J.U contributed contributed to the overall concept design of this work.
Competing interests
The authors declare no competing interests.
Additional information
Correspondence and requests for materials should be addressed to P.M.
Reprints and permissions information is available at www.nature.com/reprints.
Publisher’s note Springer Nature remains neutral with regard to jurisdictional claims in published maps and
institutional affiliations.
Open Access This article is licensed under a Creative Commons Attribution 4.0 International
License, which permits use, sharing, adaptation, distribution and reproduction in any medium or
format, as long as you give appropriate credit to the original author(s) and the source, provide a link to the
Creative Commons licence, and indicate if changes were made. The images or other third party material in this
article are included in the article’s Creative Commons licence, unless indicated otherwise in a credit line to the
material. If material is not included in the article’s Creative Commons licence and your intended use is not
permitted by statutory regulation or exceeds the permitted use, you will need to obtain permission directly from
the copyright holder. To view a copy of this licence, visit http://creativecommons.org/licenses/by/4.0/.
© The Author(s) 2021
Scientific Reports | (2021) 11:20790 | https://doi.org/10.1038/s41598-021-00242-5 17
Vol.:(0123456789)You can also read