Labrador Slope Water connects the subarctic with the Gulf Stream
←
→
Page content transcription
If your browser does not render page correctly, please read the page content below
LETTER • OPEN ACCESS

Labrador Slope Water connects the subarctic with the Gulf Stream
To cite this article: A L New et al 2021 Environ. Res. Lett. 16 084019

View the article online for updates and enhancements.

                                This content was downloaded from IP address 80.42.22.59 on 09/09/2021 at 15:30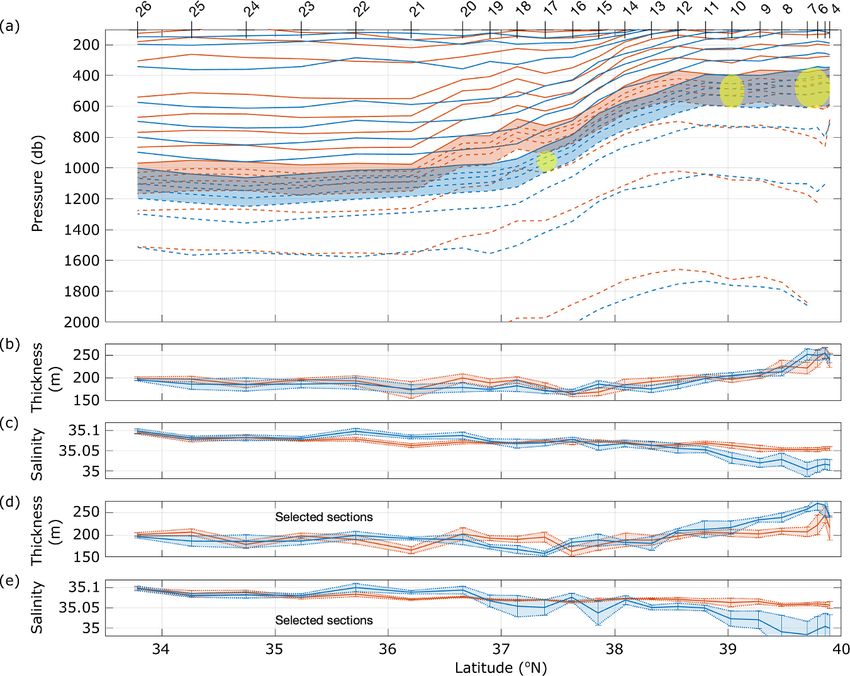
Environ. Res. Lett. 16 (2021) 084019 https://doi.org/10.1088/1748-9326/ac1293
LETTER
Labrador Slope Water connects the subarctic with the Gulf
OPEN ACCESS
Stream
RECEIVED
3 March 2021 A L New1,∗, D A Smeed1, A Czaja2, A T Blaker1, J V Mecking1, J P Mathews2
REVISED
23 June 2021
and A Sanchez-Franks1
1
ACCEPTED FOR PUBLICATION
National Oceanography Centre, European Way, Southampton SO14 3ZH, United Kingdom
2
8 July 2021 Imperial College, Department of Physics, Prince Consort Road, London SW7 2AZ, United Kingdom
∗
Author to whom any correspondence should be addressed.
PUBLISHED
28 July 2021 E-mail: A.New@noc.ac.uk
Keywords: Labrador Slope Water, Slope Sea, Gulf Stream, Atlantic Meridional Overturning Circulation, climate variability
Original content from
this work may be used Supplementary material for this article is available online
under the terms of the
Creative Commons
Attribution 4.0 licence.
Any further distribution Abstract
of this work must
maintain attribution to Labrador Slope Water (LSLW) is a relatively fresh and cool water mass that originates from the
the author(s) and the title
of the work, journal
Labrador Current in the subarctic and is known to occur in the Eastern Slope Sea on the
citation and DOI. US-Canadian shelf-slope north of the Gulf Stream. It has potential densities of 27.4–27.65 kg m−3 .
Using ocean observations, we show here that the LSLW penetrates as a boundary current deeply
into the Western Slope Sea (west of 66◦ W) as a salinity minimum between 400 and 600 m, bringing
it into close proximity with the Gulf Stream. The LSLW at Line W (near 69◦ W) also spreads across,
and brings fresher and thicker waters to, the Slope Sea north of the Gulf Stream. A high-resolution
ocean model simulation shows that the spreading of the LSLW occurs throughout the entire Slope
Sea through the extrusion of fine-scale filaments from the boundary current following interaction
with Gulf Stream meanders and eddies. At Line W, the LSLW is also found to be fresher and thicker
between 2003 and 2008, when the Atlantic Meridional Overturning Circulation (AMOC) at 26◦ N
is higher (by 3 Sv), and the Shelf Slope Front is further south (by 0.7◦ ), compared to AMOC low
conditions in 2009–2014. The thicker LSLW causes lighter isopycnals to rise over the shelf slope,
and through increasing the lateral density gradient contributes an additional 1.3 Sv to the Gulf
Stream transport. These changes to the LSLW and the Shelf Slope Front are likely to result from an
enhanced flow of the Labrador Current into the Slope Sea, caused by changes in the wind stress in
the subpolar gyre. The transport of the LSLW (as opposed to the deeper Labrador Sea Water)
thereby offers a potential new mechanism for decadal variability in the Atlantic climate system,
through connecting changes in the subarctic with subsequent variability in the Gulf Stream and
AMOC.
1. Introduction the Grand Banks (TGB). The upper waters of the
Eastern Slope Sea (52–66◦ W) consist of Warm Slope
The Atlantic Meridional Overturning Circulation Water in the upper 300 m immediately north of the
(AMOC) carries warm, salty near-surface waters Gulf Stream and overlying North Atlantic Central
northwards, a major component of this being the Gulf Water, and the fresher Labrador Slope Water (LSLW)
Stream, and cooler, fresher deeper waters southwards, near the shelf slope (Gatien 1976, Fratantoni and
particularly in the Deep Western Boundary Current Pickart 2007). The LSLW has a core potential dens-
(DWBC), the whole being a key component of the ity (referenced to the surface, σ 0 , used throughout
climate system (e.g. Smeed et al 2018). As such, it the present study) near 27.5 kg m−3 , and at 65◦ W
is critical to better understand the mechanisms that is centred between 400 and 800 m, below the even
regulate its variability. fresher Coastal Water in the upper 50–100 m. The
The Slope Sea (figure 1) is found between the Coastal Water extends from the shelf into the Slope
Gulf Stream and the shelf-slope west of the Tail of Sea, and the boundary between it and the Warm Slope
© 2021 The Author(s). Published by IOP Publishing Ltd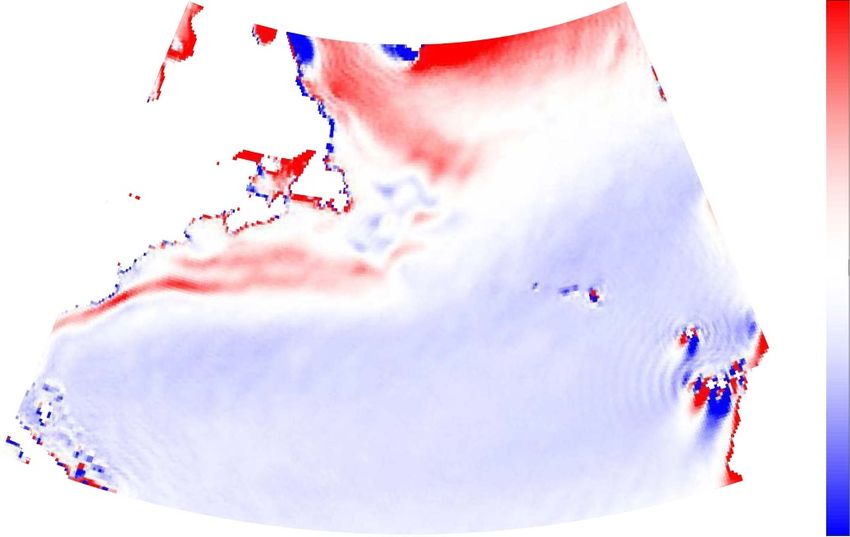
Environ. Res. Lett. 16 (2021) 084019                                                                                    A L New et al

   Figure 1. Circulation schematic of the Slope Sea (the region between the Gulf Stream and the shelf slope between 52 and 75◦ W),
   showing the Labrador Current (LC), Labrador Slope Water (LSLW), the Shelf Break Jet (SBJ), the Gulf Stream (GS), Line W
   (dashed red) and Station 7 (red circle), the Northern Recirculation Gyre (NRG), the North-West Recirculation Gyre (NWRG) and
   the Shelf Slope Front (SSF). The ocean bathymetry is taken from the ETOPO1 dataset.

Water denotes the Shelf-Slope Front (Peterson et al                 Talley and McCartney 1982). Indeed, Csanady and
2017). The Warm Slope Water flows eastwards with                    Hamilton (1988) describe the circulation of the
the Gulf Stream, while the LSLW moves westward                      deeper waters in the Slope Sea (below 500 m and
along the slope (Gatien 1976). This circulation may                 colder than 6 ◦ C) as a southwestward flow as far as the
be viewed as a component of the Northern Recircu-                   Gulf Stream, labelling this as Labrador Basin Water.
lation Gyre (Hogg et al 1986), a barotropic cyclonic                Through reference to Richardson (1977), McCart-
cell in the Eastern Slope Sea. A pronounced cyclonic                ney and Talley (1982), and Talley and McCartney
cell is also found in the Western Slope Sea (66–75◦ W),             (1982), it is clear that this is essentially the LSW. How-
which we here call the North-West Recirculation Gyre                ever, Richardson (1977) shows a section at Cape Hat-
(Csanady and Hamilton 1988, Andres et al 2020).                     teras in which there is a minimum in the salinity
     The LSLW derives its (cold, fresh) core properties             anomaly (when compared with mean western North
from the Labrador Current in the subarctic region of                Atlantic conditions) on the slopes between 400 and
the Labrador Sea. The Labrador Current system has                   1000 m which could indicate the presence of the
an inshore branch exiting the Hudson Strait (which                  LSLW here as well as the LSW, although this was not
flows over the Grand Banks and continues as the Nova                made explicit. Finally, the DWBC has traditionally
Scotia Current, Rossby 1999, Townsend et al 2015)                   been thought of as a continuous boundary current
and a further core (the LC) on the upper Labrador                   from the subpolar gyre, and the main conduit for
shelf-slope, comprising waters from the Davis Strait                the AMOC southward return flow (Watts 1991, Joyce
and (slightly more saline) the West Greenland Cur-                  et al 2005, Gary et al 2011, Peña-Molino et al 2011).
rent (Florindo-López et al 2020). The LC flows south-               However, recent float and tracer studies (Bower
wards and partially rounds the TGB into the Slope Sea               et al 2009, 2011, Smith et al 2016) and modelling
(figure 1), where it continues as the Shelf Break Jet,              investigations (Gary et al 2011) have challenged this
or Labrador Current Extension, in the upper 200 m,                  view, showing instead the importance of an interior
through the entire Western Slope Sea (Flagg et al                   route through the Newfoundland Basin for these
2006, Fratantoni and Pickart 2007). The inflowing LC                waters.
water also mixes with the (warmer and more saline)                      Freshening, cooling and an increased prevalence
North Atlantic Central Water and forms the origins                  of LSLW in the Eastern Slope Sea would be expec-
of the LSLW in the Slope Sea (Gatien 1976, Petrie and               ted to result from an enhanced flow of the LC into
Drinkwater 1993). The LSLW is thereby distinct from                 the Slope Sea (Petrie and Drinkwater 1993). This in
the deeper Labrador Sea Water (LSW), which instead                  turn may result from a high AMOC, which could be
forms through open ocean convection in the subpolar                 associated with increased DWBC transport and vor-
gyre (McCartney and Talley 1982).                                   tex stretching near the TGB, leading to a strength-
     Below the LSLW in the Slope Sea, the DWBC                      ening and expansion of the Northern Recirculation
carries the LSW (with neutral densities greater                     Gyre and a more southerly Gulf Stream in the Eastern
than 27.8 kg m−3 , equivalent to σ 0 greater than                   Slope Sea (Zhang and Vallis 2007). This may then
27.68 kg m−3 ) and deeper waters westwards (e.g.                    lead to freshening of the LSLW in the bottom waters

                                                      2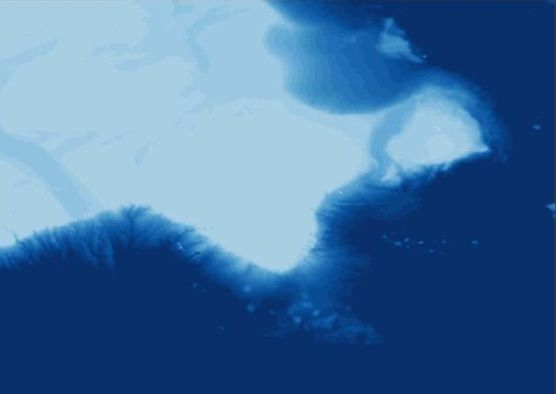
Environ. Res. Lett. 16 (2021) 084019                                                                  A L New et al

of the Laurentian Channel, the Scotian Shelf and           the relationship of the temperature (T) and salinity
the Gulf of Maine (Saba et al 2016, Thibodeau et al        (S) of various water masses. Water masses form with
2018) and higher levels of nutrients and oxygen in         different temperature and salinity in different parts
the near surface waters (Sanchez-Franks and Zhang          of the ocean surface through interaction with atmo-
2015, Claret et al 2018). Alternatively, larger inflows    spheric fluxes. These water masses are then drawn
of the LC may result from a southward shift of wind        down into the ocean interior, recirculating over large
stress patterns in the subpolar gyre, again resulting      distances. Here, since mixing is generally low, they
in cooling and freshening in the Eastern Slope Sea         tend to maintain their T/S properties quite well as
(Peterson et al 2017, Holliday et al 2020). An increas-    they recirculate. Therefore, they can be easily dis-
ing proportion of LSLW in the Gulf of Maine may            tinguished in diagrams plotting their temperature
also result from decreases in either the Nova Scotia       against their salinity, usually by either minima or
Current (Townsend et al 2015) or a shift from a pos-       maxima in one or other of these properties.
itive to a negative phase of the North Atlantic Oscil-         We also undertake analysis of the ERA5 monthly-
lation (NAO, Mountain 2012). This latter relation-         averaged wind stress fields (Hersbach et al 2019),
ship is supported by Marsh (2000), who forced a 1◦         which provides an updated version of the ERA-
ocean model with extreme negative NAO conditions           interim fields, and with increased horizontal resolu-
(in which the Icelandic Low was typically further to       tion (0.25◦ rather than approximately 0.75◦ ).
the southwest), resulting in the subpolar gyre expand-         Finally, we employ a global simulation with the
ing to the south, which in turn allowed an enhanced        NEMO (v3.2) ocean model (Madec 2008). With
flow of Labrador Current waters westwards from the         a horizontal resolution of 1/12◦ and 75 levels in
Grand Banks, and cooling in the Eastern Slope Sea.         the vertical, the model resolves the details of the
     Consequently, while the focus of the above studies    flow in the Slope Sea. Realistic bottom topography
has been on the Eastern Slope Sea, the presence of the     is interpolated from ETOPO2 (U.S. Department of
LSLW in the Western Slope Sea has so far been largely      Commerce 2006) and surface forcing is provided by
undocumented. We therefore examine here the pen-           DFS4.1 (Brodeau et al 2010). The simulation starts
etration of the LSLW into the Western Slope Sea, how       from rest and January climatological initial condi-
its characteristics change between recent AMOC high        tions for temperature and salinity, which are provided
and low periods, and its impact on the Gulf Stream.        by the World Ocean Atlas 2005 (Antonov et al 2006,
                                                           Locarnini et al 2006). This simulation shows a good
2. Methods and data                                        representation of features that are important for this
                                                           study, such as the subpolar gyre and the Gulf Stream
We use the EN4.2.1 dataset, which provides monthly         (Marzocchi et al 2015).
gridded objective analyses of available ocean obser-
vations at 1◦ resolution (Good et al 2013). Profiles       3. Westward penetration
with density inversions which are thought to be spuri-
ous and related to anomalously cold water at 657 m         The mean intermediate-depth water column salin-
are removed from our analysis. Furthermore, EN4            ity structure in EN4.2.1 is now examined between
profiles are derived through averaging on constant         September 2003 and August 2015 (a whole number
depth levels, and are subject to biases similar to those   of years to remove any seasonal bias). Figure 2(a)
reported by Lozier et al (1994) in the Levitus climato-    shows the salinity at 541 m, this being close to the
logy (Levitus 1982). These biases are largest in frontal   depth of the core of the LSLW. The fresh LSLW (with
regions where the isopycnals slope steeply such as         salinity below 35.2 and density near 27.6 kg m−3 )
the Gulf Stream, and result in water which is too          extends as a boundary current around the TGB and
warm and saline on intermediate-depth isopycnals.          into the Western Slope Sea as far as Cape Hatteras.
However, while EN4 cannot therefore be used for            It also spreads southwards as far as the centre of the
isopycnal analysis in the Gulf Stream core, it may         Gulf Stream over the entire Slope Sea (e.g. the fresher
be employed to examine the mean structure of the           waters extending southwards to the 27.2 kg m−3
LSLW along the shelf slope where the isopycnals are        isopycnal).
relatively flat. These issues are described more fully          At 52◦ W, the LC appears as the broad (2◦ wide)
in the supplementary material (available online at         fresh region nearest the slope and extending to 600 m
stacks.iop.org/ERL/16/084019/mmedia).                      with salinities below 34.9 and densities less than
    We also use the Line W hydrographic observa-           27.65 kg m−3 (figure 2(b)). This structure is sim-
tions near 69◦ W (e.g. Joyce et al 2005). The Line         ilar to that at 46◦ N before the LC has rounded the
passes through the Western Slope Sea, extending            TGB (though extending only to 300 m there) and at
from Cape Cod towards Bermuda (figure 1), and              57◦ W near the Laurentian Channel (not shown). Fur-
provides full-depth high-quality hydrographic obser-       ther west, the LSLW at 62◦ W (figure 2(c)) appears as
vations at fixed station positions between 1994 and        a distinct low salinity core between 400 and 600 m
2014. Here, we employ water mass analysis, com-            above the shelf slope (marked by the red star at
monly used in oceanography, that is, examination of        43◦ N), and with densities of 27.4–27.65 kg m−3 , but

                                              3
Environ. Res. Lett. 16 (2021) 084019 A L New et al
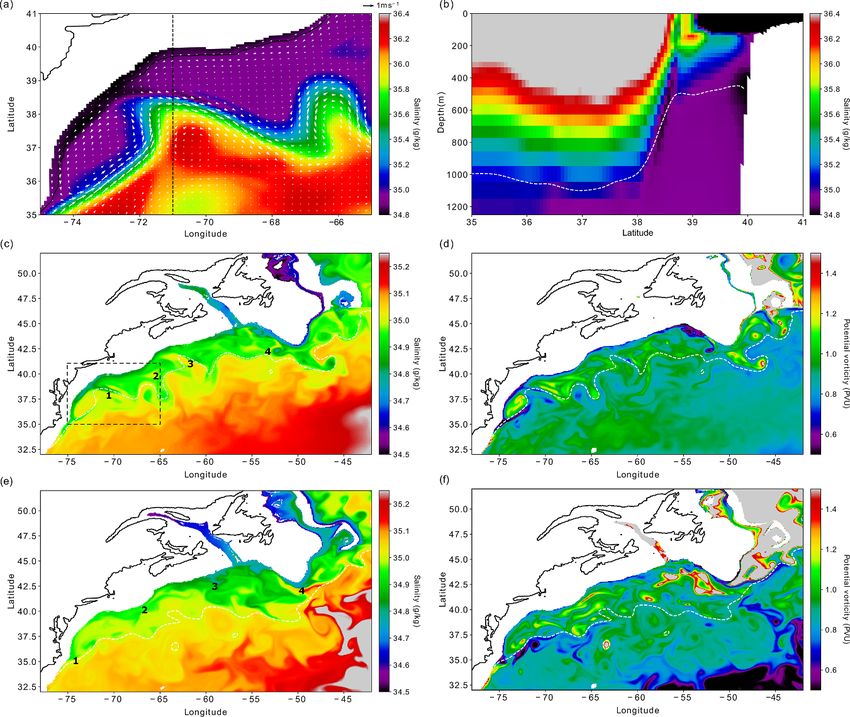
Figure 2. Salinity (colour) and potential density (σ 0 kg m−3 , white contours) in the Slope Sea from EN4.2.1, averaged between
September 2003 and August 2015. Salinity and potential density at (a) 541 m, (b) 52◦ W, (c) 62◦ W, (d) 67◦ W and (e) 72◦ W.
Potential density is shown with a contour interval of 0.2 kg m−3 where equal to or lower than 27.6 kg m−3 (solid white lines) and
with a contour interval of 0.05 kg m−3 where higher than 27.6 kg m−3 (dashed white lines). Black lines in (a) show the locations
of the sections in subsequent panels, and those in (b) to (e) show the depth of the map in (a). The red stars in (c) to (e) show the
position of the LSLW low salinity core. The 27.2 kg m−3 isopycnal shows the approximate centre of the Gulf Stream at 541 m
in (a).
is here only 1◦ wide. The Warm Slope Water is indic- LSLW has penetrated deeply into the Western Slope
ated by the yellow colours immediately to the south Sea.
in the upper 300–400 m, and the Coastal Water by
the freshest waters in the upper 100 m above the 4. Variability and links to the AMOC
shelf and slope. The structure is similar at 67 and
72◦ W (figures 2(d) and (e)), with an easily identifi- We now discuss the Line W observations between
able LSLW salinity minimum, clearly showing that the September 2003 and August 2014. By analogy with
4Environ. Res. Lett. 16 (2021) 084019 A L New et al
Figure 3. Hydrographic data from Line W. (a) Potential temperature versus salinity for the May 2008 occupation, and stations
4–17 (see figure 4(a) for station positions). Individual station profiles are shown by the coloured contours as indicated in the
inset. Potential density contours are also shown in increments of 0.1 kg m−3 , with the 27.2 and 27.8 kg m−3 contours shown by
the thick continuous lines. (b) Potential density versus salinity at Station 7 and averaged over all occupations during the AMOC
high period (blue) and the AMOC low period (red). Standard errors of the means are shown by the dotted lines and crosses
indicate where the difference between the two periods is significant (95% confidence). (c) Similar to (b) but showing pressure
(decibars, db, approximately equal to depth in m) versus potential density. (d) Geostrophic transport change at Station 7
(integrated upwards from 2000 m, and plotted against db) inferred from the profiles in the two periods chosen in panel (c),
showing the mean and standard error. (e) Salinity on the potential density surface 27.55 kg m−3 as a function of latitude and time
(showing all occupations between 1 January 2003 and 31 December 2014, and all stations from Station 4 seawards). The blue
circles show the three ‘fresh’ (between 2003 and 2008), and the red circles the three ‘salty’ (between 2009 and 2014), occupations
chosen for further analysis.
Smeed et al (2018), who reported a reduction in of the centre of the Gulf Stream. The LSLW there-
the AMOC of about 3 Sv (1 Sv = 106 m3 s−1 ) fore appears primarily as a boundary current (sup-
as measured by the RAPID array at 26◦ N from ported by Toole et al 2011) with a core at station 7,
2008, we refer to September 2003–August 2008 but also occurs intermittently across the entire North-
as the AMOC high period, and to September West Recirculation Gyre.
2008–August 2014 as the AMOC low, these being Figure 3(b) shows the mean salinity at station
complete numbers of years to reduce seasonal 7 during the AMOC high and low periods. The
biases. With reference to figure 3(e), which shows LSLW salinity minimum is only found in occupations
when the occupations occur, we consider these during the AMOC high period (though not in every
periods to represent 2003−2008 and 2009–2014 occupation), but is not found at all during the AMOC
respectively. low period. This results in the low salinity bulge
Figure 3(a) presents the Temperature/Salinity near 27.55 kg m−3 in the AMOC high period, which
curves from stations 4–17 (which extend seaward is absent in the AMOC low. We therefore define
from the shelf break with increasing station number, the LSLW to be centred on the 27.55 kg m−3 iso-
see figure 4(a)) for the May 2008 survey. The LSLW is pycnal, but to occupy densities between 27.4 and
the salinity minima between temperatures of 4.5 ◦ C 27.65 kg m−3 (which also avoids overlap with the
and 7 ◦ C and densities of 27.4 and 27.65 kg m−3 . LSW).
This occurs in stations 4–7 on the upper slopes, being This LSLW is also thicker at station 7 in the
most pronounced at station 7, where the water depth AMOC high period (see figure 4) and this res-
is about 2000 m. It is then absent in stations 8 and ults in the uplift of all isopycnals above the LSLW
9 but, surprisingly, re-appears at both stations 10 core, figure 3(c). The geostrophic transport calculated
and 17 but not at the intervening stations. At station between the density profiles in the AMOC high and
17, the LSLW penetrates deeply (to near 1000 m, see low periods will be the same as the transport differ-
figure 4(a)) and occurs underneath and southwards ence between each profile and some arbitrary profile
5Environ. Res. Lett. 16 (2021) 084019 A L New et al
Figure 4. (a) Density sections (plotted against depth in db) on Line W (constructed from the mean depths of the isopycnals) in
the AMOC high (blue) and low (red) periods between stations 4 and 26, with the LSLW layer (between densities 27.4 and
27.65 kg m−3 ) shown shaded. Contours are shown every 0.2 kg m−3 from and lower than 27.4 kg m−3 (solid lines), and every
0.05 kg m−3 from and higher than 27.5 kg m−3 (dashed lines). Station positions are indicated at the top of the panel and yellow
ovals show the occurrence of the freshest LSLW in the May 2008 occupation, overlaid on the density structure in the AMOC high
period. (b) Thickness (m) of the LSLW layer in the AMOC high (blue) and low (red) periods, showing the mean and standard
error of the mean. (c) Salinity on the 27.55 kg m−3 isopycnal in the AMOC high (blue) and low (red) periods, showing the mean
and standard error of the mean. Panels (d) and (e) are similar to (b) and (c) respectively, but use averages over the selected
full-length ‘fresh’ (November 2003, September 2004, and October 2007, in blue) and ‘salty’ (August 2012, May 2013, and May
2014, in red) sections as indicated in figure 3(e).
on the southern side of the Gulf Stream, and so will Slope Sea therefore occurs episodically. After 2009,
give the transport change across the Gulf Stream due the LSLW shows a gradual salinification up until
to the changes at station 7. The result of this calcu- 2013–2014, indicating a slowly reducing input of the
lation, integrated upwards from 2000 m, figure 3(d), fresher waters from the northeast. Also, in most of the
shows that this contributes an increase of 1.3 Sv in occupations, the freshest LSLW occurs intermittently
Gulf Stream transport (i.e the change above 600 m), across the North-West Recirculation Gyre, as already
nearly half of the AMOC change reported by Smeed noted for May 2008.
et al (2018) at 26◦ N. While the role of the DWBC Figure 4(a) shows the mean density structure for
waters cannot be entirely discounted, note that the the AMOC high and low periods. The downward
transport change below 600 m is relatively small. slope of the isopycnals between 38.5 and 36.5◦ N
Figure 3(e) shows the salinity on the 27.55 kg m−3 shows the Gulf Stream core, and the LSLW layer
isopycnal for every occupation in our time window. is shown shaded, together with the locations of the
The LSLW is generally fresher north of the Gulf freshest occurrences in May 2008. The LSLW layer
Stream core (near 37.7◦ N, figure 4), and is freshest descends from 400 to 600 m on the northern side
nearest the shelf (39–40◦ N). There is also a strik- of the Gulf Stream, to 1000–1200 m on its southern
ing change from 2008, between fresher varieties dur- side. It is always thickest near the slope and decreases
ing the AMOC high period and more saline variet- in thickness to 38◦ N, after which it does not vary
ies during the AMOC low. During the AMOC high greatly, figure 4(b). At station 7, the LSLW increases
there are actually two shorter periods of particu- from 220 m thickness at AMOC low, to 250 m at
larly fresh LSLW, with a more saline variety around AMOC high, and this forces all the lighter isopycnals
2006. The influx of the freshest LSLW to the Western to shallow similarly (figures 4(a) and 3(c)). During
6Environ. Res. Lett. 16 (2021) 084019 A L New et al
Figure 5. NEMO ocean model 5 d means centred on January 23 in year 2 of the integration ((a) to (d)). (a) Salinity (colour) and
currents (arrows, shown every third gridpoint, 1 m s−1 scale arrow at top right) at 565 m northeast of Cape Hatteras. The black
dashed line is drawn at 71◦ W. (b) Salinity at 71◦ W, also showing the 27.55 kg m−3 density contour (white dashed line).
(c) Salinity over a larger area than in (a) and averaged over the 27.5–27.6 kg m−3 layer, also showing the position at which the
average layer depth is at 700 m (white dashed line, taken as the Gulf Stream core here), and multiple ejection events 1–4. Note that
event 2 leaves the slope near 67◦ W and moves north-eastwards. The black dashed box is the area shown in (a). (d) Similar to
(c) but showing full potential vorticity in PV units (PVU) where 1 PVU = 10−7 kg m−4 s−1 . (e) and (f) are similar to (c) and
(d) respectively, but show the salinity and potential vorticity centred on January 23 in year 33 of the integration, and as averages
over the 27.4–27.5 kg m−3 layer, with the white lines indicating the position at which the average layer depth is at 500 m. Note
that multiple ejection events 1–4 are again shown in (e) and that a uniform value of 0.5 PVU was subtracted from the PV field in
(f). The white areas north of the Grand Banks in panels (c) to (f) result from the isopycnal layer in question outcropping at the
sea surface.
the AMOC high, the LSLW is also markedly fresher thicker between 39 and 40◦ N than the mean of the
from the slope to 38.5◦ N, with diminishing effect AMOC high period. This correlation is investigated
across the gyre, figure 4(c). This, together with the further in the supplementary material.
decreasing thickness across the gyre, is indicative (in
the mean) of a source of thick and fresh LSLW on the 5. Ejection of filaments
upper slopes, and spreading across the entire Slope
Sea. A plausible explanation for this and the intermit- In the NEMO simulation, the LSLW, present in the
tency of the LSLW in individual occupations is LSLW initial state, flows southwestwards along the slope
filaments being drawn out of the boundary current towards Cape Hatteras and quickly forms filaments
by Gulf Stream meanders or eddies and then mixed which are pulled out into the Slope Sea. Figure 5(a)
isopycnally within the gyre. shows one such event in the Western Slope Sea at
Figures 4(d) and (e) are similar to figures 4(b) and the start of the second year of integration at 565 m.
(c) but now show averages over three fresh full-length An extrusion has formed between 73 and 69◦ W near
occupations in the AMOC high period, and three full- 38.5◦ N (see the black shades) through interaction
length saline occupations in the AMOC low (see the with a Gulf Stream meander which has an eastward
blue and red circles, respectively, in figure 3(e)). The flow. Figure 5(b) at 71◦ W shows that the filament
effects previously described are increased dramatic- extends deeply to 1000 m as it meets the Gulf Stream
ally with the fresh sections being markedly fresher and core at 38.5◦ N. The two are interacting strongly, with
7Environ. Res. Lett. 16 (2021) 084019 A L New et al
the filament providing fresh and dense water into the shelf slopes in the Slope Sea, but with a core on a
system, and being associated with the steep rise in the slightly lighter density surface, 27.45 kg m−3 rather
27.55 kg m−3 isopycnal. The similarity with the irreg- than 27.55 kg−3 , so that figures 5(e) and (f) are rep-
ular occurrences of the LSLW at Line W suggests these resentative of this change. The LSLW still appears as a
filaments are a plausible mechanism to explain the low salinity, low PV boundary current extending to,
observations. and retroflecting at, Cape Hatteras, and filaments of
In the supplementary material, a sequence of the LSLW, comprising this low salinity, low PV water,
events centred on that shown in figure 5(a) is are still apparent (marked as 1–4) being drawn out
examined. There we see how ‘upward/downward’ from the boundary current, though perhaps margin-
dipoles are co-located with northward/southward (or ally less well pronounced than in year 2. This may be
‘coldward/warmward’) motion in the meanders, as because the Gulf Stream meanders (indicated by the
highlighted in previous studies with simpler mod- white dashed lines) are further from the slopes at this
els (e.g. Gill 1982, Flierl and Davis 1993). An ideal- time. We also remark that while a full investigation is
ised model is also described which suggests that beyond the scope of the present study, a comparison
these dipoles are solidly rooted in quasi-geostrophic of these two snapshots does show fresher and thicker
dynamics. The ejection event here is thus interpreted (lower PV) LSLW in the Western Slope Sea when the
as the southeastward and downward entrainment of a AMOC is higher (especially noting that a uniform
fresh slope-origin water mass in the ‘warmward’ sec- value of 0.5 PVU has been subtracted in panel (f)),
tor of a Gulf Stream meander. The deep extent of this in agreement with the observational results above.
motion is striking, with the filament descending (see
figure S3(b)) into and under the Gulf Stream, reflect-
ing the similar occurrence at Line W in figure 4(a). 6. Summary and discussion
Figure 5(c) presents salinity on the LSLW dens-
ity surface (averaged over the 27.5–27.6 kg m−3 layer) LSLW (of densities 27.4–27.65 kg m−3 ) has its ori-
over a wider area. The LC is the fresh boundary gins on the Labrador shelf in the subarctic, and in the
current extending around the TGB, and providing Slope Sea is an intermediate depth water mass above
the source for the LSLW as it continues through the the LSW. We have shown that the LSLW penetrates
entire Slope Sea (with generally increasing salinity). deeply into the Western Slope Sea as a boundary cur-
We identify four concurrent ejection events, all trans- rent where it is characterised by a salinity minimum
porting fresh LSLW away from the slope, and caused between 400 and 600 m on the slopes, and where it
by interaction of Gulf Stream meanders or eddies with interacts strongly with the Gulf Stream. The LSLW
the boundary current as in figure 5(a) (which is event is relatively thick and fresh during the recent AMOC
number 1 here). These extrusions reduce the salin- high period (2003–08), compared with the following
ity of the entire Slope Sea as far as the Gulf Stream AMOC low period (2009–14). This thickening lifts up
(dashed white line). Figure 5(d) shows the full poten- the isopycnals in the upper 600 m on the slope, and
tial vorticity (PV) for this layer. (PV is essentially increases the density gradient across the Gulf Stream,
inverse layer thickness, modified by the inclusion of contributing an additional 1.3 Sv to its transport. The
all the relative vorticity terms relevant in NEMO, see LSLW is also drawn out from the boundary current
White et al 2005, and in the absence of mixing this in extrusions, caused by Gulf Stream meanders or
is conserved following the circulation). The LSLW on eddies, bringing fresher and lower PV water to the
the slope is a region of generally low PV (being some- whole Slope Sea in this density layer.
what thicker here) and the extrusions carry this low Our study has focussed on the impacts of the
PV water into the interior of the Slope Sea, acting to LSLW in the Western Slope Sea. However, it is clear
reduce the PV there, as well as its salinity. The region that periods of thicker LSLW propagate along the
of low PV on the western side of the TGB could indic- shelf-slope and must first transit the Eastern Slope
ate a possible source of the LSLW in the Slope Sea Sea. Given that there is no additional source of the
(through mixing either with topography, or with Gulf LSLW along this pathway, we would expect the impact
Stream eddies which in NEMO propagate northwest- of the LSLW on the Gulf Stream transport and AMOC
wards here, as indicated in figure 1). A further low PV here to be just as large as in the Western Slope Sea,
region penetrates to Cape Hatteras and retroflects to and possibly even larger given that the continued mix-
the northeast, possibly affecting Gulf Stream separa- ing away from the boundary in the filaments as the
tion. These features require further investigation. LSLW travels southwestwards would tend to lessen
To contrast model differences between AMOC the LSLW thickening with distance travelled, and
high and low states, figures 5(e) and (f) are similar to hence its impact on the AMOC. However, as there are
panels (c) and (d) but show the situation in January of no observations similar to Line W in the Eastern Slope
year 33 (the final year) of the integration rather than Sea, we are unable to investigate this aspect further
in year 2, when the AMOC (at 26.5◦ N) has reduced here.
from 13.2 Sv (in January of year 2) to 7.4 Sv. The It has long been known that the Gulf Stream
LSLW is still found as a salinity minimum on the position is affected by the (winter) NAO, the prin-
8Environ. Res. Lett. 16 (2021) 084019 A L New et al
cipal mode of atmospheric variability in the North western boundary, and then to subsequent changes
Atlantic) index, with a high NAO being associated in the northward ocean circulation and heat trans-
with a northerly position of the Gulf Stream, with a port, leading finally to changes in the Labrador Sea
lag of either 2 years (Taylor and Stephens 1998) or and a reversal of the cycle. In these studies, a positive
occurring simultaneously (Joyce et al 2000). In par- feedback was also often found to occur between the
ticular, the Icelandic Low component of the NAO NAO and the sea-surface temperatures in the sub-
is likely to have a dominant influence over the pos- polar gyre which amplified the mode. Depending on
ition of the Gulf Stream, in contrast to the Azores the model studied, cycles arose with timescales of
High, suggesting variability in the transport of waters between 10 and 50 years.
from the Labrador region into the Slope Sea provides We now address the question as to whether the
the important control over the Gulf Stream posi- LSLW could play a similar role in decadal cycling
tion (Sanchez-Franks et al 2016). The connection in the North Atlantic as outlined above for the
between the NAO and the Gulf Stream is apparent deeper LSW, remembering that observations do not
in figure 4, in that the Gulf Stream at Line W is fur- strongly support such a role for the LSW. Firstly, we
ther north during 2003–2008 than during 2009–2014 remark that we have established here a strong pres-
(the 26.6 kg m−3 isopycnal at 200 m, close to the ence of the LSLW throughout the Slope Sea. Secondly,
15 ◦ C isotherm, moving from 38.4 to 38.0◦ N between temperature-salinity analysis (Petrie and Drinkwater
these periods), together with the observation that the 1993) clearly shows that the LSLW derives its cold,
NAO is neutral during the former period and neg- fresh properties from the Labrador Current on the
ative during the latter (Robson et al 2018). We also Labrador and Newfoundland Shelves. There is there-
note in figure 4 the increased thickening between the fore a direct observational connection for the LSLW
density surfaces 26.2–26.6 kg m−3 between 34 and between these two regions (supported by the model
36.5◦ N during the AMOC high, implying lower PV results in figure 5).
in the Subtropical Mode Water when the Gulf Stream Peterson et al (2017) then suggest that a stronger
is further north. Although this is counter to the find- flow of LC water westwards from the TGB is caused
ing of Joyce et al (2000), their result describes the PV by a southward shift of the Zero Wind stress Curl
changes near Bermuda (33◦ N) and at 300 m depth. Line (ZWCL) near 40◦ W (and 40◦ N), whereas the
The realisation that the NAO and Gulf Stream Gulf Stream position is instead related to wind stress
position co-vary led Joyce et al (2000) to propose changes linked to the NAO further to the north-
a mechanism for decadal climate variability in the east. They also invoke such an enhanced LC inflow
North Atlantic. When the NAO is high, the winds to explain a cooling event in the upper 650 m on
in the subpolar gyre are strong, leading to enhanced the Nova Scotia shelf and slope between 2004 and
cooling and open ocean convection in the Labrador 2009, and relate this to a more southerly position
Sea. This produces an enhanced southward flow of the of the Shelf Slope Front rather than to any shift in
LSW which is entrained into the DWBC and trans- the Gulf Stream. Figure 6 shows that the Shelf Slope
ported along the slopes to the Gulf Stream separ- Front in our study, denoted by the offshore bound-
ation region. Here, the two currents interact, with ary of the fresh Coastal Water in the upper layer
the DWBC passing below the Gulf Stream, but with (with salinity below 35.4), is indeed further south-
the additional LSW pushing the Gulf Stream into a wards (and extends more deeply) when the LSLW is
more southerly position. This southward movement fresher between 2003 and 2008 than during 2009–14.
would, through changes in the sea-surface temperat- This both supports the conclusion of Peterson et al
ure and air-sea fluxes, then cause a reduction in the (2017), and shows that the Shelf Slope Front is further
NAO (as these are observed to co-vary), resulting in south at the same time as the LSLW is fresher. Indeed,
a lessening of LSW production and a reversal of the Peña-Molino and Joyce (2008) find that fresher and
cycle. This was shown by Joyce et al (2000) to lead to cooler water occur in phase, together with enhanced
cycles on the decadal timescale. south-westward flow, in the upper 1000–1500 m over
Other mechanisms affecting decadal variability the slopes at Line W during 2003–2006. We conclude
have been proposed which involve changes in the Gulf that enhanced inflows of LC water into the Slope Sea
Stream transport rather than its position. Robson et al would simultaneously feed both the Shelf Break Jet
(2014) proposed that increases in the LSW density and thereby enhanced volumes of Coastal Water spill-
would propagate along the western boundary and ing southwards into the Shelf Slope Front, and the
act to increase the east-west density gradient across LSLW, causing them both to experience cooling and
the Gulf Stream, increasing its transport and the freshening concurrently.
AMOC. The subsequent increased northward heat Similarly, Holliday et al (2020) propose a wind-
transport would warm the subpolar gyre, causing a stress induced alternation between freshening events
reduction of the LSW density and a reversal of the west of the TGB, and in the eastern North Atlantic,
cycle. Similarly, Menary et al (2015) described several depending on whether the LC is steered more
modelling studies which involved variations in the strongly to the southwest or to the east at the Grand
LSW leading to deep anomalies propagating along the Banks. They analyse wind stress patterns from the
9Environ. Res. Lett. 16 (2021) 084019 A L New et al
Figure 6. Mean salinity (plotted against depth in db) during the (a) AMOC high (blue) and (b) AMOC low (red) periods.
Continuous contours denote water from and fresher than 35.4, and dashed contours show water saltier than 35.4. The 35.4
contour is shown as the thick continuous line and the contour interval is 0.2. Data is plotted from 30 db as there is significant
seasonal variability above this depth which is not adequately resolved in the AMOC low period.
ERA-interim dataset, and show a switch from positive clear that the ZWCL has moved north between these
to negative wind stress curl in the Newfoundland shelf two regions, between 2010 and 2012, with a region
region (just north of the Grand Banks) from about of negative curl extending further northwards along
2012, associated with a northward shift of the ZWCL the Newfoundland shelf. From the above studies, this
here, leading to a greater transport of LC waters off would be expected to reduce or terminate the flow of
the shelf (due to enhanced Ekman transport) and into the fresh LC water into the Slope Sea between these
the northeast Atlantic. At the same time, there is cor- times.
respondingly less LC water flowing into the Slope Sea, Consistent with these ideas (since ocean currents
leading to an increased (upper layer) salinity there. tend to follow the ZWCL line e.g. Marshall et al 2001),
The key aspect in both Peterson et al (2017) and Gonçalves Neto et al (2021) find north-south shifts of
Holliday et al (2020) therefore seems to be whether the Gulf Stream near the TGB between 2008 and 2010,
the ZWCL is northwards or southwards of the Grand with a final northward shift occurring by 2011–2012,
Banks region. We examine this further in figure 7. and that such northward shifts are accompanied by
Figure 7(a) shows the mean wind stress curl between warming on the Scotian Shelf and Slope about a year
1982 and 2020 in the ERA5 dataset, with a gener- later. They argue that the northward shift of the Gulf
ally positive region in the subpolar gyre (north of Stream acts to reduce the inflow of the LC waters into
about 48◦ N), and a negative region further south. the Slope Sea, so causing the observed warming. They
Figure 7(b) then shows wind stress curl time-series also show that the LSLW at the TGB becomes saltier
in two key regions near the Grand Banks, these being and warmer at about the same time. In addition, a
directly over the Flemish Pass (the channel between reduced inflow of the LSLW into the Slope Sea from
the Flemish Cap and the Grand Banks through which about 2010 is consistent with Andres et al (2020) who
the LC flows), and on the Newfoundland shelf just show that the North-West and Northern Recircula-
to the north. Between 2002 and 2010, the mean curl tion Gyres are stronger and better connected during
over the Newfoundland region is positive, but this 2004–08 than during 2010–14.
then reduces rapidly between 2010 and 2012, becom- In terms of propagation timescales, Peterson et al
ing negative between 2012 and 2018. In the Flem- (2017) obtain maximum correlations between the
ish Pass region, the wind curl is close to zero in the year-to-year changes in the Shelf Slope Front posi-
former period, and strongly negative in the latter. It is tion and the wind curl (near 40◦ W) using a lag of
10Environ. Res. Lett. 16 (2021) 084019 A L New et al
Figure 7. (a) Mean wind stress curl (N m−3 ) between 1982 and 2020 from the ERA5 dataset. Boxes for the Flemish Pass (green)
and Newfoundland Shelf (purple) regions are shown, and thin black lines indicate the positions of the +10 and −10 N m−3
contours. (b) Time series of wind stress curl (N m−3 ) as averages over the Flemish Pass (green) and Newfoundland Shelf (purple)
regions (to which a 6 year time filter has been applied).
8 months. This is consistent with the 4–6 month We therefore propose the LSLW transport as a
timescale found by Peña-Molino and Joyce (2008) for new mechanism for connecting changes on the Lab-
sea-surface temperature anomalies to propagate from rador and Newfoundland Shelves in the subarctic
60 to 75◦ W in the Slope Sea, and with an examina- with the Gulf Stream, and that such a connection
tion of the model in section 5, which shows that LSLW is favoured when the ZWCL near the Grand Banks
anomalies would take 9–12 months to travel from is sufficiently far southwards. This would allow an
the Newfoundland Shelf to the Gulf Stream separa- enhanced flow of the LC into the Slope Sea, leading
tion region. Furthermore, Gonçalves Neto et al (2021) to thicker and fresher LSLW, and an increased Gulf
found that the propagation of surface velocity anom- Stream transport and AMOC, about 10–12 months
alies from the TGB to 67◦ W takes about 10 months. later. Further analysis of our model results also shows
Finally, we remark that the expected reduction the Gulf Stream being pushed southwards into a
or termination of the flow of the fresh LC water good separation position just eastwards of Cape Hat-
into the Slope Sea from about 2010–2012 and the teras when sufficient quantities of the LSLW reach
likely timescale of 10–12 months for changes to this point. The increased flows of the LSLW could
propagate between the Newfoundland Shelf and therefore result in either or both an increased Gulf
the Slope Sea, are completely consistent with the Stream transport or a more southerly Gulf Stream
freshest LSLW at Line W (figure 3) occurring between position, and thereby take part in mechanisms sim-
2003 and 2009, with the subsequent gradual salini- ilar to those proposed by either Joyce et al (2000),
fication between 2010 and 2012, and with the Robson et al (2014) or Menary et al (2015), but
most saline varieties occurring in 2013–2014 (indic- which rely instead on the deeper LSW. A full invest-
ating a possible cessation of the LSLW inflows igation of these ideas will be undertaken as a sep-
then). arate study in a very high-resolution climate model
11Environ. Res. Lett. 16 (2021) 084019 A L New et al
with an ocean resolution similar to that used here A T Blaker https://orcid.org/0000-0001-5454-
(7.5 km), capable of resolving the processes involved 0131
(the models in the studies above using ocean resol- J V Mecking https://orcid.org/0000-0002-1834-
utions of at best 25 km, insufficient to resolve such 1845
processes). J P Mathews https://orcid.org/0000-0003-1853-
In summary, the LSLW, deriving its properties 2147
from the Labrador Current, itself influenced by flows A Sanchez-Franks https://orcid.org/0000-0002-
from the Arctic through the Davis Strait, could there- 4831-5461
fore provide a new and alternative pathway (suppor-
ted by observations) for connecting the subarctic with
the Gulf Stream, and offer a potential new mechanism
for decadal variability. It is now more important than References
ever to better understand such pathways and mech-
Andres M K, Donohue A and Toole J M 2020 The Gulf Stream’s
anisms, since enhanced future outflows of freshwater path and time-averaged velocity structure and transport at
from the Arctic (particularly through the Canadian 68.5˚W and 70.3˚W Deep-Sea Res. I 156 103179
Arctic Archipelago into the Davis Strait) are likely to Antonov J I, Locarnini R A, Boyer T P, Mishonov A V and
Garcia H E 2006 World Ocean Atlas 2005, Volume 2: Salinity
further freshen the Labrador Current and reduce the
ed S Levitus (Washington, DC: NOAA Atlas NESDIS, U.S.
AMOC (Gervais et al 2018). Government Printing Office) p 182
Bower A S, Lozier M S, Gary S F and Böning C W 2009 Interior
pathways of the North Atlantic meridional overturning
Data availability statement circulation Nature 459 243–7
Bower A, Lozier S and Gary S 2011 Export of Labrador Sea Water
The data that support the findings of this study are from the subpolar North Atlantic: a Lagrangian perspective
openly available at the following URL/DOI: https:// Deep-Sea Res. II 58 1798–818
Brodeau L, Barnier B, Treguier A M, Penduff T and Gulev S 2010
scienceweb.whoi.edu/linew/index.php.
An ERA40-based atmospheric forcing for global ocean
circulation models Ocean. Modell. 31 88–104
Claret M, Galbraith E D, Palter J B, Bianchi D, Fennel K, Gilbert D
Acknowledgments and Dunne J P 2018 Rapid coastal deoxygenation due to
ocean circulation shift in the northwest Atlantic Nat. Clim.
This research was supported by the UK Nat- Change 8 868–72
Csanady G T and Hamilton P 1988 Circulation of slopewater
ural Environment Research Council ACSIS (Grant
Cont. Shelf Res. 8 565–624
NE/N018044/1) and RAPID-AMOC programmes, Flagg C N, Dunn M, Wang D P, Rossby H T and Benway R L 2006
and by the European Union’s Horizon 2020 research A study of the currents of the outer shelf and upper slope
and innovation programme COMFORT (Grant from a decade of shipboard ADCP observations in the
Middle Atlantic Bight J. Geophys. Res. 111 C06003
Agreement No. 820989). The EN4.2.1 dataset
Flierl G and Davis C 1993 Biological effects of Gulf Stream
is available from www.metoffice.gov.uk/hadobs/ meandering J. Mar. Res. 51 529–60
en4/, the Line W observations from https:// Florindo-López C, Bacon S, Aksenov Y, Chafik L, Colbourne E
scienceweb.whoi.edu/linew/index.php, and the ERA5 and Holliday N P 2020 Arctic ocean and hudson bay
freshwater exports: new estimates from seven decades of
dataset from https://cds.climate.copernicus.eu/
hydrographic surveys on the labrador shelf J. Clim.
cdsapp#!/dataset/reanalysis-era5-single-levels-mont 33 8849–68
hly-means? The NEMO model output is available Fratantoni P S and Pickart R S 2007 The Western North atlantic
from the authors upon reasonable request. We also shelfbreak current system in summer J. Phys. Oceanogr.
37 2509–33
thank Bablu Sinha and two anonymous reviewers
Gary S F, Lozier M S, Böning C W and Biastoch A 2011
for helpful discussions and comments on the manu- Deciphering the pathways for the deep limb of the
script, and Tess, Hatty and Karen for their support meridional overturning circulation Deep-Sea Res. II
during the preparation of this work. 58 1781–97
Gatien M G 1976 A study in the slope water region south of
halifax J. Fish. Board Can. 33 2213–7
Disclaimer Gervais M, Shaman J and Kushnir Y 2018 Mechanisms governing
the development of the north atlantic warming hole in the
This work reflects only the authors’ views. The CESM-LE future climate simulations J. Clim. 31 5927–46
Gill A E 1982 Atmosphere-Ocean Dynamics (New York: Academic)
European Commission and their executive agency are
p 662
not responsible for any use that may be made of the Gonçalves Neto A, Langan J A and Palter J B 2021 Changes in the
information this work contains. Gulf Stream preceded rapid warming of the Northwest
Atlantic Shelf Commun. Earth Environ. 2 74
Good S A, Martin M J and Rayner N A 2013 EN4: quality
ORCID iDs controlled ocean temperature and salinity profiles and
monthly objective analyses with uncertainty estimates J.
A L New https://orcid.org/0000-0002-3159-8872 Geophys. Res. Oceans 118 6704–16
Hersbach H et al 2019 ERA5 monthly averaged data on single
D A Smeed https://orcid.org/0000-0003-1740-
levels from 1979 to present Copernicus Climate Change
1778 Service (C3S) Climate Data Store (CDS) (https://doi.org/
A Czaja https://orcid.org/0000-0003-3645-0284 10.24381/cds.f17050d7)
12Environ. Res. Lett. 16 (2021) 084019 A L New et al
Hogg N G, Pickart R S, Hendry R M and Smethie W J 1986 The Robson J et al 2018 Recent multivariate changes in the North
northern recirculation gyre of the Gulf Stream Deep-Sea Res. Atlantic climate system, with a focus on 2005–2016 Int. J.
I 33 1139–65 Climatol. 38 5050–76
Holliday N P et al 2020 Ocean circulation causes the largest Robson J, Hodson D, Hawkins E and Sutton R 2014 Atlantic
freshening event for 120 years in eastern subpolar North overturning in decline? Nat. Geosci. 7 2–3
Atlantic Nat. Commun. 11 585 Rossby T 1999 On gyre interactions Deep-Sea Res. II 46 139–64
Joyce T M, Deser C and Spall M A 2000 The relation between Saba V S et al 2016 Enhanced warming of the Northwest Atlantic
decadal variability of subtropical mode water and the North Ocean under climate change J. Geophys. Res. Oceans
Atlantic Oscillation J. Clim. 13 2550–69 121 118–32
Joyce T M, Dunworth-Baker J, Pickart R S, Torres D and Sanchez-Franks A, Hameed S and Wilson R E 2016 The Icelandic
Waterman S 2005 On the Deep Western Boundary Current Low as a predictor of the Gulf stream north wall position J.
south of cape cod Deep-Sea Res. II 52 615–25 Phys. Oceanogr. 46 817–26
Levitus S 1982 Climatological atlas of the world ocean NOAA/ERL Sanchez-Franks A and Zhang R 2015 Impact of the Atlantic
GFDL, Professional Paper 13 (Princeton, NJ) p 173 (NTIS meridional overturning circulation on the decadal
PB83-184093) variability of the Gulf Stream path and regional chlorophyll
Locarnini R A, Mishonov A V, Antonov J I, Boyer T P and and nutrient concentrations Geophys. Res. Lett. 42 9889–97
Garcia H E 2006 World Ocean Atlas 2005, Volume 1: Smeed D A et al 2018 The North Atlantic Ocean is in a state of
Temperature ed S Levitus (Washington, DC: NOAA Atlas reduced overturning Geophys. Res. Lett. 45 1527–33
NESDIS 61, U.S. Government Printing Office) p 182 Smith J N, Smethie W M Jr, Yashayev I, Curry R and
Lozier M S, McCartney M S and Owens W B 1994 Anomalous Azetsu-Scott K 2016 Time series measurements of transient
anomalies in averaged hydrographic data J. Phys. Oceanogr. tracers and tracer-derived transport in the deep western
24 2624–38 boundary current between the labrador sea and the
Madec G 2008 NEMO ocean engine Note du Pole de modelisation subtropical atlantic ocean at line W J. Geophys. Res. Oceans
27 (Institut Pierre-Simon Laplace) p 209 121 8115–38
Marsh R 2000 Modelling changes in North Atlantic circulation Talley L D and McCartney M S 1982 Distribution and
under the NAO-minimum wind forcing of 1877–81 Atmos. circulation of Labrador Sea Water J. Phys. Oceanogr.
Ocean 38 367–93 12 1189–205
Marshall J, Johnson H and Goodman J 2001 A study of the Taylor A H and Stephens J A 1998 The North Atlantic Oscillation
interaction of the North Atlantic Oscillation with ocean and the latitude of the Gulf Stream Tellus 50A 134–42
circulation J. Clim. 14 1399–421 Thibodeau B et al 2018 Last century warming over the Canadian
Marzocchi A, Hirschi J J M, Holliday N P, Cunningham S A, Atlantic shelves linked to weak Atlantic meridional
Blaker A T and Coward A C 2015 The North Atlantic overturning circulation Geophys. Res. Lett. 45 376–85
subpolar circulation in an eddy-resolving global ocean Toole J M, Curry R G, Joyce T M, McCartney M and
model J. Mar. Sys. 142 126–43 Peña-Molino B 2011 Transport of the North Atlantic deep
McCartney M S and Talley L D 1982 The subpolar mode water of western boundary current about 39◦ N, 70◦ W: 2004–2008
the North Atlantic ocean J. Phys. Oceanogr. 12 1169–88 Deep-Sea Res. II 58 1768–80
Menary M B, Hodson D L R, Robson J I, Sutton R T and Townsend D W, Pettigrew N R, Thomas M A, Neary M G,
Wood R A 2015 A mechanism of internal decadal atlantic McGillicuddy D J Jr. and O’Donnell J 2015 Water masses
ocean variability in a high-resolution coupled climate model and nutrient sources to the Gulf of Maine J. Mar. Res.
J. Clim. 28 7764–85 73 93–122
Mountain D G 2012 Labrador slope water entering the gulf of U.S. Department of Commerce 2006 U.S. department of
maine—response to the North Atlantic Oscillation Cont. commerce, national oceanic and atmospheric
Shelf Res. 47 150–5 administration, national geophysical data center: 2-minute
Peña-Molino B and Joyce T M 2008 Variability in the slope water gridded global relief data (ETOPO2v2) (available at:
and its relation to the Gulf Stream path Geophys. Res. Lett. www.ngdc.noaa.gov/mgg/global/etopo2.html) (Accessed 10
35 L03606 January 2013)
Peña-Molino B, Joyce T M and Toole J M 2011 Recent changes in Watts D R 1991 Equatorward currents in temperatures
the Labrador Sea Water within the Deep Western Boundary 1.8 ◦ C–6.0 ◦ C on the continental slope in the mid-atlantic
Current southeast of cape cod Deep-Sea Res. I 58 1019–30 bight Deep Convection and Deep Water Formation in the
Peterson I, Greenan B, Gilbert D and Hebert D 2017 Variability Oceans ed P C Chu and J C Gascard (Amsterdam: Elsevier)
and wind forcing of ocean temperature and thermal fronts pp 183–96
in the Slope Water region of the Northwest Atlantic J. White A A, Hoskins B J, Roulstone I and Staniforth A 2005
Geophys. Res. Oceans 122 7325–43 Consistent approximate models of the global atmosphere:
Petrie B and Drinkwater K 1993 Temperature and salinity shallow, deep, hydrostatic, quasi-hydrostatic and
variability on the Scotian Shelf and in the Gulf of Maine non-hydrostatic Q. J. R. Meteorolog. Soc. 131 2081–107
1945–1990 J. Geophys. Res. Oceans 98 20079–89 Zhang R and Vallis G K 2007 The role of bottom vortex stretching
Richardson P L 1977 On the crossover between the Gulf Stream on the path of the North Atlantic western boundary current
and the western boundary undercurrent Deep-Sea Res. and on the northern recirculation gyre J. Phys. Oceanogr.
24 139–59 37 2053–80
13You can also read