ENVIRONMENTAL DECLARATION 2021 - Voestalpine

Page created by Ricardo Saunders
 
CONTINUE READING
ENVIRONMENTAL DECLARATION 2021 - Voestalpine
ENVIRONMENTAL
DECLARATION 2021

voestalpine Tubulars GmbH & Co KG
www.voestalpine.com/tubulars
ENVIRONMENTAL DECLARATION 2021 - Voestalpine
2                                           

    CONFIDENTIAL – FOR INTERNAL USE ONLY!
ENVIRONMENTAL DECLARATION 2021 - Voestalpine
ENVIRONMENTAL
    DECLARATION 2021
    voestalpine Tubulars GmbH & Co KG
    KINDBERG Site

    Environmental policy

    Environmental assessment of individual areas

    Ecological operating equation

    Key environmental indicators

    Life cycle analysis

    Accident statistics

    Environmental programme 2021/22

    Declaration of Validity of the Environmental Declaration

                                                              3
ENVIRONMENTAL DECLARATION 2021 - Voestalpine
ENVIRONMENTAL
DECLARATION 2021
voestalpine Tubulars

Simplified Environmental Declaration 2021 according to EMAS Regulation (Regulation 1221/2009 (EC) & Regulation
2017/1505 (EU) & Regulation 2018/2026 (EU)) of the Council on the voluntary participation by organisations in a
Community eco-management and audit scheme (EMAS).

NACE code:			24.20

Company register no.		           165400 k

EMAS site no.:			                AT-000208

ISO 14001 cert. no.:		           U1530048

GLN number:			                   9008390198421

Contact

Harald Kohlhofer, Dipl.-Ing.

Environmental Officer

Alpinestrasse 17, 8652 Kindberg, Austria

Telephone: +43/50304/23-366

Fax: +43/50304/63-346

E-mail: harald.kohlhofer@vatubulars.com

Website: www.voestalpine.com/tubulars                            AUDITED ENVIRONMENTAL
                                                                      MANAGEMENT

Kindberg, March 2021

4                                                                                                             
ENVIRONMENTAL DECLARATION 2021 - Voestalpine
CONTENTS

1   Management policy                                         6

2   Environmental assessment of
    individual areas                                          7
    2.1    General development of the business                 7
    2.2    Environmental performance of the company            8

3   Ecological operating equation                             14
    3.1    Materials and Energy Equation                      14
    3.2    Use of materials                                   15
    3.3    Waste                                              16
    3.4    Hazardous waste                                    17
    3.5    Water/Waste water                                  19
    3.6    Exhaust air                                        24
    3.7    Energy                                             27
    3.8    Transport                                          28
    3.9    Use of land                                        28
    3.10   Indirect environmental aspects                     29

4   Life cycle analysis                                       30

5   Key environmental indicators                              31

6   Accident statistics                                       36

7   Environmental programme 2021/22                           38

8   Legal compliance                                          41

9   General information                                       42

10 Declaration of Validity of the Environmental Declaration   43

                                                               5
ENVIRONMENTAL DECLARATION 2021 - Voestalpine
1 MANAGEMENT POLICY
Our company is committed to manufacturing high-quality seamless steel pipes and tubes and providing first-class
services that meet or exceed the expectations of our customers and comply with the applicable international
standards*. We achieve customer satisfaction through integrity and meeting our obligations, and in so doing,
help our customers to realise their ambitions.

We ensure the future success and sustainability of our business operations by the efficient use of resources,
target-focused continual improvement, protecting the environment and compliance with all applicable statutory
requirements – while always guaranteeing the highest safety standards for our employees.

We successfully achieve those goals by focussing on five key areas: quality, safety, environment, saving energy
and asset management.

Quality means the following for us:

» Faultless products and services
» Customer satisfaction through focusing on customers and meeting customer requirements
» Flexibility and order fulfilment

Health and safety mean the following for us:

» In technical terms: safe workplaces, working materials, tools and equipment, and suitable personal
  protective equipment
» In organisational terms: creating awareness, ongoing safety campaigns and training
» In terms of conduct: safe practices and setting examples at all levels
» Health promotion

Environmental protection means the following for us:

» Responsible and economical use of resources
» Minimising emissions and avoiding harmful effects on the environment
» Continual improvement of environmental performance

Energy management means the following for us:

» Increasing energy-efficiency – reducing energy costs
» Using renewable forms of energy
» Circular economy and sustainability

Asset management means the following for us:

» Minimising the cost of plant and equipment over its entire life cycle
» High levels of plant availability
» Highly qualified staff for the installation and maintenance of plant and equipment

We ensure the effectiveness of the management system through the excellent qualification levels, outstanding
personal responsibility and high commitment levels of all employees and by the provision of all necessary resources.

*ISO 9001, API Specification Q1, ISO 14001, ISO 45001, ISO 50001, ISO 55001

6                                                                                                MANAGEMENT POLICY
2 ENVIRONMENTAL ASSESSMENT OF
  INDIVIDUAL AREAS
2.1           General development of the business
Production volume:
    (t)

 500,000

 450,000                                                                                                      433,549       437,158                      431,029
                                                                                                    426,926
                                                                414,872                                           414,894                           413,087
                                                         398,318       400,616
                                                                                 395,110
 400,000

 350,000                                                                                    337,999
                                329,592                                                                                                                            325,768
                                                  310,995

 300,000                  284,500                                                                                                     288,955
                                            271,287
                                      255,846                                                                                               255,345
 250,000

                                                                                      209,890

 200,000      186,846                                                                                                                                                    185,476

 150,000            133,886

 100,000

   50,000

          0
              1998 1999 2000 2001 2002 2003 2004 2005 2006 2007 2008 2009 2010 2011 2012 2013 2014 2015 2016 2017 2018 2019 2020

Number of employees:

 1,400
                                                                                                                                                   1,306 1,314

                                                                                                                 1,207 1,222
 1,200                                                                                                                                     1,174
                                                                                                                                                                 1,129
                                                                                                   1,092 1,106                   1,103
                                                               1,050 1,050
                                                                             1,023         1,015
                                                       1,005
 1,000                         953

                        884                      890
                                                                                                                                                                         857
                                     823
                                           799
  800     774
                                                                                     756

                  646

  600

  400

  200

     0
          1998 1999 2000 2001 2002 2003 2004 2005 2006 2007 2008 2009 2010 2011 2012 2013 2014 2015 2016 2017 2018 2019 2020

People employed as at 31st December each year

Environmental assessment of individual areas                                                                                                                                       7
2.2    Environmental performance of the company
Environmental, energy and health & safety programme:

For the financial year 2020/21 (01/04/2020 to 31/03/2021), a common environmental, energy and health & safety
programme was defined in which 37 individual targets were defined for the areas of

» Materials/resources used
» Waste
» Exhaust air
» Waste water
» Energy
» Transport
» Legal compliance
» Safety
» Health

Achievement of individual targets from the 2019/20 programme (carried over)
Three targets were carried over from the 2019/20 programme, of which one has been completed and two have
not been implemented.

Implemented target:

» Optimisation of the furnace management systems in WBH 1 and WBH 2 by improving energy-efficiency and
  even operation of the furnaces – implemented (operating data incorporated in the furnace management
  systems)

Targets not implemented:

» Increasing safety by the purchase of a new stacker truck in Boiler Pipe Finishing – not implemented
  (investment cancelled due to economic situation)
» Definition and description of re-integration management relating to accidents and illness based on an
  analysis of the current situation – not implemented (implementation not possible due to the pandemic)

8                                                                     Environmental assessment of individual areas
Achievement of individual targets from the 2020/21 programme
Of the 37 environmental, energy and health & safety targets for the FY 2020/21, 28 were achieved on time, which
equates to an achievement rate of 76%.

Number
40
                                                                                          37

35

30
                                                                                                                 28

25

                                                                 21
20

                                        15
15

10

                                                                                                                                                                         5
 5
                                                                                                                                             3
                 1                                                                                                                                                                                   1
 0
     Management system targets   Environmental/energy   Health & safety targets    Individual targets      Individual targets   Targets still in process of   Target figure not achieved   Targets not implemented
           2020/2021              targets 2020/2021           2020/2021           2020/2021 in total    implemented 2020/2021       implementation                                               2020/2021

Three targets have been carried over to the 2021/22 programme with new achievement deadlines:

» Effective securing of plant and equipment against unintentional restarting by providing the plants/
  employees concerned with suitable LOTO devices as per demand evaluation – ongoing project
» Proper use of fall arrester/safety harness PPE by provision of practical training for technicians and
  production staff on the subject of safe working at heights (as per demand evaluation) by SFK – ongoing
  project (implementation not possible due to pandemic)
» Implementation of AUVAfit programme action plan  by analysing results of the AUVAfit programme for
  developing and implementing measures – not implemented (implementation not possible due to pandemic)

One target was not implemented:

» Avoiding skin burns caused by contact with hot handrail in the hollow billet (LUP) recirculation area and/
  or the stairs to the reeler (LWW) by installing a water-cooling system for the handrail in the hollow billet
  recirculation area and the stairs to the reeler – not implemented (implementation not possible due to cost
  savings in the A&B programme)

Environmental assessment of individual areas                                                                                                                                                                         9
There were 5 targets for which the figure aimed at was not achieved:

» Lowering the ENPI energy performance index by 0.95% by reducing the no-load losses and the speed of
  motors and reducing the temperature in the reheating furnace (NWO) by means of normalisation rolling –
  target figure not achieved (discontinuous mode of operation causes higher specific energy consumption
  levels)
» Lowering the base load energy component of 2,100kW by 100kW by implementing various energy-saving
  measures in all areas of operation – target figure not achieved (implementation not possible due to lack of
  human and financial resources as a consequence of the economic situation)
» Savings of 1,665,000kWh pa in the area of process water and compressed air supply – which equates to
  an annual cost saving of approx. 83,000 euros – by lowering the process water and compressed air supply
  pressure levels on the weekends when there is no production and progressive leakage elimination in the
  plants – target figure of minus 25% not achieved (actual figure: 20% reduction)
» Lowering the accident rate in CY 2020 to < 6.0% in the area of the seamless tube rolling mill by
  implementing targeted measures for raising staff awareness – target figure not achieved (accident rate in
  seamless tube rolling mill in 2020 was 8.20)
» Maintaining 80% satisfaction with implemented HSM measures through quality and number of measures
  (based on HSM survey) – target figure not achieved (as a result of the pandemic, only 21 measures could be
  implemented – HSM survey was not carried out in 2020)

Individual targets FY 2020/21 according to area:
Materials/resources used

Two individual targets were defined for the area “materials/resources used” and achieved on time.

» Substitution of the solvent-based corrosion-proof coating by UV coating (Ford axles) by modifying the UV
  coating according to customer requirements and thereby reducing the use of solvents and solvent emissions
  – implemented (change-over to tube passivation – solvent-based coating therefore no longer necessary)
» Increasing awareness of the need for careful use of resources by introducing annual training for all sales
  staff by the Sales Department IMS coordinator – implemented (Webex training of sales staff completed)

Waste

In the area of waste, one individual target was defined and implemented on time.

» Increasing effectiveness in the collection of waste and waste logistics by producing a location plan detailing
  all waste collection points on the site – implemented (location plan showing all waste collection points on
  the site produced and sent to waste disposal provider)

Exhaust air

In the area of exhaust air, two individual targets were defined and implemented on time.

» Improving the effectiveness of the existing air extraction and the lighting for the socket grinding station by
  converting the air extraction system and installing new light units – implemented (air extraction and lighting
  optimised)
» Improving the air quality in the socket forming shop by investigating optimisation potential of the Absolent
  extractors and implementing appropriate improvement measures – implemented (integration of flow
  restrictor valves and replacement of HEPA filter stages)

10                                                                     Environmental assessment of individual areas
Waste water

In the area of waste water, one individual target was defined and implemented on time.

» Guaranteed compliance with the limit for nitrite level in the waste water from the neutralisation plant
  by adapting the waste water treatment process – implemented (compliance with nitrite content limit
  guaranteed by addition of sodium hyperchloride)

Energy

In the area of energy, seven individual targets were defined, four of which were implemented on time. The figure
aimed at was not achieved in the case of three of the targets.

» Reduction of natural gas consumption in the case of normalisation-rolled tubes in the reheating furnace
  by reducing the stretch reducing mill (SRW) outfeed temperatures to prevent baked-on scale on the
  normalisation rolling furnace (NWO) walking beams – implemented (outfeed temperatures reduced in the
  stretch reducing mill (SRW))
» Increasing the proportion of natural light in work areas by the Linsinger and HEID machines in the socket
  forming shop by installation of several dome skylights in the roof of the socket forming shop – implemented
  (installation of 10 dome skylights in the production shed roof)
» Lowering the ENPI energy performance index by 0.95% by reducing the no-load losses and the speed of
  motors and reducing the temperature in the reheating furnace by means of normalisation rolling – target
  figure not achieved (discontinuous mode of operation causes higher specific energy consumption levels)
» Clear presentation of energy-related key indicators and data by development of an energy dashboard
  showing energy consumption and energy performance indicators – implemented (implementation of an
  energy dashboard completed)
» Presentation of no-load energy data to support the cost-reduction programmes by introducing the new
  key indicator “EEE” for hot tube production at transformer level – implemented (presentation in the form of
  value-adding energy consumption)
» Lowering the base load energy component of 2,100kW by 100kW by implementing various energy-saving
  measures in all areas of operation – target figure not achieved (implementation not possible due to lack of
  human and financial resources as a consequence of the economic situation)
» Savings of 1,665,000kWh pa in the area of process water and compressed air supply – which equates to
  an annual cost saving of approx. 83,000 euros – by lowering the process water and compressed air supply
  pressure levels on the weekends when there is no production and progressive leakage elimination in the
  plants – target figure of minus 25% not achieved (actual figure: 20% reduction)

Transport

Two individual targets were defined and implemented on time in the area of transport.

» Energy and cost saving by reducing individual transportation by 20%, reduced rail link usage and less
  shunting activity by change-over to double-headed trains between Donauwitz and Kindberg, which can
  carry substantially larger quantities – implemented (basic condition for double heading with RCA created)
» Creation of new possibilities for transporting pipes/tubes to Russia, Kazakhstan and Uzbekistan to improve
  costs, quality and environmental impact  Reduction of the number of trains by 10% by using DB Cargo
  for pipe/tube transportation  Inclusion of pipes/tubes in container trains in relation Germany - China
   Loading of pipes/tubes into 45ft OT containers – implemented (basic conditions created – practical
  implementation not possible due to lack of orders)

Environmental assessment of individual areas                                                                    11
Legal compliance

In the area of legal compliance, one individual target was defined and implemented on time.

» Improvement of level of knowledge regarding legal changes by means of quarterly bulletin on legal
  changes to all plant managers and IMS coordinators – implemented (twice-yearly legal bulletin for executive
  management, plant managers and IMS coordinators)

Safety

In the area of occupational health and safety, 19 targets were defined, of which 15 were implemented on time.
Two targets are targets carried over to FY 2020/21. There was one target for which the figure aimed at was not
achieved. One target was not implemented because the project was removed from the A&B programme for
financial reasons.

» Lowering the LTIFR accident rate indicator (Group benchmark) to
» Prevention of accidents in the course of work when loading and unloading railway wagons and HGV trailers
  with socket feedstock tubes (MVR) by replacing the worn-out wooden supports on the three MVR wagons
  and integration of higher wooden beams for supporting the socket feedstock tubes between the posts and
  acquisition of platform steps for safe access to the MVR loadspace floors – implemented (installation of new
  platform steps)
» Safety-related modification of the gas supply points (oxy-acetylene) in the central workshop by
  implementing the measures as per explosion safety document – implemented (across-the-board
  implementation of the measures at the gas supply points)
» Exclusive use of certified, correctly dimensioned and tested load lifting accessories by enquiring with and
  contracting external companies to produce suitable load lifting accessories – implemented (verified by
  certified inspectorate)
» Factory-wide recording and identification of gas/air-mixture welding equipment including SAP assignment
  by recording of welding equipment (plant, site, number, SAP assignment), engraving and attachment of
  identification plates and entry of a check-list in the maintenance schedule (SAP) – implemented (all welding
  equipment uniquely identified by engraved plaque)
» Effective securing of plant and equipment against unintentional restarting by providing the plants/
  employees concerned with suitable LOTO devices as per demand evaluation – ongoing project – carried
  over to FY 2021/22
» Provision of regular instruction via the new e-learning system by digitisation of the existing instruction
  content for regular instruction of staff and provision as e-learning modules – implemented (e-Matrix
  e-learning system with 3 modules has been implemented – continual expansion of the system)
» Proper use of fall arrester / safety harness PPE by provision of practical training for technicians and
  production staff on the subject of safe working at heights (as per demand evaluation) by SFK – ongoing
  project (implementation not possible due to pandemic)

Health

In the area of health promotion, two individual targets were defined, neither of which were implemented on time.
One target is a target carried over to FY 2021/22.

» Maintain 80% satisfaction with implemented HSM measures through quality and number of measures
  (based on HSM survey) – target figure not achieved (as a result of the pandemic, only 21 measures could be
  implemented – HSM survey was not carried out in 2020)
» Implementation of AUVAfit programme action plan  by analysing results of the AUVAfit programme for
  developing and implementing measures – not implemented (implementation not possible due to pandemic)

Environmental assessment of individual areas                                                                    13
3 ECOLOGICAL OPERATING EQUATION
3.1         Materials and Energy Equation

                                               Materials and Energy Equation 2020
                                      Input:                                                    Output:

 Current assets (usage in t)                       208,949.773    Products and packaging (t)                         186,121.843

 Raw materials                                     207,814.000    Products                                           185,475.880

 Operating supplies and consumables                    489.810    Product packaging                                     645.963

                                                                  Waste, reusable materials and used materials (t)    39,931.534

 Packaging for products                                645.963    Used materials                                          65.280

                                                                  Reusable materials                                  32,426.774

 Gas (input in m³)                                                Non-hazardous waste                                   344.350

 Process gas/calibration gas                       744,883.005    Non-hazardous waste (special projects)*)             5,994.120

                                                                  Hazardous waste                                      1,101.010

 Water (input in m³)                                 2,508,012    Waste water (output in m³)                           2,091,500

 Drinking and sanitary water                            21,381    Sanitary waste water (indirectly discharged)            18,920

 Process water from wells                             2,486,631   Process waste water (indirectly discharged)               115

                                                                  Process waste water (directly discharged)            2,072,465

 Compressed air (generated in m³)                                 Exhaust air (emission in t)                         42,961.798

 Compressed air                                     32,353,196    Total gaseous emissions                             42,943.530
                                                                    of which CO2: 42,930.944
                                                                    Remainder (CO, NOx, SO2, Ctot, CxHy): 12.586

                                                                  Dust                                                     4.072

                                                                  Solvent emissions                                       14.196

 Energy purchased                                                 Energy consumed (MWh)                              284,125.554

 Electricity (MWhel)                                46,813.276    Energy converted (electricity)                      46,813.276

 Natural gas (m³)                                20,868,215.472   Heating energy (natural gas)                       236,436.881

 Petrol (litres)                                       305.000    Propulsion energy (petrol)                               2.596

 Diesel (litres)                                    88,055.000    Propulsion energy (diesel)                            872.801

*) Special projects (building projects)

14                                                                                                 ECOLOGICAL OPERATING EQUATION
3.2        Use of materials
Raw material quantity used:         207,814.00kg (steel billets)

                                                 Consumables used
Description of input material                                                     Quantity in kg

Oils                                                                                 125,582.57

» Hydraulic fluid                                                    89,232.80

» Transmission fluid                                                 34,390.33

» Compressor oil                                                      1,087.12

» Engine oil                                                            731.00

» Miscellaneous oils                                                    141.32

Lubricants                                                                           138,378.07

» Grease                                                             33,403.07

» Thread grease                                                      41,435.00

» Mandrel lubricant                                                  63,540.00

Paints and coatings                                                                   85,155.67

» Marking ink, enamel paint, etc.                                    25,893.83

» Corrosion-proof coating                                             1,800.00

» UV coating                                                         57,160.00

» Marking ink                                                           301.84

Solvents                                                                              12,378.71

Solvents without VOC content                                                           1,120.00

Oil binding agent                                                                      3,200.00

Corrosion inhibitor/rust solvent                                                      17,069.09

Metal machining fluid                                                                 18,723.50

Cutting fluid                                                                          6,811.00

Cleaning agents                                                                       13,723.29

Sealants/adhesives/slip agents                                                         3,373.88

Welding release agents                                                                     5.88

Cold galvanising agents                                                                   27.00

Phosphating agents                                                                    44,905.00

Water conditioning agents                                                              1,336.00

Fluxing agents                                                                         1,993.80

Chemicals                                                                             16,026.17

                                                             Total consumables:     489,809.63

ECOLOGICAL OPERATING EQUATION                                                                  15
Gases                                                                                                 Quantity in m3

» Acetylene                                                                                               1,137.615

» Argon                                                                                                   1,201.050

» Carbon dioxide                                                                                            360.000

» Propane                                                                                                    44.000

» Oxygen                                                                                               729,932.900

» Nitrogen                                                                                               11,790.000

» Gas mixture (argon/CO2)                                                                                   338.800

» Hydrogen sulphide                                                                                          31.900

» Hydrogen sulphide – nitrogen                                                                               38.276

» Hydrogen sulphide – CO2                                                                                     8.464

                                                               Total gases:                            744,883.005

3.3     Waste
                       Non-hazardous waste, reusable materials and used materials
Code number                 Description                          Quantity 2020 (in kg)              Disposal interval

17202                       Used wood, untreated                                 99,900                  As required

18718                       Shredded documents                                      200                  As required

35202                       Shredded data media                                      80                  As required

31409                       Building rubble                                     194,880                  As required

57129                       Thermo-mix                                             7,120                  Fortnightly

57129                       Plastics (safety caps)                                 3,500                 As required

31444                       Abrasives                                              3,640                 As required

91101                       Commercial waste                                     35,030                Every 4 weeks

                             Total of non-hazardous waste:                      344,350

31468                       White glass                                             340                Every 4 weeks

31469                       Coloured glass                                          200                Every 4 weeks

35105                       Metal packaging                                         840                Every 4 weeks

92401                       Organic waste                                          3,980                  Fortnightly

91201                       Cardboard packaging                                  46,480                   Fortnightly

91207                       Light fraction, packaging                            13,440                   Fortnightly

                                    Total of used materials:                     65,280

35102                       Mill scale                                         7,633,064                 As required

35103                       Scrap                                             21,869,370                 As required

35103                       Swarf                                              2,924,340                 As required

                                Total of reusable materials:                  32,426,774

Explanation re Section 3.3: Recycling pathways of reusable materials:

16                                                                                     ECOLOGICAL OPERATING EQUATION
Mill scale:      Cement industry (Lafarge Perlmoser, Wietersdorfer & Peggauer)

		               Chemical industry (Donau Chemie)

Scrap:		         voestalpine Donawitz/Schrott Waltner/Schaufler

Swarf:		         Schrott Waltner

3.4     Hazardous waste:
                 Hazardous waste
Code no:                                     Quantity 2020
                  Description
ÖNORM S2100                                          (in kg)

31637             Phosphating sludge                50,360

17209             Tar-impregnated wood                 270
                                                               59803     Spray cans                      1,063

31108             Spent furnace refractory         140,340     58201     Filter cloths/bags              7,399

31437             Mineral fibre                       5,660    35205     Refrigerators
Waste quantity development, 1998 to 2020:

       (t)

      2.500
      2,500

                              Used materials
                              Non-hazardous waste
                              Hazardous waste
                                                                                                                                                             1,996.64
      2.000
      2,000                                                                                                                                                                                                      1,917.83
                                                                                                                                                                                             1,916.83

                                                                                                                                                                                   1,592.37
                                                                                                                                                                                                                            1,571.55

      1.500
      1,500                                                                                                                             1,426.61
                                                                                                        1,349.14                                                      1,499.91

                                                                                       1,237.34
                                                                                                                                                        1,344.10
                                                                          1,146.15

                                              1,000.57
                                                          976.92                                                                                                                                                            1,101.01
      1.000
      1,000                         991.02
                                                                                                                     892.91                 967.87
                                                                                                                                                                                             960.97
                             843.49
                                                                                   836.26                                    850.70
                                                                 851.20
                   664.74                                                                     670.15
                                                                                                                                                                          563.53
                                                                                                                                              503.47
        500                                                                                                450.98
                            548.32                                                                                          392.73                        401.78
                                                                                                                                                                                            365.56              377.42         344.35
                                                346.00                                                                                                                392.73
                                                                 256.96                     313.85                 404.61                                                                            396.13
                                                                          224.59                                                            295.13                                 361.84
                 183.36                      216.04                                                                                                                                                                         291.83
                          129.08                                                                       138.62
                                                                                     130.99                              106.34                120.79            135.77            111.38            123.77
                                                         73.14                                                                                                                                                        95.34
                                     63.47     66.21              46.74                                                                                                                                                          65.28
                  32.50                                                                                                                                                   138.49
                                                                            104.73            120.10            124.61               121.08             121.88                              100.76           118.62
             0              73.10
                   1998     1999     2000      2001      2002     2003     2004      2005     2006     2007      2008       2009     2010      2011     2012       2013    2014    2015      2016     2017     2018   2019      2020

Waste accrual relative to production volume (temporary store generation):

     (kg)

10.00

                                                                                                                                                                                                8.14
 8.00

                                                                                                                                              5.94
 6.00

 4.00

                                                                                        1.86
 2.00

                                    0.35
 0.00
                            kg of used materials                          kg of non-hazardous waste                                kg of hazardous waste                                  kg of waste per t
                              per t of product                                  per t of product                                       per t of product                                   of product (total)

18                                                                                                                                                                                 ECOLOGICAL OPERATING EQUATION
3.5      Water/Waste water
Sanitary water:

Consumption of drinking and sanitary water: 21,381 m3
Waste sanitary water: 18,920 m3

Process waste water:

Constituent streams of process waste water:
»   Sedimentation for NRW waste water
»   Gravel filter for waste water from CT plant
»   Neutralisation for waste water from phosphating plant
»   Flotation for waster water from upsetting plant
»   Sand filter for waste water from heat treatment line 2
»   Acid gas lab exhaust gas washer (indirect discharge) 115 m3

Measurement point: CT discharge shaft for constituent stream CT 1 (external inspection of 16-17/06/2020)
                                                                                   Measurement
                                     Limit as per       Measurement result                            Internal monitoring
Parameter                                                                           result from
                                     assessment      from external inspection                                    interval
                                                                                internal inspection

Temperature                             30 °C                20.9 °C                     -                    Continuous

pH value                               6.5 – 8.5              8.44                       -                    Continuous

Materials removable by filtration     22.5 mg/l             1.00 mg/l               2.34 mg/l                     Weekly

Iron                                   0.9 mg/l            0.015 mg/l                    -                Not prescribed

COD                                   22.5 mg/l
Measurement point: Neutralisation plant (external inspection of 16-17/06/2020)
                                                                                           Measurement
                                        Limit as per           Measurement result                              Internal monitoring
Parameter                                                                                   result from
                                        assessment          from external inspection                                      interval
                                                                                        internal inspection

Temperature                                30 °C                    19.1 °C                      -                     Continuous

pH value                                 6.5 – 9.0                   7.80                        -                     Continuous

Materials removable by filtration         50 mg/l                 12.50 mg/l                     -                 Not prescribed

Iron                                     2.0 mg/l                  0.18 mg/l                 0.60 mg/l                  Fortnightly

Manganese                                1.0 mg/l                  0.17 mg/l                 0.37 mg/l                  Fortnightly

Nickel                                   0.5 mg/l                  0.35 mg/l                 0.31 mg/l                  Fortnightly

Fluoride                                  20 mg/l
Measurement point: Seamless tube rolling mill (external inspection of 16-17/06/2020)
                                                                                 Measurement
                                    Limit as per      Measurement result                            Internal monitoring
Parameter                                                                         result from
                                    assessment     from external inspection                                    interval
                                                                              internal inspection

Temperature                            30 °C               26.2 °C                     -                    Continuous

pH value                             6.5 – 8.5              7.98                       -                    Continuous

Materials removable by filtration     50 mg/l              6.0 mg/l               8.01 mg/l                       Daily

Iron (filtered)                      0.5 mg/l            0.020 mg/l               0.08 mg/l                       Daily

COD                                   50 mg/l
Specific water/waste water quantity relative to production volume:

     m3/t
 18.00
                                                  Water consumption
            16.38

                                                  Waste water volume
 16.00
                    14.50

                                                                                                                                                                                                                                               13.52
 14.00

                                                                                                                                                                                                                                                  11.28
 12.00

                                                                                                                                                                                                                                      9.94
                                                9.73

                                                          9.70

                                                                                                                         9.69
 10.00

                                                                                                                                                                                                                            9.06

                                                                                                                                                                                                                                        8.36
                                                             7.78

                                                                                                                                                                                             8.01

                                                                                                                                                                                                    7.83
                                      7.79

                                                                                                                                7.72

                                                                                                                                       7.73

                                                                                                                                                                                           7.60
     8.00
                               7.28

                                                   7.00

                                                                      7.06

                                                                                                     7.06
                                                                                       6.87

                                                                                                                                                                                                              6.82
                            6.53

                                                                                                               6.72

                                                                                                                                                                                                                               6.75
                                                                    6.70

                                                                                                                                          6.60
                                                                             6.53

                                                                                                                                                                                                       6.46
                                                                                                                                                   6.25

                                                                                                                                                                                                                     5.88
                                         5.62

                                                                                                                                                 5.77

                                                                                                                                                              5.78
                                                                                5.17

                                                                                                        5.58

                                                                                                                                                                      5.38
     6.00
                                                                                              5.32

                                                                                                                  5.26

                                                                                                                                                                             5.26
                                                                                                                                                                     5.33
                                                                                                                                                          5.19

                                                                                                                                                                                    5.12
     4.00

     2.00

     0.00
            1999            2000      2001      2002      2003      2004     2005      2006          2007      2008      2009          2010      2011     2012       2013    2014          2015     2016      2017          2018      2019     2020

Total contaminant load 2020:
                                                                       Max. permissible                               Contaminant load in kg
Parameter
                                                                    contaminant load in kg                                 per annum

Materials removable by filtration                                               142,704                                                11,284.00

COD                                                                             172,884                                                31,085.71

Hydrocarbons                                                                        16,837                                              398.09

Phosphorous                                                                         2,663                                               300.45

Iron                                                                                3,737                                               109.42

Ammonium                                                                             701                                                  0.18

Aluminium                                                                            140                                                  0.72

Nickel                                                                                 9                                                  2.36

Nitrite                                                                                18                                                 6.16

Manganese                                                                              18                                                 2.81

Chrome                                                                               411                                                  0.11

The total contaminant load figures are calculated from the average waste water concentration levels identified
by internal inspections and the annual waste water volumes for the constituent streams.

22                                                                                                                                                                                          ECOLOGICAL OPERATING EQUATION
Utilisation of maximum permissible waste water contaminant loads:

       in %
       40

                                                                                                      35.17
       35

       30
                                                                                             26.92

       25

       20
                          17.98
                                                                                                                    16.07
       15

                                                      11.28

       10
                 7.91

        5
                                        2.36                        2.93

                                                                           0.03   0.51                                           0.03
        0
                 le

                                                      s
                                        ns

                                                                                                                                 e
                                                                n

                                                                                                                   se
                                                                                                      te
                           D

                                                       u

                                                                                                                                 m
              ab

                                                               Iro
                                                    ro
                        CO

                                                                                                               ne
                                    bo

                                                                                                     tri

                                                                                                                              ro
            ov

                                                ho

                                                                                                     Ni

                                                                                                               ga
                                   ar

                                                                                                                            Ch
           n m

                                               sp
                                   oc

                                                                                                              an
        tio re

                                                o
                                 dr

                                                                                                           M
                                             Ph
     tra ls

                               Hy
  fil ria
by ate
  M

Groundwater inspection:

Groundwater analyses must be carried out every 2 years in the area of the decommissioned building waste landfill site.

Building waste landfill site measurement point: before and after tipping (02/09/2019)

                                                                                  Measured value              Measured value
                   Parameter                                   Unit
                                                                                  before tipping               after tipping

Depth                                                           m                         9.40                       10.43

Temperature, water                                              °C                        10.3                        10.8

pH value                                                        -                         7.66                        7.41

Electrical conductivity                                       µS/cm                       491                           507

Acid capacity up to pH 4.3                                    mmol/l                      3.60                        3.60

Carbonate hardness                                             °dH                        10.4                        11.2

Overall hardness                                               °dH                        12.0                        12.3

Ammonium (NH4+)                                               mg/l                       0.013                       0.013

Nitrate (NO3-)                                                mg/l                        5.54                        6.52

Nitrite (NO2-)                                                mg/l
3.6       Exhaust air
Exhaust air calculation:

The basis for calculating the emissions in the exhaust air are the consumption of natural gas (20,868,215 m3) and
the consumption of diesel (88,055 l) in 2020.

Individual figures relating to exhaust air

     Calculated emissions in exhaust air from natural gas and diesel consumption
                                        Gaseous emissions in t pa           in kg/t of product

CO2                                            42,930.944                       231.4638

CO                                                1.043                          0.0056

NOx                                               8.420                          0.0454

SO2                                               0.402                          0.0022

Ctot                                              2.713                          0.0146

CxHy                                              0.007                         0.00004

                           Gaseous exhaust air emissions: 42,943.530 t pa

                                                Dust
                                        Dust emissions in t pa          in kg/t of product

Dust from filter systems                        3.864                          0.0208

Dust from natural gas                           0.209                          0.0011

                                    Total dust quantity: 4.072 t pa

                                              Solvents
                                      Solvent emissions in t pa         in kg/t of product

Solvent emissions from substances              13.824                          0.0745
with solvent content

Solvent emissions from diesel                   0.372                          0.0020

                                Total solvent emissions: 14.196 t pa

24                                                                                               ECOLOGICAL OPERATING EQUATION
CO2 emissions (in kg per t of steel tube produced):

  kg/t
 250.00
                                                                                                               231.46
                                                                                   Exhaust air CO2
          212.18

                                                                197.46   198.13
 200.00                                                                                              193.36
                   189.24
                                                                                   179.44
                            173.59            174.49                                        176.03
                                     171.81            169.71

 150.00

 100.00

  50.00

   0.00
          2009     2010     2011     2012     2013     2014     2015     2016      2017     2018     2019      2020

Exhaust air emissions (in g per t of steel tube produced):

    g/t
 250.00

                                                                                  Exhaust air (remainder)
          200.15
 200.00

                                                                                                                166.35
                                                                160.86
                                                                         156.23
 150.00                                                                                               144.19
                   140.89
                            136.51                                                          133.47
                                                                                   132.42
                                     127.09   129.17
                                                       121.35

 100.00

  50.00

   0.00
          2009     2010     2011     2012     2013     2014      2015     2016      2017     2018     2019      2020

Exhaust air: CO, NOx, SO2, Ctot, CxHy, dust, solvents

ECOLOGICAL OPERATING EQUATION                                                                                            25
Solvent emissions from the use of consumables with solvent content:

Solvent quantity used in kg                     19,477.71

Solvent emissions in kg                         13,824.21

Solvent waste in kg                              5,653.50

In addition to the 13,824.21 kg from the consumables used, there are also 372.03 kg of emissions with solvent
content from the use of diesel fuel, so that the total solvent emissions in the exhaust air amount to 14,196.24 kg.

The solvent content of the materials used is made up of various volatile organic compounds (VOCs), which are
listed in the table below:

Description                                   Quantity in kg/year

1-methoxy-2-propanol                                         180.25

2-amino-ethanol                                                 6.34

2-butanone                                                   594.36

2-methoxy-1-methylethylacetate                              1,129.82

4-hydroxy-4-methylpentane-2-on                                44.88

Acetone                                                     8,280.39

Butanol                                                      913.91

Butylglycol                                                   11.00

Dichloromethane                                                 9.60

Dimethoxymethane                                                7.55

Dimethylether                                                 28.41

Ethanol                                                      559.02

Ethanolamine                                                 561.60

Ethylacetate                                                  27.88

Ethylbenzole                                                    0.45

Isobutane/butane                                              58.09

Isobutylacetate                                              999.05

HC mixtures                                                  211.10

Methyl-methacrylate                                             0.08

n-butylacetate                                               833.92

Naphtha                                                      683.81

Propane                                                       96.88

Propanol                                                      21.43

White spirit                                                1,091.46

Toluol                                                      3,123.01

Xylol                                                           3.42

Total                                                  19,477.71

26                                                                                    ECOLOGICAL OPERATING EQUATION
3.7       Energy
Energy purchased                                                                   Energy consumed (MWh)                                  284,125.554

Electricity (MWhel)                                           46,813.276           Energy converted (elec-                                  46,813.276
                                                                                   tricity)

                                          of which renewable energies: 46,813.276 (MWh) = 100%

Natural gas (m³)                                         20,868,215.472            Heating energy (natural                                 236,436.881
                                                                                   gas)

Petrol (litres)                                                  305.000           Heating energy (heating                                         2.596
                                                                                   oil)

Diesel (litres)                                                88,055.00           Propulsion energy (fuel)                                     872.801

Electricity generated by:                     Proportion in %

Hydropower                                                100.00

Solid or liquid biomass                                      0.00

Biogas                                                       0.00

Other green energy                                           0.00

Wind energy                                                  0.00

Total electricity purchased:                               100%

Total energy consumption (in MWh per t of steel tube produced):

 MWh/t
  2.00
         1.852                                                                                                               Energyconsumption
                                                                                                                            Energy  consumption
                                                                                                                           (electricity,natural
                                                                                                                        (electricity,    naturalgas,
                                                                                                                                                 gas,fuels)
                                                                                                                                                      fuels)
  1.80

  1.60                                                                                                                                                          1.532

                                                                                  1.405
  1.40                            1.335                                                                                     1.314 1.320
                  1.284                   1.263 1.262                                                                                                   1.281
                          1.232                                                           1.243
                                                                                                                                          1.196 1.194
  1.20                                                  1.145 1.134 1.156 1.161                   1.145 1.130 1.153 1.125

  1.00

  0.80

  0.60

  0.40

  0.20

  0.00
         1999 2000 2001 2002 2003 2004 2005 2006 2007 2008 2009 2010 2011 2012 2013 2014 2015 2016 2017 2018 2019 2020

ECOLOGICAL OPERATING EQUATION                                                                                                                                           27
3.8        Transport
The entire incoming supply of feedstock (continuous-cast billets) is transported by rail.

The major proportion (63%) of outgoing shipment of the finished products takes place by rail; a smaller proportion
(37%) is transported by road on HGVs. Transport on site between the individual parts of the factory takes place
by HGV.

3.9        Use of land
 Category                                            Area in m2         Proportion in %

 Total area                                             402,465                        100

 Built-up land                                          166,316                        41.3

 Company grounds not                                    207,967                        51.7
 built up

 Roadways                                                  3,639                        0.9

 Rail transport installations                              2,682                        0.7

 Allotments rented out*)                                 21,552                         5.3

 Arable land, meadow*)                                       309                        0.1

*) Due to the small size of the individual plots rented out, an assessment regarding “natural land management” is dispensed with.

                                                                                   Built-up area
                                                                                    (buildings)
                                                                                      41.32%

                                                                                                      Allotments rented out
                                                                                                              5.35%

                                                                                                          Arable land, meadow
                                                                                                                0.08%

                                                                                                          Roadways
                                                                                                            0.90%

                                                                                                     Rail transport
                                                                                                      installations
                                                                                                         0.67%

        Company grounds
          not built up
           51.67%

28                                                                                                                            ECOLOGICAL OPERATING EQUATION
3.10 Indirect environmental aspects
Seamless tube as a product produces no negative environmental impacts whatsoever during use, recycling or
disposal. Its effect on the environment is neutral in use. The product creates no pollutant emissions of any kind
when used for its intended purpose. At the end of their useful life, the pipes/tubes can be reused in the form of
scrap as a secondary material in the iron and steel industry and are thus 100% recyclable. If the pipes/tubes are
disposed of in landfill sites, no environmental effects of any kind are to be expected.

In the development and design process, the specifications are largely determined by the customer and/or the
purpose for which the product is to be used and thus are not within the control of the company to any meaningful
degree.

In connection with transport, it is worth mentioning that the customer base of voestalpine Tubulars is part of a
global market in which the finished tubes/pipes are shipped worldwide by rail and sea.

Environmentally significant products and services are procured in accordance with the criteria of the quality
management system taking account of the environment-related criteria and, while ensuring that consumables,
packaging materials and technical supplies with the least possible environmental impact are purchased. The
selection of suppliers, assessment of them and approval of new suppliers are also carried out taking account of
environment-orientated aspects.

The environmental management requirements apply not only to the employees of voestalpine Tubulars. The
contractors and subcontractors operating at the Kindberg site are required to make an undertaking to comply
with the environmental standards specified by voestalpine Tubulars.

The environmental impact caused by employees commuting to and from the workplace is difficult for the company
to have any control over. However, there is the possibility of a public bus service which would provide the option of
travelling by public transport. Due to the rural nature of the surrounding area and the associated inadequacy of
the public transport system serving the site, the vast majority of employees are reliant on the use of private cars
for travel to and from work. There are sufficient numbers of parking spaces available to staff in the immediate
vicinity of the company grounds.

Of the total workforce, 33% live in Kindberg, another 52% live within a radius of
4 LIFE CYCLE ANALYSIS

Life cycle stages of seamless steel pipes and tubes:

                                             Transport            Seamless steel tube      Seamless steel tube
                                               (rail)                produc�on                produc�on

                                             Feedstock
       Transport                                                                               Use by the
                                             produc�on
                                        (raw materials & scrap)
                                                                                               customer

                                                                     Re-use
     Raw material
      extrac�on
 (ore, coal, aggregates)
                                                                    Recycling

                                                                    Disposal

Calculation of carbon footprint:

Definition of the equation parameters takes account of the areas of raw material transport, feedstock production,
feedstock transport, steel pipe/tube production, on-site transport and transport of finished products to customers.

Percentage proportions of carbon equivalents:

                                        13.6%

                                10.8%

                                                       75.6%

       Feedstock production

       Steel tube production

       Transport and despatch
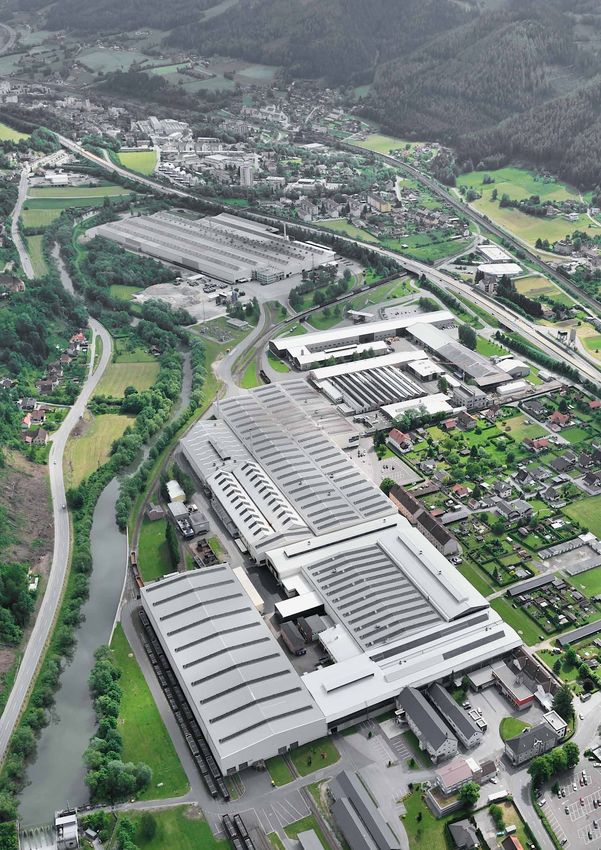
30                                                                                                Life cycle analysis
5 KEY ENVIRONMENTAL INDICATORS
Environmental performance indicators

The numbers referred to as environmental performance indicators are the environmental data and figures from
the input/output analysis, although it is not the absolute figures but rather the specific values relative to the
production volume in each case that are viewed as the environmental performance indicators.

Production volume = Temporary store generation from hot tube production

Production volume 2020: 185,475.88 t

Material and energy equation for production of 1 t of steel tube (2020)

As can be seen from the equation, the production of 1,000 kg of steel tube requires the use of 1,120.437 kg of
raw material, representing a yield of 89.25%.

The environmental performance indicators are heavily dependent on the capacity utilisation of the factory, as
all environmental indicators are relative to production volume. That means that high capacity utilisation and
the associated high production levels have a positive effect on all environmental performance indicators, that
is to say on the specific input and output. For that reason, the year 2020 is only comparable to a limited degree
with the previous years because, as a result of the prevailing circumstances (pandemic), a drastic downturn in
the production figures is evident.

Key environmental indicators                                                                                   31
Developments in the company’s environmental performance indicators since 1998

                                     Water consumption                 Compressed air consumption                 Natural gas             Electricity
INPUT
                                     in m3/t                           in m3/t                                    in m3/t                 in MWhel/t

1998                                 12.40                             189.14                                     126.61                  0.274

1999                                 16.38                             224.23                                     140.04                  0.293

2000                                 7.28                              158.38                                     96.66                   0.208

2001                                 7.79                              141.43                                     93.32                   0.194

2002                                 9.73                              160.02                                     100.94                  0.211

2003                                 9.70                              148.61                                     95.95                   0.195

2004                                 7.06                              132.68                                     96.08                   0.192

2005                                 6.53                              125.80                                     87.40                   0.171

2006                                 6.87                              121.26                                     86.51                   0.170

2007                                 7.06                              130.51                                     87.78                   0.178

2008                                 6.72                              130.87                                     88.08                   0.179

2009                                 9.69                              170.53                                     105.72                  0.227

2010                                 7.73                              141.92                                     94.37                   0.191

2011                                 6.25                              168.46                                     86.56                   0.180

2012                                 5.78                              175.31                                     85.66                   0.175

2013                                 5.38                              166.40                                     86.96                   0.184

2014                                 5.26                              159.37                                     84.59                   0.182

2015                                 8.01                              179.55                                     98.39                   0.217

2016                                 7.83                              166.94                                     98.72                   0.219

2017                                 6.82                              140.44                                     89.42                   0.199

2018                                 9.06                              144.43                                     87.72                   0.199

2019                                 9.94                              163.01                                     93.81                   0.215

2020                                 13.52                             174.43                                     112.51                  0.252

 20

 18

 16

 14

 12

 10

     8

     6

     4

     2
                    Water consumption in m³/t
     0
         1998 1999 2000 2001 2002 2003 2004 2005 2006 2007 2008 2009 2010 2011 2012 2013 2014 2015 2016 2017 2018 2019 2020

32                                                                                                                              Key environmental indicators
250

 200

 150

 100

  50

                     Compressed air consumption in m³/t

   0
        1998 1999 2000 2001 2002 2003 2004 2005 2006 2007 2008 2009 2010 2011 2012 2013 2014 2015 2016 2017 2018 2019 2020

 160

 140

 120

 100

  80

  60

  40

  20

                    Natural gas consumption in m³/t

   0
        1998 1999 2000 2001 2002 2003 2004 2005 2006 2007 2008 2009 2010 2011 2012 2013 2014 2015 2016 2017 2018 2019 2020

 0.35

 0.30

 0.25

 0.20

 0.15

 0.10

 0.05

                 Electricity consumption MWh/t

 0.00
        1998 1999 2000 2001 2002 2003 2004 2005 2006 2007 2008 2009 2010 2011 2012 2013 2014 2015 2016 2017 2018 2019 2020

Key environmental indicators                                                                                                 33
Non-hazardous waste                 Hazardous waste                  Waste water               Exhaust air        Energy consumption
     OUTPUT
                           in kg/t                           in kg/t                        in m3/t                   in kg/t               in MWh/t

      1998                      0.68                             3.56                         11.37                        253.9              1.683

      1999                      0.59                             4.28                         14.50                        280.8              1.852

      2000                      0.48                             2.96                          6.53                        194.3              1.284

      2001                      0.62                             3.01                          5.62                        187.4              1.232

      2002                      1.35                             3.82                          7.00                        202.7              1.335

      2003                      0.91                             3.14                          7.78                        192.6              1.263

      2004                      0.67                             2.69                          6.70                        192.8              1.262

      2005                      0.79                             2.88                          5.17                        175.4              1.145

      2006                      1.62                             2.98                          5.32                        173.7              1.134

      2007                      1.13                             3.37                          5.58                        176.2              1.156

      2008                      1.02                             2.26                          5.26                        176.8              1.161

      2009                      1.87                             4.05                          7.72                        212.4              1.405

      2010                      0.87                             2.86                          6.60                        189.4              1.243

      2011                      1.18                             3.34                          5.77                        173.7              1.145

      2012                      0.93                             3.10                          5.19                        171.9              1.130

      2013                      0.95                             4.81                          5.33                        174.6              1.153

      2014                      1.29                             3.43                          5.12                        169.8              1.125

      2015                      1.64                             5.51                          7.60                        197.6              1.314

      2016                      1.43                             3.76                          6.46                        198.3              1.320

      2017                      0.96                             4.64                          5.93                        179.6              1.196

      2018                      0.88                             4.49                          6.75                        176.2              1.194

      2019                      0.90                             4.82                          8.36                        188.6              1.281

      2020                      1.86                             5.94                         11.28                        231.6              1.532

 7
                 Non-hazardous waste in kg/t
                 Hazardous waste in kg/t
 6

 5

 4

 3

 2

 1

 0
      1998 1999 2000 2001 2002 2003 2004 2005 2006 2007 2008 2009 2010 2011 2012 2013 2014 2015 2016 2017 2018 2019 2020

34                                                                                                                             Key environmental indicators
16

 14

 12

 10

  8

  6

  4

  2
                  Waste water volume in m3/t

  0
       1998 1999 2000 2001 2002 2003 2004 2005 2006 2007 2008 2009 2010 2011 2012 2013 2014 2015 2016 2017 2018 2019 2020

 300

 250

 200

 150

 100

  50

                 Exhaust air in kg/t

   0
       1998 1999 2000 2001 2002 2003 2004 2005 2006 2007 2008 2009 2010 2011 2012 2013 2014 2015 2016 2017 2018 2019 2020

 2.0

 1.8

 1.6

 1.4

 1.2

 1.0

 0.8

 0.6

 0.4

 0.2
                    Energy consumption MWh/t
 0.0
       1998 1999 2000 2001 2002 2003 2004 2005 2006 2007 2008 2009 2010 2011 2012 2013 2014 2015 2016 2017 2018 2019 2020

Key environmental indicators                                                                                                35
6 ACCIDENT STATISTICS
In 2020, the Kindberg plant completed 1,082,039 hours of production. There are 829 employees on the payroll
(average figure for the year 2020).

                                                                                      2019               2020

Accident rate                     Accidents per 100 employees                             5.69            4.70

Accident frequency                Accidents per million hrs                           36.13              36.04

Accident severity                 Lost working hours per accident                     90.18              76.41

Absence due to accidents Absence as % of working hours                                    0.33            0.28

Working hours lost                per year and employee                                   5.13            3.59

The accident statistics include all reported work accidents (with/without loss of working hours) involving paid staff.

     6.00
                    5.69
                                                                                                       Accident rate
                                       5.13
                                                                                                       Absence due to accidents
     5.00
                                                          4.70                                         Hours lost�

     4.00
                                                                                   3.59                 Accident rate
                                                                                                               =
                                                                                                 Accidents per 100 employees
     3.00
                                                                                                       Absence due to
                                                                                                          accidents
                                                                                                              =
                                                                                                 Absence as % of working hours
     2.00
                                                                                                         Hours lost
                                                                                                              =
                                                                                                 Hours per year and employee
     1.00

                           0.33                                          0.28

     0.00
                           2019                                          2020

     100

                                   90.18
      90                                                                                                 Accident frequency

                                                                                                         Accident severity
      80                                                                          76.41

      70
                                                                                                       Accident frequency
                                                                                                                 =
      60
                                                                                                     Accidents per million hours

      50                                                                                                Accident severity
                                                                                                                =
      40
                                                                                                       Absence per accident
                                                                 36.04

      30

      20

      10

      0
                           2019                                            2020

36                                                                                                                                 Accident statistics
The development of the key indicators for accidents shows that the accident rate for 2020 declined by 17.40%
compared with 2019 (from 5.69 in 2019 to 4.70 in 2020) and the resulting lost working hours fell by 30.02% (from
5.13 to 3.59) compared with the previous year.

 14

                               12.75

 12
                                                                                                     11.01

 10                                                           9.69
                                        9.54
                                                                                        9.11
                              8.83                 8.44                       8.53
                                                                                                                       8.18
       7.77                                                          8.79                              8.68                          7.65      7.67
  8                                    8.32
                6.85                                                                                            7.76
                                                7.29                                 7.46
                                                                                                                              6.62                     5.69
  6
                     6.24                                                                                                                      5.91

                                                                                                                                                         4.70
  4

  2
        Accident rate
        Accidents per 100 employees
  0
      1997 1998 1999 2000 2001 2002 2003 2004 2005 2006 2007 2008 2009 2010 2011 2012 2013 2014 2015 2016 2017 2018 2019 2020

 16

                                       14.17
 14                         13.67

                                               12.23
 12
                                                          10.96
                              11.24
                10.42
                                                                                10.13
                                                                     9.99
 10
       8.79
                                                                                            8.58     8.46
                                                                                                               8.00
  8                                                                    8.55
              8.15
                                                                                                                                        6.47
                                                 6.98                                                                                           5.99
  6                                                                                           6.80                       5.58
                                                                                                              6.24                                     5.13
                                                                                                                                                5.33
                                                                                                                                5.18
  4

                                                                                                                                                          3.59

  2
        Hours lost
        per year and employee�
  0
      1997 1998 1999 2000 2001 2002 2003 2004 2005 2006 2007 2008 2009 2010 2011 2012 2013 2014 2015 2016 2017 2018 2019 2020

Accident statistics                                                                                                                                              37
7 ENVIRONMENTAL PROGRAMME 2021/22
For the FY 2021/22 (01/04/2021 to 31/03/2022) a quality, environmental, energy, health & safety and asset
management programme was drawn up and approved by the executive management.

                                                                                                         Responsibility
Item    Subject                 Target                               Programme                                              Deadline
                                                                                                            holder

MANAGEMENT SYSTEM

1       Environmental           Creation of marketing                Analysis for production of               TM          February 2022
        Product Declaration     tools having regard for the          an Environmental Product
                                environmental aspects of the         Declaration
                                products and production

2       Process roadmap for     Clear presentation of the            Digital representation of the            TM          February 2022
        digitisation            company’s process roadmap            process roadmap and link to
                                                                     relevant IMS documents for the
                                                                     relevant processes

3       Electronic IMS train-   Staff awareness-raising              Implementation of a training             TM          February 2022
        ing module              regarding integrated                 module relating to IMS topics
                                management system issues             in e-matrix

4       Supplier survey         Analysis of information from         Production of a survey                   TM          February 2022
                                monitored suppliers regarding        questionnaire for all monitored
                                qualifications/approvals and         suppliers
                                assessment

USE OF MATERIALS

5       Dressing shop           Optimisation of external and         Use of materials                        TN31         February 2022
        External and internal   internal oiling on the calibration   Development of new tools and
        oiling                  systems, less spray mist and         tool optimisation
                                reduction of lubrication
                                consumption by 15%

6       Annual quantities       Documentation of all annual          Creation of an Excel                     TF            May 2021
        Use of materials        quantities for operating             spreadsheet containing all
                                supplies and consumables             relevant information about the
                                that are not ordered through         use of operating supplies and
                                the Purchasing Department            consumables in department TF

WASTE

7       Waste code numbers      Implementation of modified           Change over to the new waste             TM          December 2021
                                requirements for identification      code numbers in the waste
                                of waste using new waste             disposal records according to
                                code numbers                         the current waste register

8       Awareness-raising       Increasing awareness in              Provision of a training course           TM          February 2022
        Company waste           connection with waste                for problem-waste disposal
        management              transport, collection and sorting    staff and stacker truck drivers

38                                                                                                     Environmental programme 2021/22
EXHAUST AIR

9     Socket forming          Reduction of nitro thinner        Acquisition of sealed stainless     TN32     June 2021
      Nitro thinners          vapours by 50% during             steel containers for filling with
                              cleaning of sprayer jets in the   nitro thinners
                              socket painting shop

10    Road markings           Need for markings has risen       Research and consultation           TA22   February 2022
      Spray cans              sharply – completion of an        with suppliers, obtain quotes
                              assessment re the replacement     and compile a comparison
                              of the 750ml spray cans and       calculation
                              cost comparison

WATER/WASTE WATER

11    Waste water             Obtain re-award of the water      Submission of a project to          TM     December 2021
      CT plant                licence for the waste water       the authorities on time and
      Constituent stream 1    treatment plant                   processing of the procedure by
                              CT plant constituent stream 1     the authorities

12    Waste water             Obtain re-award of the water      Submission of a project to          TM     December 2021
      CT plant                licence for the waste water       the authorities on time and
      Constituent stream 2    treatment plant                   processing of the procedure by
      (upsetting plant)       CT plant constituent stream       the authorities
                              2 (upsetting plant de-
                              pressurisation flotation plant)

ENERGY

13    PV system               Power supply to the industrial    Installation of photo-voltaic        TA    February 2022
                              site using local renewable        systems on the rooves of
                              energy at a level of 4GWh pa      the production sheds for an
                              of self-generated electricity     installed power output of 4MW

14    Dressing shop           Reduction of energy               Optimisation of lamp control        TN31   February 2022
      UV coating systems      consumption by                    and defined cleaning intervals
                              UV lamps by 15%                   for UV lamps

15    Energy efficiency       Achievement of the                Keep no-load energy                  TA    February 2022
                              energy-efficiency target of       consumption as low as possible
                              ≤1.487MWh according to
                              actual production volume

16    Seamless tube rolling   Reduction of lighting failures    Installation of high-               TA11   February 2021
      mill lighting           and energy saving of              temperature resistant light
      Cooling bed             >50MWh pa                         sources and energy savings

TRANSPORT

17    CO2 emissions           Publication of all CO2            Calculation of the CO2              KVL      May 2021
                              emissions in relation to all      emissions per tonne-kilometre
                              inbound and outbound              based on expertise figures and
                              transport                         digital analysis for each mode
                                                                of transport in QlikView

Environmental programme 2021/22                                                                                          39
LEGAL COMPLIANCE

18   Recurring inspections    Factory-wide overview of          Evaluation with involvement of             TM       February 2022
                              recurring inspections by          TÜV Austria
                              creation of a reference
                              document as summary of the
                              statutory inspections

SAFETY

19   LTIFR accident indi-     Reduction of accident             Continuation of the                       TM3       February 2022
     cator                    indicator LTIFR (Group            “Consciously Safe” programme
                              benchmark) to ≤9.0                and ongoing measures for
                                                                awareness-raising among staff,
                                                                regular safety inspections,
                                                                analysing and learning from
                                                                accidents

20   Dressing shop            Reduction of occupational         Introduction of trainer-led               TN31      February 2022
     Mini workshops           accidents by 20% by               workshops
                              organised independent
                              provision of mini workshops by
                              forepersons and supervisors

21   Emergency rescue         Prevention of hold-ups in the     Incorporation of presence                 TA2       February 2022
     staff                    alarm chain by visualisation of   (effected by site access) in
     Alarm chain              presence of emergency rescue      the SiPass system
                              staff at alarm control centre
                              (door security)

22   PPE dispensers           Increase certainty of             Staff can obtain the necessary            TM3       December 2021
                              availability of personal          articles using their company
                              protective equipment (PPE) by     pass
                              means of PPE dispensers

23   Electronic instruction   Expansion of the choice of        Provision of additional mod-              TM3       December 2021
     modules                  electronic instruction modules    ules, e.g. on cranes, PPE, in the
                                                                online instruction system

24   “Consciously Safe”       Increasing awareness              Raising awareness on the part             TM3       December 2021
     refreshers               of the central issues of          of managers (especially new
                              the “Consciously Safe”            forepersons and supervisors)
                              programme on the part of all      of the “Consciously Safe”
                              managers                          programme by means of face-
                                                                to-face or online workshops

HEALTH

25   Health promotion         Achievement of a high level       Continuation of health-                   TM4       February 2022
                              of health by raising the health   promoting measures and
                              ratio to ≥96%                     health-related support of staff
                                                                on site

26   BGF quality seal         Obtaining the BGF quality         Fulfilment of the 15 central              TM4       February 2021
                              seal awarded by the Austrian      quality criteria
                              business health promotion
                              network BGF for the years
                              2022 - 2024

40                                                                                                  Environmental programme 2021/22
8 LEGAL COMPLIANCE
To ensure legal compliance, the legal requirements relevant to the company in the areas of environment,
occupational heath & safety and energy legislation were identified.

The tool used for the purpose is a legislation database that is updated every three months.

The administration and updating of the legislation database is carried out by the Management Systems department.

The procedure for assessing the legal requirements comprises the following steps:

» Assessment of the legal requirements for relevance to the company
» Where relevance is identified, determination of the resulting obligations and categorisation as once-only or
  recurring tasks
» Definition of responsibilities (responsibility holders, task performers) for fulfilment of the legal obligations
  including definition of tasks, deadlines and intervals in the legislation database
» Fulfilment notifications regarding completed tasks are likewise created in the legislation database
» Ongoing monitoring of fulfilment of the tasks by the Management Systems department

Information about new/due tasks is issued electronically by e-mails to the responsibility holders and task performers.
A reminder interval can be defined for all tasks whereby timely notification by e-mail about outstanding tasks is
automatically initiated.

As well as the legal requirements, the legislation database also includes all official notices and imposed conditions,
with obligations arising from officially imposed conditions being entered in the database along with the legal
obligations.

At present, it is possible to generate a legislation register with a list of all relevant legal requirements, as well as a
summary of the compliance fulfilment level of the legal requirements, from the legislation database.

A report as at the current date in accordance with §82b of the Austrian Trade Regulations (Gewerbeordnung)
can be produced.

Compliance with the legal requirements is verified by inspections and internal audits.

Each month, the Management Systems department carries out an analysis of the legislation database and
simultaneously reports the status to the senior management.

Based on the analysis, an assessment of legal compliance is made without indication of any breaches of the law.

LEGAL COMPLIANCE                                                                                                       41
9 GENERAL INFORMATION

We are happy to answer any questions about environmental protection at our company.

voestalpine Tubulars GmbH & Co KG

A-8652 Kindberg, Alpinestrasse 17, Austria

Tel.: 050304 / 23-0

Fax: 050304 / 63-0

Managing Director:       Gerald Gfrerer, Dipl.-Ing.

Environmental Officer: Harald Kohlhofer, Dipl.-Ing.

Harald Kohlhofer, the Environmental Officer at voestalpine Tubulars, will be happy to answer any questions about
the current Environmental Declaration, the company aims and objectives in the area of environmental protection
and the measures implemented so far.

Harald Kohlhofer, Dipl.-Ing.

Tel.: +43/50304/23-366

Fax: +43/50304/63-346

E-mail: harald.kohlhofer@vatubulars.com

http://www.voestalpine.com/tubulars

42                                                                                           General information
10 DECLARATION OF VALIDITY OF THE
   ENVIRONMENTAL DECLARATION
The Chief Environmental Inspector and Authorised Signatory

                                                DI Wolfgang Brandl
                                         of the environmental inspectorate
                                TÜV SÜD Landesgesellschaft Österreich GmbH,
                           Franz-Grill-Strasse 1, Arsenal Obj. 207, 1030 Vienna, Austria
                                          (Registration number AT-V-0003)

hereby confirms inspection and verification that the site as specified in the Consolidated Environmental Declaration
of the organisation

                                       voestalpine Tubulars GmbH & Co KG
                                                  Alpinestrasse 17
                                          8652 Kindberg-Aumühl, Austria
                                      with the registration number AT-000208

meets all requirements of Regulation 1221/2009 (EC) of the European Parliament and the Council of 25 November
2009 – in conjunction with Regulation 2017/1505 (EU) and Regulation 2018/2026 (EU) – on the voluntary
participation by organisations in a Community eco-management and audit scheme (EMAS).

This signed Declaration confirms that

» the inspection and validation were carried out in full compliance with the requirements of Regulation (EC)
  1221/2009 as amended by Regulation (EU) 2017/2009 and Regulation (EU) 2018/2026,
» the result of the inspection and validation confirms that there is no evidence of non-compliance with the
  applicable environmental requirements,
» the data and information in the Environmental Declaration for the site provide a reliable, credible and
  truthful picture of all activities at the site within the area specified in the Environmental Declaration.

This Declaration may not be taken as equivalent to EMAS registration. EMAS registration may only be carried
out by a competent centre according to Regulation (EC) 1221/2009. This Declaration may not be used as an
independent basis for informing the public.

\The environmental inspectorate TÜV SÜD Landesgesellschaft Österreich GmbH is officially licensed for NACE
code 24.20 by the Austrian Federal Ministry for Agriculture, Forestry, Environment and Water Management.

                                                     Jenbach, 17/03/2021

                                                     -------------------------------------------------------------
             National organisation                   Wolfgang Brandl
                   Austria
                                                     (Chief Environmental Inspector) of TÜV SÜD Landesgesellschaft Österreich GmbH
                                                     Franz-Grill-Strasse 1, Arsenal Obj. 207, 1030 Vienna

The next Consolidated Environmental Declaration by voestalpine Tubulars GmbH & Co KG will be submitted for
inspection in March 2023. Yearly updates will be carried out in the intervening period.

Declaration of Validity of the Environmental Declaration                                                                             43
You can also read