Tenth Annual Energy Paper - EYE ON THE MARKET ENERGY OUTLOOK 2020 - JP Morgan
←
→
Page content transcription
If your browser does not render page correctly, please read the page content below
EYE ON THE MARKET • ENERGY OUTLOOK 2020

Tenth Annual Energy Paper
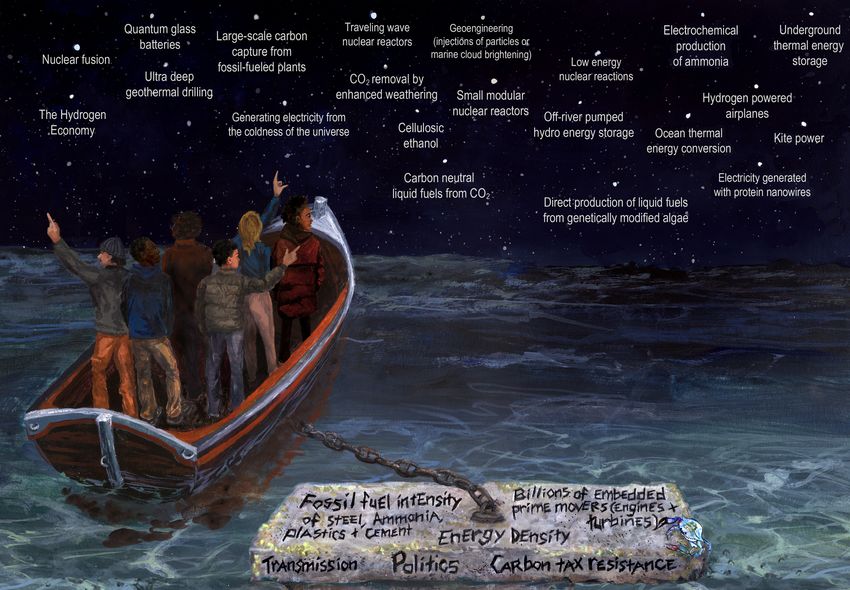
Tenth Annual Eye on the Market Energy paper: Front Cover
 Stargazing. COVID lockdowns reduced global CO2 emissions to levels last seen over a decade ago.
 While this decline is temporary, there’s still a lesson to be learned: an unsustainable halt in economic
 activity and mobility was needed to make a material dent in global CO2 emissions. In our tenth
 annual Eye on the Market energy paper, we take a look at when and how renewable energy
 transitions might accomplish the same thing. A lot of ideas flicker in the distance, but few are capable
 of being scaled and substantially commercialized in the foreseeable future.
 Topics in this year’s paper include limits from de-carbonizing the grid alone; de-carbonization of steel
 and other industrial products; political and physical renewable energy bottlenecks; the scope of
 utility-scale energy storage, reforestation, and carbon sequestration required to make a difference;
 the impact of ride-hailing on emissions, and the never-ending hope for a hydrogen economy. We
 also review the financial, political and environmental risks to US energy independence, and whether
 a supply shock or stranded asset risk is the primary reason for the lowest oil & gas valuations in 90
 years. We conclude with an exhibit on Trump and the environment.

INVESTMENT PRODUCTS ARE: • NOT FDIC INSURED • NOT A DEPOSIT OR OTHER OBLIGATION OF, OR GUARANTEED BY, JPMORGAN CHASE BANK,
    N.A. OR ANY OF ITS AFFILIATES • SUBJECT TO INVESTMENT RISKS, INCLUDING POSSIBLE LOSS OF THE PRINCIPAL AMOUNT INVESTED
Preface: the large but temporary impact of COVID on global energy consumption
One of the worst pandemics in 100 years had an understandably large impact on energy consumption given
widespread adoption of lockdowns and other mobility restrictions. Estimates of real-time global CO2 emissions
showed a decline in May to levels last seen over a decade ago. However, this decline is almost certainly a
temporary one. High frequency measures of China coal consumption are already back to pre-pandemic levels,
the same is true for China oil demand as tankers line up on its eastern ports waiting to discharge oil for Chinese
refineries, and China air traffic is down only 30% vs January. In the US, electricity production never fell more
than 15% y/y during the pandemic, a full rebound is expected for US gasoline consumption by the second half
of the year, and the EIA expects global liquid fuels consumption to reach pre-COVID levels by June 2021. Even
so, there’s an energy lesson to be learned from the pandemic: an unsustainable halt in economic activity and
mobility was needed to make a material dent in global CO2 emissions. In our tenth annual energy paper, we
take a close look at when and how renewable energy transitions might accomplish the same thing.
Global daily CO2 emissions: history from 1970-2019,
with daily estimates for 2020, Million tonnes CO2 / day COVID update
110 The epicenter of the US pandemic has shifted from the
100 Northeast to several hotspot states spanning the Southern
90 US from coast to coast. Until recently, while hotspot
80 infections were surging, hospitalizations and deaths were
not. Over the last week, hospitalizations in hotspot states
70
have been rising as well. These outcomes are not a
60
complete surprise; many hotspot states experienced the
50 smallest declines in social distancing, measured by retail
40 and restaurant tracking. For more information on the virus,
30 vaccine development and market/economic impacts, see
1970 1980 1990 2000 2010 Jan 2020 Mar 2020 May 2020 our virus analysis portal which can be found here.
Source: Quéré et al, "Temporary reduction in daily global CO2 emissions
during the COVID-19 forced confinement" University of East Anglia. 2020.
China coal consumption China oil demand
Daily y/y % change Monthly y/y % change
60% 25%
20%
40%
15%
20% 10%
0% 5%
0%
-20%
-5%
-40% -10%
-60% -15%
2018 2019 2020 2017 2018 2019 2020
Source: cqcoal, Wind. June 24, 2020 Source: Bloomberg. May 2020.
Air traffic at China’s 25 busiest airports World liquid fuels consumption
Total departures, thousands Million barrels per day
12 110
105
10
100
8
95
6
90
4
85
2 80
0 75
Jan-20 Feb-20 Mar-20 Apr-20 May-20 Jun-20 Jan 18 Jul 18 Jan 19 Jul 19 Jan 20 Jul 20 Jan 21 Jul 21
Source: Flightradar24. June 23, 2020. Source: EIA Short-term Energy Outlook. June 2020.
1Executive Summary
When I began writing this piece ten years ago, I knew that I needed a technical advisor to shepherd me
through the real world complexity of energy transitions. Vaclav Smil is one of the world’s foremost experts
on such topics, and his guidance and insights have been invaluable. Over the last decade, Vaclav has
described renewable energy as the fourth great energy transition (after mastery of fire, a shift from foraging
to agriculture and domesticated animals, and a shift from biomass and human/animal labor to combustion
of fossil fuels). However, he has also stressed the decades required for past energy transitions to unfold,
illustrated in the first chart. In our discussions, he has also cautioned against embrace of faddish energy
solutions that sound great on paper but which are difficult to scale (some are illustrated on this year’s
cover), and has highlighted how energy efficiency gains are often offset by greater consumption. An
example of the latter: a 75% decline since 1960 in jet aircraft fuel consumption per passenger-kilometer
led to similar declines in ticket prices and a surge in ridership and related aircraft emissions.
The last three energy transitions took ~40 years to reach Global CO2 intensity declining, CO2 emissions rising
15%-20% shares, % of world primary energy consumption Tonnes of CO2 / thousand $2018 GDP Billion tonnes
50% 0.65 35
Coal, 1820 to 1900
0.60 CO2 intensity CO2 emissions
Oil, 1910 to 1990
40% 0.55 30
Natural gas, 1930 to 2010
Modern renewables, 2010 to 2020 0.50
30% 25
0.45
0.40
20% 20
0.35
0.30 15
10%
0.25
Years
0% 0.20 10
0 10 20 30 40 50 60 70 80 1965 1970 1975 1980 1985 1990 1995 2000 2005 2010 2015
Source: V. Smil (pre-1965 data), BP (post-1965 data), JPMAM. 2020. Source: BP Statistical Review of World Energy, Conference Board. 2019.
With that introduction, here’s where we stand now. While global CO2 intensity has improved (the amount
of CO2 generated per unit of real economic growth has declined), the absolute level of global CO2 emissions
keeps going up. Recent emission increases mostly come from emerging economies, but remember the
reasons why. Developed countries have been de-industrializing for 25 years, which has shifted
carbon-intensive manufacturing of steel, cement, ammonia and plastics to the emerging world. In other
words, emerging countries now produce industrial goods they need on top of what they also produce for
the developed world. Any discussion of regional emissions and burdens should reflect these realities.
A shift in energy intensive manufacturing to the emerging Primary energy use, past and future
world, % of global production Mtoe, with projections based on IEA Stated Policies Scenario
100% China:2,044 Mtoe
Emerging economies 1,000
90%
Historical change 2008-2018
80% 800
70% Projected change 2018-2040
60% 600
50%
400
40%
30% 200
20%
10% 0
Developed economies EU Japan US Latin SE Asia Middle Africa China India
0% -200 America East
1995 2018 1998 2017 1998 2019 1998 2016 2005 2018
Manufacturing Ammonia Steel Cement Plastic
-400
Source: UN Dept. of Social and Economic Affairs, Worldsteel, PlasticsEurope,
USGS. 2019. Source: International Energy Agency World Energy Outlook. 2019.
2To reinforce the point on transfer of production to the developing world, consider coal-fired electricity
generation. All the world’s countries except China reduced net coal-fired generation capacity by 8 GW
from January 2018 to June 2019. Over the same period, China increased such coal capacity by 43 GW,
has another 121 GW under construction and is financing a quarter of all new coal projects across Asia. In
other words, global reliance on cheap industrial and consumer goods exports from China comes at a
substantial environmental cost.
Here’s a simple exercise in CO2 emissions math. Forget about reducing emissions; let’s just think about
keeping emissions flat. Emerging economy emissions increased by 3% p.a. since 2007 while developed
world emissions declined by 0.7%. Let’s assume that emerging economy emissions grow at the same pace
and that the developed world has to emit less. To keep global emissions flat, the developed world
would need to reduce emissions by ~4% per year, which is 5x-6x faster than the current pace.
Whether that would be enough to keep oceans from continuing to heat up is unclear, but it would be a
move in the right direction.
Required emission decline in developed countries to keep Warming oceans
global CO2 emissions flat: 5-6x faster than current pace Zettajoules
3% 250
200 Ocean heat content change in upper 2000 m
2% vs 1981-2010 baseline (Cheng)
1% 150
Ocean heat content change in upper
0% 100 700 m vs 1955-2006 baseline (NOAA)
-1% 50
-2% 0
-3% -50
-4% -100
Emerging countries, Developed countries, Req. annual decline in -150
annual emissions annual emissions developed country 1958 1964 1969 1974 1979 1984 1989 1994 1999 2004 2009 2014 2019
changes, 2007-2018 changes, 2007-2018 emissions to keep Source: Cheng, L. et al., Advances in Atmospheric Sciences; Dahlman and
Source: BP Statistical Review of World Energy. 2019. global emissions flat Lindsey, National Oceanic and Atmospheric Administration. February 2020.
3How might developed and developing countries accelerate the pace of de-carbonization? The
visual below shows how primary energy is used to generate electricity on the left; and on the right; the
composition of all energy consumed including electricity, broken down by end-user1.
Global electricity generation, and its contribution to total energy consumed by end-users
Electricity generation, quad. BTU Energy consumed by end-users, quad. BTU
Key Stats
250 250
Grey = energy losses from thermal conversion,
power plant consumption & transmission Renewable
Electricity is just 17% of global energy
consumed by end-users
200 200
Hydro 18% Renewables Nat gas Decarbonization via renewables
Wind/Solar 11% 30%
mostly confined to electricity, with
Nuclear
150 Nuclear 11% 150 some industrial use
Coal Renewables account for 30% of
100 Coal 100 electricity, and 11% of total energy
consumed by end-users
Coal 34% Nat gas
Petroleum
50 50
Petroleum Coal Fossil fuels used in electricity
Petroleum generation represent 30% of all fossil
Nat Gas
Nat Gas 23% Electricity Electricity fuel use
0 Petroleum
Primary ...is converted into 0 Industrial sector is by far the greatest
energy electricity Industrial Transport Resid/Comm consumer of energy
Source: Energy Information Administration, J.P. Morgan Asset Management. 2019. As per BP/EIA convention, primary energy for nuclear power is derived by
assuming 38% thermal conversion. For renewables, primary energy conversion only reflects transmission losses.
Key takeaways: so far, de-carbonization has mostly taken place on the grid. The 17% share of electricity
in global energy consumption limits de-carbonization potential from the grid alone; electricity and de-
carbonization will have to make substantial inroads in industrial use as well. While technologies are now
available to achieve partial electrification of certain industrial processes, evidence of such transitions are
very limited, even in jurisdictions with carbon taxes2. The electrification of industry must obey
chemical and physical laws as well as economic ones, which we discuss this year in Section 1.
On transportation, there’s a plan in many countries for rapid electric vehicle adoption, but the jury is out
regarding how fast it will occur. In 2019, the EV share of global light vehicle purchases was 2.5%, while
in the US the EV share was 1.9% (both shares have risen from ~1.2% in 2017); that sounds more like a
skirmish than a revolution to me.
And finally, the issue of carbon sequestration. After 20 years in development, carbon capture facilities only
store 0.1% of global emissions every year, and there isn’t even a viable blueprint yet for direct air capture
or other forms of CO2 mineralization at meaningful scales. Even something straightforward and beneficial
like reforestation is often magnified way beyond its actual potential, a topic we discuss this year as well.
1
Regionally, there are only modest differences in the charts above; see Appendix Table on page 34. Importantly,
electricity represents less than 25% of energy consumption in every major region.
2
There are roughly 60 carbon pricing initiatives around the world, covering 15% of global GHG emissions (note that
carbon taxes and cap/trade systems only apply to a subset of a country’s emissions; power and industry are usually
included, while transport, buildings, waste and agriculture are often not). Carbon prices per tonne vary widely: $2
(Japan, Mexico), $18 (California), $30 (EU), $50 (France), $120 (Sweden).
4With that background, here are the topics discussed in this year’s Eye on the Market energy
paper on its tenth anniversary.
Click here to read the full document
Table of Contents
1. The Ten Energy Commandments…………………………………………....................................................7
Ten energy and de-carbonization one-pagers to share with clients, friends and family. Topics include the
pace of renewable energy adoption, electrification of industry, utility-scale energy storage, transmission
bottlenecks, carbon capture, reforestation, ride-hailing, dietary choices and the “hydrogen economy”
2. Peak US energy independence? Pressures on the US shale industry intensify…………………………17
In 2019 the United States achieved its greatest level of energy independence on record, but financial and
environmental pressures may bring this independence era to an end
3. Mountains vs Molehills, 2020: de-carbonization of steel, and deep geothermal energy……………25
The latest installment in our series deconstructing de-carbonization ideas reported in the press
4. Oil & gas equity market underperformance: stranded asset risks or supply shock?............................29
Some believe that stranded asset risks explain the oil & gas sector’s dreadful performance over the last 5
years. A closer look suggests that loss of capital discipline and a supply shock are equally responsible
5. Maiming the Swamp: Trump and the Environment………………………………………………………....33
The latest tally of Trump administration rollbacks of environmental rules and regulations
__________________________________________________________________________________________
Links to select topics from prior Eye on the Market energy editions
Germany and Energiewende: A dispassionate assessment (2019)
Wildfires: anthropogenic climate change and risks for utilities in fire-prone areas (2019)
Electric vehicles: a 2% or a 20% solution? (2018)
High voltage direct current lines: China leads, US lags (2018)
The Dream Team rebuttal of the Jacobson “100% renewable electricity by 2050” plan (2018)
Better safe than sorry: sea level rise, coastal exposure and flood mitigation (2018)
Hydraulic fracturing: the latest from the EPA and some conflicting views from its Advisory Board (2017)
Forest biomass: not as green as you might think (2017)
The myth of carbon-free college campuses (2017)
Distributed solar power and utility billing changes which increase the cost (2016)
US hydropower: how much potential for expansion? (2016)
Nuclear power: skyrocketing costs in the developed world (2014 and 2015)
5Acknowledgements
Our energy Eye on the Market is overseen by Vaclav Smil, Distinguished Professor Emeritus in the Faculty
of Environment at the University of Manitoba and a Fellow of the Royal Society of Canada. His inter-
disciplinary research includes studies of energy systems (resources, conversions and impact), environmental
change (particularly global biogeochemical cycles), and the history of technical advances and interactions
among energy, environment, food, economy, and population. He is the author of more than 40 books (the
latest one, Growth, was published by the MIT Press in September 2019 and the next one, Numbers Don’t
Lie, is coming out in September 2020) and more than 400 papers on these subjects and has lectured in
North America, Europe, and Asia. In 2010, Foreign Policy magazine listed him among the 100 most
influential global thinkers. In 2015, he received the OPEC award for research, in 2019 American Energy
Society named him Energy Writer of the Year, and he is described by Bill Gates as his favorite author.
We also appreciate feedback we received on various sections from scientists and researchers at the
National Renewable Energy Laboratory, the Lawrence Berkeley National Laboratory, the Imperial College
of London Centre for Environmental Policy, the Rockefeller University Program for the Human Environment,
the Lund University Department of Human Ecology, Nanjing University, the Duke University Nicholas School
of the Environment and the University of California Riverside Earth and Planetary Sciences Department.
Acronyms
BTU British thermal unit; CCS carbon capture and storage; CHP Combined heat and power; CIS
Confederation of Independent States; CO2 carbon dioxide; CSP concentrated solar power; E&P exploration
and production; EIA Energy Information Agency; EPA Environmental Protection Agency; EV electric
vehicle; FERC Federal Energy Regulatory Commission; FP flowback and produced water; GHG greenhouse
gas emissions; GJ gigajoule; GW gigawatt; GWPC Groundwater Protection Council; HVAC Heating,
ventilation and air conditioning; HVDC high voltage direct current; HY high yield; IAEE International
Association for Energy Economics; IEA International Energy Agency; IFPEN French Institute of Petroleum;
IPCC Intergovernmental Panel on Climate Change; IRENA International Renewable Energy Agency; ISO
independent system operator; ITC Investment Tax Credit; kg kilogram; km kilometer; kW kilowatt; kWh
kilowatt-hour; LBNL Lawrence Berkeley National Laboratory; LNG liquefied natural gas; m3 cubic meter;
MISO Midcontinent Independent System Operator; Mt metric tonnes; Mtoe million tons of oil equivalent;
MW megawatt; MWh megawatt-hour; NGL natural gas liquids; NREL National Renewable Energy Lab;
OECD Organization for Economic Cooperation and Development; OSHA US Occupational Safety and
Health Administration; PEM Polymer electrolyte membrane; PPA Power Purchase Agreement; TWh
terawatt-hour; USGS US Geological Survey; VMT vehicle miles traveled
6IMPORTANT INFORMATION The views, opinions and estimates expressed herein constitute Michael Cembalest’s judgment based on current market conditions and are subject to change without notice. Information herein may differ from those expressed by other areas of J.P. Morgan. This information in no way constitutes J.P. Morgan Research and should not be treated as such. The views contained herein are not to be taken as advice or a recommendation to buy or sell any investment in any jurisdiction, nor is it a commitment from J.P. Morgan or any of its subsidiaries to participate in any of the transactions mentioned herein. Any forecasts, figures, opinions or investment techniques and strategies set out are for information purposes only, based on certain assumptions and current market conditions and are subject to change without prior notice. All information presented herein is considered to be accurate at the time of production. This material does not contain sufficient information to support an investment decision and it should not be relied upon by you in evaluating the merits of investing in any securities or products. In addition, users should make an independent assessment of the legal, regulatory, tax, credit and accounting implications and determine, together with their own professional advisers, if any investment mentioned herein is believed to be suitable to their personal goals. Investors should ensure that they obtain all available relevant information before making any investment. It should be noted that investment involves risks, the value of investments and the income from them may fluctuate in accordance with market conditions and taxation agreements and investors may not get back the full amount invested. Both past performance and yields are not reliable indicators of current and future results. Non-affiliated entities mentioned are for informational purposes only and should not be construed as an endorsement or sponsorship of J.P. Morgan Chase & Co. or its affiliates. For J.P. Morgan Asset Management Clients: J.P. Morgan Asset Management is the brand for the asset management business of JPMorgan Chase & Co. and its affiliates worldwide. To the extent permitted by applicable law, we may record telephone calls and monitor electronic communications to comply with our legal and regulatory obligations and internal policies. Personal data will be collected, stored and processed by J.P. Morgan Asset Management in accordance with our privacy policies at https://am.jpmorgan.com/global/privacy. ACCESSIBILITY For U.S. only: If you are a person with a disability and need additional support in viewing the material, please call us at 1-800-343-1113 for assistance. This communication is issued by the following entities: In the United States, by J.P. Morgan Investment Management Inc. or J.P. Morgan Alternative Asset Management, Inc., both regulated by the Securities and Exchange Commission; in Latin America, for intended recipients’ use only, by local J.P. Morgan entities, as the case may be.; in Canada, for institutional clients’ use only, by JPMorgan Asset Management (Canada) Inc., which is a registered Portfolio Manager and Exempt Market Dealer in all Canadian provinces and territories except the Yukon and is also registered as an Investment Fund Manager in British Columbia, Ontario, Quebec and Newfoundland and Labrador. In the United Kingdom, by JPMorgan Asset Management (UK) Limited, which is authorized and regulated by the Financial Conduct Authority; in other European jurisdictions, by JPMorgan Asset Management (Europe) S.à r.l. In Asia Pacific (“APAC”), by the following issuing entities and in the respective jurisdictions in which they are primarily regulated: JPMorgan Asset Management (Asia Pacific) Limited, or JPMorgan Funds (Asia) Limited, or JPMorgan Asset Management Real Assets (Asia) Limited, each of which is regulated by the Securities and Futures Commission of Hong Kong; JPMorgan Asset Management (Singapore) Limited (Co. Reg. No. 197601586K), which this advertisement or publication has not been reviewed by the Monetary Authority of Singapore; JPMorgan Asset Management (Taiwan) Limited; JPMorgan Asset Management (Japan) Limited, which is a member of the Investment Trusts Association, Japan, the Japan Investment Advisers Association, Type II Financial Instruments Firms Association and the Japan Securities Dealers Association and is regulated by the Financial Services Agency (registration number “Kanto Local Finance Bureau (Financial Instruments Firm) No. 330”); in Australia, to wholesale clients only as defined in section 761A and 761G of the Corporations Act 2001 (Commonwealth), by JPMorgan Asset Management (Australia) Limited (ABN 55143832080) (AFSL 376919). For all other markets in APAC, to intended recipients only. For J.P. Morgan Private Bank Clients: ACCESSIBILITY J.P. Morgan is committed to making our products and services accessible to meet the financial services needs of all our clients. Please direct any accessibility issues to the Private Bank Client Service Center at 1-866-265-1727. LEGAL ENTITY, BRAND & REGULATORY INFORMATION In the United States, bank deposit accounts and related services, such as checking, savings and bank lending, are offered by JPMorgan Chase Bank, N.A. Member FDIC. JPMorgan Chase Bank, N.A. and its affiliates (collectively “JPMCB”) offer investment products, which may include bank-managed investment accounts and custody, as part of its trust and fiduciary services. Other investment products and services, such as brokerage and advisory accounts, are offered through J.P. Morgan Securities LLC (“JPMS”), a member of FINRA and SIPC. Annuities are made available through Chase Insurance Agency, Inc. (CIA), a licensed insurance agency, doing business as Chase Insurance Agency Services, Inc. in Florida. JPMCB, JPMS and CIA are affiliated companies under the common control of JPMorgan Chase & Co. Products not available in all states. In Luxembourg, this material is issued by J.P. Morgan Bank Luxembourg S.A. (JPMBL), with registered office at European Bank and Business Centre, 6 route de Treves, L-2633, Senningerberg, Luxembourg. R.C.S Luxembourg B10.958. Authorised and regulated by Commission de Surveillance du Secteur Financier (CSSF) and jointly supervised by the European Central Bank (ECB) and the CSSF. J.P. Morgan Bank Luxembourg S.A. is authorized as a credit institution in accordance with the Law of 5th April 1993. In the United Kingdom, this material is issued by J.P. Morgan Bank Luxembourg S.A– London Branch. Prior to Brexit,(Brexit meaning that the UK leaves the European Union under Article 50 of the Treaty on European Union, or, if later, loses its ability to passport financial services between the UK and the remainder of the EEA), J.P. Morgan Bank Luxembourg S.A– London Branch is subject to limited regulation by the Financial Conduct Authority and the Prudential Regulation Authority. Details about the extent of our regulation by the Financial Conduct Authority and the Prudential Regulation Authority are available from us on request. In the event of Brexit, in the UK, J.P. Morgan Bank Luxembourg S.A.– London Branch is authorised by the Prudential Regulation Authority, subject to regulation by the Financial Conduct Authority and limited regulation by the Prudential Regulation Authority. Details about the extent of our regulation by the Prudential Regulation Authority are available from us on request. In Spain, this material is distributed by J.P. Morgan Bank Luxembourg S.A., Sucursal en España, with registered office at Paseo de la Castellana, 31, 28046 Madrid, Spain. J.P. Morgan Bank Luxembourg S.A., Sucursal en España is registered under number 1516 within the administrative registry of the Bank of Spain and supervised by the Spanish Securities Market Commission (CNMV). In Germany, this material is distributed by J.P. Morgan Bank Luxembourg S.A., Frankfurt Branch, registered office at Taunustor 1 (TaunusTurm), 60310 Frankfurt, Germany, jointly supervised by the Commission de Surveillance du Secteur Financier (CSSF) and the European Central Bank (ECB), and in certain areas also supervised by the Bundesanstalt für Finanzdienstleistungsaufsicht (BaFin). In Italy, this material is distributed by J.P. Morgan Bank Luxembourg S.A– Milan Branch, registered office at Via Catena Adalberto 4, Milan 20121, Italy and regulated by Bank of Italy and the Commissione Nazionale per le Società e la Borsa
(CONSOB). In the Netherlands, this material is distributed by J.P. Morgan Bank Luxembourg S.A., Amsterdam Branch, with registered office at World Trade
Centre, Tower B, Strawinskylaan 1135, 1077 XX, Amsterdam, The Netherlands. J.P. Morgan Bank Luxembourg S.A., Amsterdam Branch is authorised and
regulated by the Commission de Surveillance du Secteur Financier (CSSF) and jointly supervised by the European Central Bank (ECB) and the CSSF in
Luxembourg; J.P. Morgan Bank Luxembourg S.A., Amsterdam Branch is also authorised and supervised by De Nederlandsche Bank (DNB) and the Autoriteit
Financiële Markten (AFM) in the Netherlands. Registered with the Kamer van Koophandel as a branch of J.P. Morgan Bank Luxembourg S.A. under registration
number 71651845. In Denmark, this material is distributed by J.P. Morgan Bank Luxembourg, Copenhagen Br, filial af J.P. Morgan Bank Luxembourg S.A. with
registered office at Kalvebod Brygge 39-41, 1560 København V, Denmark. J.P. Morgan Bank Luxembourg, Copenhagen Br, filial af J.P. Morgan Bank Luxembourg
S.A.is authorised and regulated by Commission de Surveillance du Secteur Financier (CSSF) and jointly supervised by the European Central Bank (ECB) and the
CSSF. J.P. Morgan Bank Luxembourg, Copenhagen Br, filial af J.P. Morgan Bank Luxembourg S.A. is also subject to the supervision of Finanstilsynet (Danish FSA)
and registered with Finanstilsynet as a branch of J.P. Morgan Bank Luxembourg S.A. under code 29009. In Sweden, this material is distributed by J.P. Morgan
Bank Luxembourg S.A. - Stockholm Bankfilial, with registered office at Hamngatan 15, Stockholm, 11147, Sweden. J.P. Morgan Bank Luxembourg S.A. -
Stockholm Bankfilial is authorised and regulated by Commission de Surveillance du Secteur Financier (CSSF) and jointly supervised by the European Central Bank
(ECB) and the CSSF. J.P. Morgan Bank Luxembourg S.A., Stockholm Branch is also subject to the supervision of Finansinspektionen (Swedish FSA). Registered
with Finansinspektionen as a branch of J.P. Morgan Bank Luxembourg S.A.. In France, this material is distributed by JPMorgan Chase Bank, N.A. (“JPMCB”),
Paris branch, which is regulated by the French banking authorities Autorité de Contrôle Prudentiel et de Résolution and Autorité des Marchés Financiers. In
Switzerland, this material is distributed by J.P. Morgan (Suisse) SA, which is regulated in Switzerland by the Swiss Financial Market Supervisory Authority
(FINMA).
In Hong Kong, this material is distributed by JPMCB, Hong Kong branch. JPMCB, Hong Kong branch is regulated by the Hong Kong Monetary Authority and the
Securities and Futures Commission of Hong Kong. In Hong Kong, we will cease to use your personal data for our marketing purposes without charge if you so
request. In Singapore, this material is distributed by JPMCB, Singapore branch. JPMCB, Singapore branch is regulated by the Monetary Authority of Singapore.
Dealing and advisory services and discretionary investment management services are provided to you by JPMCB, Hong Kong/Singapore branch (as notified to
you). Banking and custody services are provided to you by JPMCB Singapore Branch. The contents of this document have not been reviewed by any regulatory
authority in Hong Kong, Singapore or any other jurisdictions. This advertisement has not been reviewed by the Monetary Authority of Singapore. JPMorgan
Chase Bank, N.A., a national banking association chartered under the laws of the United States, and as a body corporate, its shareholder’s liability is limited.

JPMorgan Chase Bank, N.A. (JPMCBNA) (ABN 43 074 112 011/AFS Licence No: 238367) is regulated by the Australian Securities and Investment Commission and
the Australian Prudential Regulation Authority. Material provided by JPMCBNA in Australia is to “wholesale clients” only. For the purposes of this paragraph the
term “wholesale client” has the meaning given in section 761G of the Corporations Act 2001 (Cth). Please inform us if you are not a Wholesale Client now or if
you cease to be a Wholesale Client at any time in the future.

JPMS is a registered foreign company (overseas) (ARBN 109293610) incorporated in Delaware, U.S.A. Under Australian financial services licensing requirements,
carrying on a financial services business in Australia requires a financial service provider, such as J.P. Morgan Securities LLC (JPMS), to hold an Australian
Financial Services Licence (AFSL), unless an exemption applies. JPMS is exempt from the requirement to hold an AFSL under the Corporations Act 2001 (Cth)
(Act) in respect of financial services it provides to you, and is regulated by the SEC, FINRA and CFTC under US laws, which differ from Australian laws.
Material provided by JPMS in Australia is to “wholesale clients” only. The information provided in this material is not intended to be, and must not be,
distributed or passed on, directly or indirectly, to any other class of persons in Australia. For the purposes of this paragraph the term “wholesale client” has the
meaning given in section 761G of the Act. Please inform us immediately if you are not a Wholesale Client now or if you cease to be a Wholesale Client at any
time in the future.
This material has not been prepared specifically for Australian investors. It:
may contain references to dollar amounts which are not Australian dollars;
may contain financial information which is not prepared in accordance with Australian law or practices;
may not address risks associated with investment in foreign currency denominated investments; and
does not address Australian tax issues.

With respect to countries in Latin America, the distribution of this material may be restricted in certain jurisdictions. We may offer and/or sell to you securities
or other financial instruments which may not be registered under, and are not the subject of a public offering under, the securities or other financial regulatory
laws of your home country. Such securities or instruments are offered and/or sold to you on a private basis only. Any communication by us to you regarding
such securities or instruments, including without limitation the delivery of a prospectus, term sheet or other offering document, is not intended by us as an offer
to sell or a solicitation of an offer to buy any securities or instruments in any jurisdiction in which such an offer or a solicitation is unlawful. Furthermore, such
securities or instruments may be subject to certain regulatory and/or contractual restrictions on subsequent transfer by you, and you are solely responsible for
ascertaining and complying with such restrictions. To the extent this content makes reference to a fund, the Fund may not be publicly offered in any Latin
American country, without previous registration of such fund´s securities in compliance with the laws of the corresponding jurisdiction. Public offering of any
security, including the shares of the Fund, without previous registration at Brazilian Securities and Exchange Commission–CVM is completely prohibited. Some
products or services contained in the materials might not be currently provided by the Brazilian and Mexican platforms.

References to “J.P. Morgan” are to JPM, its subsidiaries and affiliates worldwide. “J.P. Morgan Private Bank” is the brand name for the private banking business
conducted by JPM.

This material is intended for your personal use and should not be circulated to or used by any other person, or duplicated for non-personal use, without our
permission. If you have any questions or no longer wish to receive these communications, please contact your J.P. Morgan representative.
© 2020 JPMorgan Chase & Co. All rights reserved.
You can also read


