MICROSOFT'S "BING IT ON" CHALLENGE CLAIMS
←
→
Page content transcription
If your browser does not render page correctly, please read the page content below
A RANDOMIZED EXPERIMENT
                ASSESSING THE ACCURACY OF
         MICROSOFT’S “BING IT ON” CHALLENGE CLAIMS

                                         Ian Ayres*
                                       Emad Atiq**
                                        Sheng Li**
                                       Michelle Lu**
                                     Christine Tsang***
                                      & Tom Maher**
Abstract: In advertisements associated with its ―Bing It On‖ campaign, Microsoft claimed that
―people preferred Bing web search results nearly 2:1 over Google in blind comparison tests.‖ We
tested Microsoft‘s claims by way of a randomized experiment involving U.S.-based MTurk
subjects and conducted on Microsoft‘s own www.bingiton.com website. We found that (i) a
statistically-significant majority of participants preferred Google search results to Bing search
results (53% to 41%); and (ii) participants were significantly less likely to prefer Bing results
when randomly assigned to use popular search terms or self-selected search terms instead of the
search terms Microsoft recommends test-takers employ on its website. Our findings suggest that
some of the claims implicit in Microsoft‘s advertisements warrant legal scrutiny. The Bing It On
Ad Campaign may be viewed as (falsely) implying that: (i) Microsoft‘s claims about consumer
preferences for search engines were based on a generalizable study; (ii) the preferences of five
million individuals who have taken the Bing It On Challenge online are either consistent with or
the basis for Microsoft‘s claim that consumers prefer Bing ―nearly 2:1‖; and (iii) the search
terms Microsoft recommends people use when taking the online challenge are not biased in favor
of Bing. Our findings suggest that each of these implicit claims is likely false and might provide
the basis for a viable Lanham Act claim by Google.

*William K. Townsend Professor, Yale Law School. ian.ayres@yale.edu.

**Yale Law School, J.D. 2014.

***Yale Law School, J.D. 2013.

                                                                                                1
TABLE OF CONTENTS
I. INTRODUCTION ...................................................................................................................................................3
HISTORY OF BING IT ON ............................................................................................................................................3
II. METHODOLOGY ................................................................................................................................................7
Reliability & Representativeness .........................................................................................................................9
III. FINDINGS .......................................................................................................................................................... 12
IV. LEGAL IMPLICATIONS ................................................................................................................................. 17
THE LANHAM ACT................................................................................................................................................... 17
A. Analysis of Microsoft‟s Express Claims. ...................................................................................................... 20
B. Analysis of Representations Implicit in Microsoft‟s Express Claims Regarding the General Preferences of
Consumers.......................................................................................................................................................... 21
C. Analysis of Microsoft‟s Implicit Representation that Its Express Claims were Based on a Sample Size of 5
Million ................................................................................................................................................................ 22
D. Analysis of Microsoft‟s Unstated Implication that the Bing It On Challenge is Free from Bias ................. 24
V. CONCLUSION .................................................................................................................................................... 25
2I. INTRODUCTION
One year ago, Microsoft launched its ―Bing It On‖ Challenge campaign. Advertisements
associated with the campaign initially claimed that users prefer Microsoft‘s search engine Bing
over Google at a nearly 2:1 ratio.1 Microsoft based this initial claim on a single, undisclosed
comparison study with fewer than 1000 participants. The advertisements continue to invite
Internet users to take a blind comparison test for themselves at Bingiton.com.2
We assess Microsoft‘s claims by conducting a randomized, blind comparison study
through the Bing It On webpage. We find Microsoft‘s 2:1 claim to be implausible and
misleading. In light of our findings, we analyze Microsoft‘s potential liability to competitors
under the Lanham Act for deceptive advertising. Our study offers an example of how large-scale,
on-line experiments can prove to be an effective tool for detecting and deterring deceptive
advertising.
History of Bing It On
Announced in May of 2009, and released to the public in June of the same year,
Microsoft‘s Bing search engine is the second-most widely used online search tool in the United
States (with a 2013 market share of 16.7 percent, behind market leader Google at 67 percent).3
Since the search engine‘s debut, Microsoft has initiated major marketing campaigns to promote
Bing, ranging from the Bing Rewards campaign in 2010 to the more recent ―Bing It On‖
1
Matt Wallaert, Bing Your Brain: Test, Then Test Again, BING BLOGS (Feb. 6, 2013),
http://www.bing.com/blogs/site_blogs/b/search/archive/2013/02/06/bing-your-brain-test-then-test-
again.aspx; People Chose Bing Web Search Results Over Google Nearly 2:1 in Blind Comparison Tests –
Really??, BING BLOGS (Sept. 5, 2012), http://www.bing.com/blogs/site_blogs/b/thedetails/archive/2012
/09/05/bingchallenge.aspx [hereinafter People Chose Bing].
2
Wallaert, supra note 1; People Chose Bing, supra note 1.
3
Press Release, COMSCORE, INC., comScore Releases February 2013 U.S. Search Engine Rankings,
(March 13, 2013), http://www.comscore.com/Insights/Press_Releases/2013/3/comScore_Releases
_February_2013_U.S._Search_Engine_Rankings.
3challenge.4 Modeled after the classic ―Pepsi Challenge‖ of the 1970s, ―Bing It On‖ challenges
users to compare Bing directly against Google Search in a variety of blind searches. 5 Microsoft
simultaneously launched the campaign through television and Internet advertising. The
campaign encourages Internet users ―to break the Google habit.‖6 A few months after launching,
Microsoft television advertising urged viewers to ―join the 5 million people who've visited the
challenge.‖7
According to Dr. Harry Shum, Corporate Vice President of Bing Research and
Development, the Bing It On challenge grew out of internal testing of Bing search algorithms,
and a sense within the Bing research team that Bing was ready to take on Google head-to-head.8
Microsoft commissioned Answers Research to conduct a study of nearly 1,000 participants
directly comparing the two search engines.9 The study asked participants to enter a series of ten
search terms of their choosing into a single search bar and then presented the participants with
two unidentifiable browser windows set next to each other, one side displaying Google search
results and the other Bing search results. Participants recorded their preferred search results.
While Microsoft has not released the full methodology and analysis of the study, it reports that
participants preferred Bing over Google ―nearly 2:1 in the blind comparison tests.‖10
4
Mike Nichols, Take the Bing It On Challenge!, BING BLOGS (Sept. 6, 2012), http://www.bing.com/blogs
/site_blogs/b/search/archive/2012/09/06/challenge-announce.aspx.
5
Salvador Rodriguez, The Bing Challenge: Microsoft Pulls Pepsi Trick on Google, L.A. TIMES, Sept. 6,
2012, http://articles.latimes.com/2012/sep/06/business/la-fi-tn-bing-it-on-20120906.
6
Tom Warren, Microsoft Launches Nationwide „Bing It On‟ TV Campaign to Challenge Google, THE
VERGE (Sept. 6, 2012, 10:27 AM), http://www.theverge.com/2012/9/6/3296562/bing-it-on-microsoft-
google-challenge-ads.
7
bing, Bing It On Challenge, YOUTUBE (Oct. 2, 2012), http://www.youtube.com/watch?v=KNWuOJXP-
R4.
8
Harry Shum, Search Quality Insights: Behind the Bing It On Challenge, BING BLOGS (Sept. 6, 2012),
http://www.bing.com/blogs/site_blogs/b/searchquality/archive/2012/09/06/sqibehindbingchallenge.aspx.
9
Id.
10
Id.
4Microsoft released a simplified online version of this test at www.bingiton.com, which
invites users to conduct a similar blind comparison using only five queries. Launched primarily
as an advertising vehicle, bingiton.com prominently featured the 2:1 claim derived from the
Answers Research study when it was launched. Microsoft representatives noted in October 2012
that no specific comparison data from the website was being recorded. Bing General Manager
Adam Sohn reported to WebProNews:
―We aren‘t keeping track of the results from the Bing It On tool, because it‘s
non-scientific and was intended to be a fun way for customers to experiment with
both search engines, seeing web search results side-by-side from both Bing and
Google, hopefully noticing the progress Bing has made over the past few years.‖11
As of April 2013, however, Microsoft has altered the language on the official Bing It On website
by replacing references to the near 2:1 ratio with the language, ―in blind tests, people preferred
Bing over Google for the web‘s top searches.‖12
Several online blogs and news magazines have sampled the bingiton.com website and
shared their experiences.13 The International Business Times, for example, ran two informal
trials, with Google ―c[oming] out ahead in both cases, winning 3:2 in the first test and 4:1 in the
second.‖14 Paul Shapiro‘s blog reported an analysis of users posting their Bing It On results on
Twitter—posts Microsoft itself solicited—that yielded a nearly 72 percent preference for Google,
11
Chris Crum, Bing: We Aren‟t Keeping Track of the Results from the Bing It On Tool, WEBPRONEWS
(Oct. 3, 2012), http://www.webpronews.com/bing-we-arent-keeping-track-of-the-results-from-the-bing-it-
on-tool-2012-10.
12
BING IT ON, http://www.bingiton.com (accessed April 6, 2013).
13
See, e.g., Bing It On Rigged?, NYPHONEJACKS.COM (Feb. 17, 2013), http://blog.nyphonejacks.com
/2013/02/bing-it-on-rigged.html; Tuan Mai, Bing vs Google: The Bing It On Challenge, TOM‘S
HARDWARE (Sept. 7, 2012), http://www.tomshardware.com/news/Bing-Google-Challenge-
Search,17421.html. For a Bing victory, see Melanie Pinola, “Bing It On” Shows You When Bing Is Most
Useful, LIFE HACKER (Oct. 3, 2012), http://lifehacker.com/5948600/is-bing-a-better-search-engine-for-
you-take-the-bing-it-on-test-to-find-out.
14
Christopher Zara, Bing vs. Google – Microsoft‟s Pepsi Challenge Backfires, INT‘L BUS. TIMES ONLINE
(Sept. 7, 2012, 12:32 PM), http://www.ibtimes.com/bing-vs-google-microsoft‘s-pepsi-challenge-
backfires-780715.
5with a sample size of 286.15 These informal trials have cast some doubt on Microsoft's original
claim that Bing is preferred to Google 2:1.
The press and bloggers have also criticized the methodology of the Bing It On campaign.
For example, PunditPress.com has noted that the search results pages generated by the Bing It
On site differ slightly from the same searches run on the main bing.com and google.com web
sites.16 Joe Wilcox of betanews.com notes that the Bing It On site strips away location and
social information, key functional components of both stand-alone search engines.17 Some savvy
users even claim to be able to distinguish the two search results solely on the basis of page
formatting.18 A study by the Catalyst Group found that users preferred Bing‘s visual design over
Google‘s, but also found that most thought the two search engines produced equally relevant
results, and overall, indicated a desire to continue to use Google as their primary search engine.19
The concerns raised about Microsoft‘s campaign warrant a systematic investigation into
the reliability of its claims regarding the Bing It On challenge, and the campaign‘s likely effect
on consumers. This paper attempts to do just this.
15
Paul N. Shapiro, Bing It On! Data Says Google Wins the Bing Search Challenge, PAUL SHAPIRO‘S
SOC. MEDIA & TECH. BLOG (Sept. 12, 2012), http://blog.paulnshapiro.com/bingiton-google-wins/.
16
Aureliuast, “The Bing Challenge?” Yes, It's Rigged . . . Or, at the Very Least, Something is Very
Wrong, PUNDIT PRESS (Feb. 12, 2013, 10:37 AM), http://www.punditpress.com/2013/02/the-bing-
challenge-yes-its-rigged-or-at.html.
17
Joe Wilcox, „Bing it On‟ Is a Real Turn-off, BETANEWS (Sept. 6, 2012), http://betanews.com/2012/09
/06/bing-it-on-is-a-real-turn-off.
18
Bingiton . . . Where‟s My xBox?, A DOG‘S LIFE IN PORTLAND OREGON (Sept. 16, 2012, 11:38 PM),
http://gerrrg.blogspot.com/2012/09/bingitonwheres-my-xbox.html.
19
Google vs. Bing Search Engine Preference, CATALYST GROUP (June 2009),
http://www.catalystnyc.com/cofactors/wp-content/uploads/2009/06/catalyst-eye-tracking-bing-vs-google-
may-2009.pdf. For a more detailed discussion of the Catalyst Group study, see Section I.B of the Web
Appendix, available at http://islandia.law.yale.edu/ayres/Bing-It-On-Web-Appendix.pdf.
6II. METHODOLOGY
Our study employs Amazon‘s Mechanical Turk (MTurk) to test user preferences for Bing
and Google in the Bing It On challenge. MTurk is an online crowdsourcing forum developed and
operated by Amazon in which ―requesters‖ pay human ―workers‖ for human intelligence tasks
(HITs).20 These tasks vary in content and have included proofreading, sorting photographs, and
completing questionnaires. MTurk payments generally range from $0.05 to $5 per task and vary
in accordance with the duration and complexity of the task completed.21 We restricted
participants to MTurk participants who were aged 18 and above with U.S. IP addresses and an
MTurk reliability rating of at least 80%. We tracked the unique MTurk IDs of survey
respondents to eliminate the possibility of duplicate sampling. We initially offered 40 cents per
survey and were able to obtain about 400 responses before the response rate slowed. Thereafter,
we increased the payment to $1 and rapidly reached our target sample size of 1,000. We
conducted the study between January 23 and March 1, 2013.
The study employed a 3x1 design. The study randomly assigned MTurk participants to
one of three experimental groups, asked them to take the ―Bing It On challenge‖ on
www.bingiton.com, and asked them to fill out a questionnaire reporting their results. Members of
the first group were asked to input search terms that were randomly generated from the top 25
Google keywords from 2012.22 Members of the second group were asked to input the search
20
AMAZON.COM, http://www.amazon.com (last visited July 7, 2013).
21
Id.
22
Brandon, Top Google Searches in 2012: The Most Popular Keywords Study v3, Seattle Organic Search
Engine Optimization (April 7, 2012), http://seattleorganicseo.com/sosblog/top-google-searches-in-2012-
the-most-popular-keywords-study-version-3/. Our study did not include search terms related to
pornography. Another company conducted its own analysis of top search terms and reported similar
results. Consumer Search Engine Trends, Experian, http://www.experian.com/hitwise/online-trends-
search-engine.html (last updated July 13, 2013); Matt Tatham, Facebook Was the Top Search Term in
2012 for Fourth Straight Year, Experian (Dec. 20, 2012), http://www.experian.com/blogs /marketing-
7terms suggested by bingiton.com, while members of the third group were asked to use self-
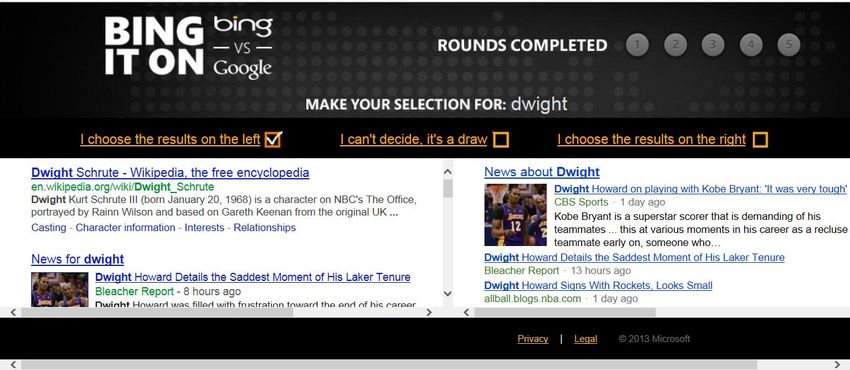
selected terms. All groups entered five search terms into the bingiton.com site. The website
generates panels of Bing and Google search results, juxtaposed and stripped of identifying
features. The panels for each search randomly placed the Bing and Google results on the right or
left side of the screen, as shown in Figure 1 below. Participants reported to the Bing It On site
whether they preferred one panel over the other or preferred the two panels equally (a ―tie‖).
Figure 1: Bing It On Website Search Results Panels
At the end of five searches, the Bing It On site revealed the preferred search engine for
each of the five searches.23 The study asked participants to report their final results and to
submit a screenshot of the results page for confirmation. At the end of the survey, participants
were asked to report demographic information, including gender, age, race, education, political
ideology, and religious identity.
forward/2012/12/20/facebook-was-the-top-search-term-in-2012-for-fourth-straight-
year/?WT.srch=PR_EMS_TopSearchTerms_122012.
23
The web appendix includes an example of the search screen, the individual search results screen and the
screen showing the identity of the search that produced the preferred result. See Web Appendix, Section
II, available at http://islandia.law.yale.edu/ayres/Bing-It-On-Web-Appendix.pdf.
8Reliability & Representativeness
The use of MTurk for social and behavioral science research has led to several
investigations into the reliability of responses, with encouraging conclusions. These efforts found
that demographic responses were largely truthful,24 that differences in compensation do not
affect the quality of data,25 and that MTurk workers are as attentive as non-Internet participants
of studies involving short tasks (defined as tasks that take no more than five minutes).26 One
recent study cautioned that MTurk workers perform more poorly than college students on tasks
that take longer than fifteen minutes and require attentive reading and English comprehension.
The study found that MTurk workers perform equally well on such tasks in comparison to
community members from a middle class urban neighborhood.27 Additionally, the failure rates of
MTurk workers have been found to be correlated with IP addresses from outside of the United
States.28 By limiting our sample to U.S. residents and requesting a comparatively simple task,
our analysis should not suffer from a deficit of attention or comprehension.
To assess the degree to which our sample represents the population from which Bing
could have plausibly collected data, we compared the demographic make-up of our MTurk
sample with (1) the general U.S. population, and (2) a large Internet sample gathered by Gosling
et. al. in 2004.29 The comparison with a large Internet sample is useful because a large Internet
24
D.G. Rand, The Promise of Mechanical Turk: How Online Labor Markets Can Help Theorists Run
Behavioral Experiments, 299 J. THEORETICAL BIO. 172 (2012).
25
M. Buhrmester et al., Amazon‟s Mechanic Turk: A New Source of Cheap, Yet High-Quality Data?, 6
PERSP. ON PSYCHOL. SCI. 3 (2011).
26
G. Paolacci et al., Running Experiments on Amazon Mechanical Turk, 5 JUDGMENT & DECISION
MAKING 411 (2011).
27
Joseph K. Goodman et al., Data Collection in a Flat World: The Strengths and Weaknesses of
Mechanical Turk Samples, 26 J. BEHAV. DECISION MAKING 213 (2012).
28
Id.
29
Samuel D. Gosling et al., Should We Trust Web-Based Studies?, 59 AM. PSYCHOLOGIST 93 (2004).
9sample might better represent search engine users who are the target of Bing‘s advertisements.
The results of this comparison are summarized in Table 1 below:
Table 1: Demographic Comparison
MTurk Sample U.S. Population Gosling Internet Sample
(N=984) (N >300 million) (N=361,703)30
31
Age 78% younger than 35 48% younger than 35 81% younger than 30
32
Gender 40% Female 51% Female 57% female
33 34
Race 76% White 63% White 77% White
47% with 4-year 29% with 4-year degree
Education degree or higher or higher35 Not reported
36
Religion 54% non-religious 10% non-religious Not reported
48% liberal, 21% liberal,
37
Politics 17% conservative 40% conservative Not reported
We find that our sample over-represents younger people, whites, and males relative to the
general U.S. population. Except for an overrepresentation of men, the sample is consistent with a
large Internet sample along relevant demographic dimensions. We also find that our MTurk
sample is more educated than the U.S. population. While the Gosling Internet survey did not
30
Id.
31
Lindsay M. Howden & Julie A. Meyer, U.S. Census Bureau, Age and Sex Composition: 2010, 2010
Census Briefs, U.S. DEP‘T COM. (May 2011), http://www.census.gov/prod/cen2010/briefs/c2010br-
03.pdf.
32
Id.
33
Asians are also over represented at 12% compared to 5% in the U.S. population
34
Howden & Meyer, supra note 31.
35
U.S. Census Bureau, Table 1: Educational Attainment of the Population 18 Years and Over, by Age,
Sex, Race, and Hispanic Origin: 2012: All Races, U.S. DEP‘T COM., http://www.census.gov/hhes
/socdemo/education/data/cps/2012/tables.html (last updated Jan. 7, 2013).
36
U.S. Religious Landscape Survey: Religious Affiliation: Diverse and Dynamic, PEW F. ON RELIGION &
PUB. LIFE 5 (Feb. 2008), http://religions.pewforum.org/pdf/report-religious-landscape-study-full.pdf.
(includes respondents who are categorized as atheist (1.6%), agnostic (2.4%), or secular unaffiliated
(6.3%). The other categories included Christian (78.4%), other religion (4.7%), religiously unaffiliated,
(5.8%) and ―don‘t know/refused‖ (0.8%)).
37
Lydia Saad, Conservatives Remain the Largest Ideological Group in the U.S., GALLOP.COM (Jan. 12,
2012), http://www.gallup.com/poll/152021/conservatives-remain-largest-ideological-group.aspx.
10measure education attainment, it did use socioeconomic class as a proxy for education and
concluded that higher socioeconomic groups are ―somewhat overrepresented.‖38
Finally, we find large political and religious affiliation gaps between our sample and the
U.S. population. This gap is likely a byproduct of our sample‘s youth bias, and therefore would
show up in Internet samples generally because they also exhibit a youth bias.39 Overall, we
conclude that while our data is not fully representative of the United States population, its
demographic characteristics are generally consistent with online samples of the type that
Microsoft relied upon in its Bing It On studies.40 Our later regressions investigate whether
demographics subgroups exhibit different search preferences.
38
Gosling, supra note 29, at 98 (finding that 32% identified as upper or upper-middle class, while only
15% identified as working-class and only 1% identified as being poor). Sociologists Thompson and
Hickey estimate 16% of America falls in the upper or upper-middle classes and 40-50% fall into the
working or lower class. WILLIAM THOMPSON & JOSEPH HICKEY, SOCIETY IN FOCUS (2005).
39
Younger Americans tend to be more liberal, see David Leonhardt, Old vs. Young, N.Y. TIMES, June 22,
2012, http://www.nytimes.com/2012/06/24/opinion/sunday/the-generation-gap-is-back.html, and less
religious, see Dan Gilgoff, Study: Young Americans Less Religious Than Their Parents, CNN, Feb 17,
2010, http://www.cnn.com/2010/US/02/17/report.millennials.faith/index.html.
40
Wallaert, supra note 1; People Chose Bing, supra note 1.
11III. FINDINGS
We obtained 1,008 Bing It On challenge responses from the MTurk platform and
narrowed our analysis to 985 respondents who submitted screen shots for 4925 searches. The
preference results analyzed at both the respondent level and the search level for each of the three
experimental groups are summarized below:
Table 2: Search Engine Preference for 3 Different Types of Search Terms
Unit of observation = respondent:
All Popular Self-Selected Bing-Suggested
Preference Searches Searches Searches Searches
Bing Wins 400 (41%) 129 (39%) 112 (35%) 159 (48%)
Tie 61 (6%) 19 (6%) 24 (8%) 18 (5%)
Google Wins 524 (53%) 184 (55%) 183 (57%) 157 (47%)
Total 985 332 319 334
Unit of observation = search:
All Popular Self-Selected Bing-Suggested
Preference Searches Searches Searches Searches
Bing Wins 2072 (42%) 673 (41%) 632 (40%) 767 (46%)
Tie 399 (8%) 129 (7.8%) 138 (9%) 132 (8%)
Google Wins 2454 (49%) 858 (52%) 825 (52%) 771 (46%)
Total 4925 1660 1595 1670
Our sample group generally preferred Google to Bing analyzed at both the respondent
level (53% to 41%) and the individual search level (49% to 42%). The preference for Google
was most pronounced when respondents used popular search terms or selected their own search
terms. Respondents who used Bing-suggested search terms preferred Bing and Google in nearly
equal numbers.
Table 3 reports, at both the respondent and individual search level, t-tests of the following
null hypotheses:
12(1) The frequency of Bing wins is equal to the frequency of Google wins. The hypothesis
tests Microsoft‘s current claim that ―in blind tests, people prefer Bing to Google for the
web‘s top searches.‖41
(2) The frequency of Bing wins outnumbers the frequency of Google wins by a 2-to-1
margin. The hypothesis tests Microsoft‘s initial claim that ―people choose Bing web
search results over Google nearly 2-to-1 in blind comparison tests.‖42
Table 3: Statistical Tests of Equal or 2:1 Preference Hypotheses ( ―tie‖ observations exluded)
Unit of observation = respondent:
Type of Search Terms
All Terms Popular Self-Selected Bing-Suggested
Test of null hypothesis 1: frequency of Bing wins = frequency of Google wins
t-stat -4.11*** -3.15*** -4.25*** 0.1123
P(Bing => Google) 0.0000 0.0009 0.0000 0.5447
Test of null hypothesis 2: frequency of Bing wins = twice the frequency of Google wins
t-stat -14.29*** -9.11*** -10.11*** -5.78***
P(Bing= > 2x Google) 0.0000 0.0000 0.0000 0.0000
Unit of observation = search:
Type of Search Terms
All Terms Popular Self-Selected Bing-Suggested
Test of null hypothesis 1: frequency of Bing wins = frequency of Google wins
t-stat -5.70*** -4.76*** -6.00*** -.10
P(Bing => Google) 0.0000 0.0000 0.0000 0.4594
Test of null hypothesis 2: frequency of Bing wins = twice the frequency of Google wins
t-stat -28.11*** -17.84*** -17.88*** -13.11***
P(Bing= > 2x Google) 0.0000 0.0000 0.0000 0.0000
Note: *, **, and *** denote statistical significance to the 0.10, 0.05 and 0.01 levels,
respectively.
41
Wallaert, supra note 1.
42
People Chose Bing, supra note 1.
13Our analysis strongly rejects the possibility that web-users prefer Bing search results to
those of Google by a 2-to-1 margin in general, and for subjects in each of the three test groups.
Subjects who used popular search terms or self-selected search terms had a statistically
significant preference for Google over Bing. Subjects who employed search terms suggested by
Bing did not exhibit a statistically significant preference for either of the two search engines.
Table 4 reports the results of probit regressions at the individual-search level (dropping
―ties‖) testing whether the type of search term used, demographic factors, and payment made to
respondent ($0.40 through the initial phase versus $1.00 through the second) had statistically
significant effects on the likelihood of preferring Bing over Google. The omitted variable for the
treatment group is the popular search term group. The omitted variables for demographic
characteristics are: Gender: Male, Age: 18-25, Race: White, Politics: Liberal, Religion: None,
and Ed: 4yr College.
Table 4: Probit Regression of Bing Preferred Indicator ( ―tie‖ observations exluded)
(1) (2) (3)
Bing_Sug 0.059 0.066 0.065
(2.64)*** (2.94)*** (2.91)***
Self_Sug -0.006 -0.001 -0.002
(0.26) (0.04) (0.11)
Female 0.058 0.058
(3.05)*** (3.07)***
Age_26to34 0.037 0.025
(1.73)* (1.16)
Age_35to54 0.046 0.035
(1.68)* (1.28)
Age_55to64 0.089 0.058
(1.35) (0.91)
Age_Over65 0.122 0.104
(1.05) (0.84)
Race_AfAm 0.079 0.069
(1.99)** (1.75)*
Race_Hispanic 0.003 -0.010
14(0.05) (0.22)
Race_Asian 0.049 0.045
(1.54) (1.40)
Race_NativeAm 0.203 0.183
(2.06)** (1.95)*
Race_PacIslander 0.313 0.323
(1.54) (1.68)*
Race_Other 0.071 0.049
(1.15) (0.78)
Pol_Moderate 0.001 0.004
(0.05) (0.18)
Pol_Conservative 0.036 0.042
(1.27) (1.48)
Pol_Unaff_Indiff 0.034 0.033
(1.09) (1.06)
Politics_Other 0.060 0.053
(0.78) (0.69)
Rel_Christian 0.011 0.004
(0.49) (0.20)
Rel_nonChristian 0.051 0.041
(1.45) (1.17)
Ed_LessthanHS -0.044 -0.023
(0.68) (0.38)
Ed_HSorGED -0.005 -0.004
(0.17) (0.12)
Ed_SomeCollege -0.017 -0.011
(0.74) (0.48)
Ed_2YrCollege 0.037 0.043
(1.19) (1.40)
Ed_Master 0.012 0.003
(0.33) (0.08)
Ed_DocProf 0.024 0.023
(0.39) (0.37)
Wave -0.085
(4.49)***
Predicted P (at X-bar) .4577 .4584 .4582
N 4,526 4,449 4,449
Pseudo R2 .0025 .0134 .0182
Note: z-statistics in parentheses; *, **, and *** denote statistical significance to the 0.10,
0.05 and 0.01 levels, respectively. Standard errors are clustered by respondent. The table
reports the marginal effects derived from probit coefficients (using STATA‘s dprobit
procedure) and thus represent the predicted percentage-point effect on Bing preference of
changing a right-hand indicator from 0 to 1 (while evaluating all other independent
variables at their mean).
15We find across our three nested specifications that using Bing-suggested terms (relative
to popular terms) results in a statistically significant, 6 percentage point increase in the predicted
likelihood of preferring Bing over Google. Females are estimated to be about 6 percentage points
more likely than males to prefer Bing, although they still favored Google over Bing on average
across all experimental groups.43 African-Americans, Asians, Native Americans and Pacific
Islanders were statistically more likely to prefer Bing than whites. Overall, the regressions
suggest a broad consensus among demographic groups in their general preference for the Google
panel over the Bing panel, and in the raw data, there were no substantial race, 44 age, gender or
level-of-payment subgroups that displayed an average preference for Bing.45
In summary, our findings strongly reject the possibility that Internet users would prefer
Bing search results to Google search results at anywhere near a 2-to-1 ratio. We also statistically
reject the weaker claim of people preferring Bing over Google, except when using search terms
suggested by the Bing website, which appear to be biased in favor of Bing when compared to
both popular and self-selected search terms. Even when subjects used Microsoft-selected terms,
our analysis did not find statistically significant evidence of a preference for Bing. In light of
these results, the next section analyzes whether Bing‘s initial claim of a 2-to-1 preference as well
as other explicit and implicit claims represent proscribed deceptive advertisements under Section
43(a) of the Lanham Act.
43
Overall, non-tying female respondents still preferred Google. Of our 393 non-tying female
respondents, 52.7% preferred Google.
44
Two small racial respondent subgroups (Pacific Islanders and Native Americans) show a slight, non-
statistical preference for Bing.
45
However, in the individual search results, African-Americans displayed a slight overall preference for
Bing over Google (121 vs. 107 searches).
16IV. LEGAL IMPLICATIONS
The Lanham Act and the Federal Trade Commission Act (FCT Act) govern false
advertising at the federal level. Section 43(a) of the Lanham Act proscribes ―false or misleading
description . . . [or] representation of fact‖ in commercial advertisements and creates a right of
action for competitors.46 The FTC Act authorizes the Federal Trade Commission (FTC) to
regulate advertisements in order to protect consumers from false advertisements.47 In addition,
numerous state legislatures have passed so called ―baby FTC‖ acts prohibiting unfair and
deceptive trade practices, which include provisions against false or misleading advertisements.48
This Section focuses on Microsoft‘s potential liability as a result of the Bing It On campaign
under the Lanham Act.49
The Lanham Act
Section 43(a) of the Lanham Act creates a private cause of action against false or
misleading advertising.50 Though the statutory text reads that ―any person who believes that he
or she is or is likely to be damaged‖ by false or misleading advertisements can bring suit, federal
46
Lanham Act (Trademark Act of 1946) § 43(a), 15 U.S.C. § 1125(a) (2006) (providing that ―(a)(1) Any
person who, on or in connection with any goods or services . . . uses in commerce any word, term, name,
symbol, device or any combination thereof, or any . . . false or misleading description of fact, or false or
misleading representation of fact, which . . . (B) in commercial advertising or promotion, misrepresents the
nature, characteristics, qualities or geographic origin of his or her or another person‘s goods, service or
commercial activities, shall be liable in a civil action by any person who believes that he or she is or is
likely to be damaged by such act.‖). The Supreme Court in the coming term‘s Lexmark v. Static Control,
387 F.3d 522 (6th Cir. 2004), cert. granted, 133 S. Ct. 2766 (2013), may determine whether other
economic actors have standing to bring Lanham Act deceptive advertising claims.
47
Federal Trade Commission Act § 5, 15 U.S.C. § 45(a)(1) (2006).
48
See, e.g., Colorado Consumer Protection Act, COLO. REV. STAT. ANN. §§ 6-1-101 to 6-1-115 (West
2013); CONN. GEN. STAT. § 42-110a to -110g; Uniform Deceptive Trade Practices Act, GA. CODE ANN.
§§ 10-1-370 to 10-1-375 (West 2013); OHIO REV. CODE ANN. §§ 41.4165.01-4165.04 (West 2013);
Oklahoma Deceptive Trade Practices Act, OKLA. STAT. ANN. tit. 78, §§ 51–55 (West 2013); OR. REV.
STAT. ANN. §§ 646.605-656 (West 2013).
49
Microsoft‘s liability under the FTC Act and baby FTC acts are considered separately in a web
appendix, available at http://islandia.law.yale.edu/ayres/Bing-It-On-Web-Appendix.pdf.
50
Lanham Act (Trademark Act of 1946) § 43(a), 15 U.S.C. § 1125(a) (2006).
17courts have held that consumers lack standing to sue because the act was enacted ―to protect
persons engaged in . . . commerce against unfair competition.‖51 The most obvious plaintiff to
bring a Section 43 case against Microsoft for its Bing It On campaign is Google, the target of the
disfavoring comparison. Other search engine providers, such as Yahoo or Baidu, might also have
standing as competitors of Microsoft.52 In order to prevail in a Section 43(a) action, the plaintiff
must show that defendant‘s advertisement falls under interstate commerce and communicates a
false or misleading message that materially deceives consumers.53
51
Lanham Act § 45, 15 U.S.C. § 1127 (2006). For cases denying consumers the right to sue, see, for
example, Seven-Up Co. v. Coca-Cola Co., 86 F.3d 1379, 1383 n.5 (5th Cir. 1996) (―[W]e have found no
case which suggests that ‗consumers‘ have standing under § 43(a).‖); Stanfield v. Osborne Indus., Inc., 52
F.3d 867, 873 (10th Cir. 1995) (―[T]hus, to have standing for a false advertising claim, the plaintiff must
be a competitor of the defendant and allege competitive injury.‖); Serbin v. Ziebart Int‘l Corp., 11 F.3d
1163, 1177 (3d Cir. 1993) (holding that the consumers, as noncommercial plaintiffs, do not have standing
under the Lanham Act); Colligan v. Activities Club of New York, Ltd., 442 F.2d 686 (2d Cir. 1971)
(analyzing the legislative history and purpose behind § 43(a) and concluding that consumers lacked
standing to bring action under the Lanham Act); Bacon v. Southwest Airlines Co., 997 F. Supp. 775, 780
(N.D. Tex. 1998) (holding that there is no private cause of action for consumers under the false
advertising prong of the Lanham Act).
52
Some Circuits have held that direct competition is not necessary for standing. See Joint Stock Soc‘y v.
UDV N. Am., Inc., 266 F.3d 164 (3d Cir. 2001) (―Section 43(a) is intended to provide a private remedy to
a commercial plaintiff who meets the burden of proving that its commercial interests have been harmed
by a competitor‘s false advertising. This is not to say that a non-competitor never has standing to sue
under this provision; rather the focus is on protecting commercial interests that have been harmed by a
competitor‘s false advertising and securing to the business community the advantages of reputation and
good will by preventing their diversion from those who have created them tot hose who have not.‖)
(citations omitted); Havana Club Holding, S.A. v. Galleon S.A., 203 F.3d 116, 130 (2d Cir. 2000). Other
Circuits have held that plaintiffs have standing only against ―competitive injuries.‖ See Barrus v.
Sylvania, 55 F.3d 468, 470 (9th Cir. 1995); Stanfield, 52 F.3d at 873; L.S. Heath & Son, Inc. v. AT&T
Info. Sys., Inc., 9 F.3d 561 (7th Cir. 1993) (denying standing to a noncompetitor).
53
Federal courts repeatedly numerated the elements of a Section 43(a) claim as ―(1) a false statement of
fact by the defendant in a commercial advertisement about its own or another‘s product; (2) the statement
actually deceived or has the tendency of deceive a substantial segment of its audience; (3) the deception is
material, in that it is likely to influence the purchasing decision; (4) the defendant caused its false
statement to enter interstate commerce; and (5) the plaintiff has been or is likely to be injured as a result
of the false statement, either by direct diversion of sales from itself to defendant or by a lessening of the
goodwill associated with its products. See, e.g., Clorox Co. P.R. v. Proctor & Gamble Commercial Co.,
228 F. 3d 24, 33 n.6 (1st Cir. 2000); Pizza Hut, Inc. v. Papa John‘s Int‘l, Inc., 227 F.3d 489, 495 (5th Cir.
2000); Balance Dynamic Corp. v. Schmitt Indus., 204 F.3d 683, 689 (6th Cir. 2000); United Indus. Corp.
v. Clorox Co., 140 F.3d 1175, 1180 (8th Cir. 1998); Southland Sod Farms v. Stover Seed Co., 108 F.3d
1134, 1139 (9th Cir. 1997); U.S. Healthcare, Inc. v. Blue Cross, 898 F.2d 914, 922-23 (3d Cir. 1990).
18Under section 43(a), plaintiffs must show that the allegedly false advertisement actually
deceives, or has the potential to deceive, consumers regarding a relevant quality of the product.54
In assessing the degree of deception, courts first identify the express and implied ―claims‖ of an
advertisement, and then determine whether these claims are false or misleading. A claim is (1)
false if it contains representations that are literally false; and (2) misleading if it contains
representations that, while not literally false, nonetheless generate implications that have a
tendency to mislead consumers.55 The actual deception requirement is obviated upon a finding of
literal falsity.56 In other words, literally false advertisements are treated as per se deceptive, and
courts do not require evidence of actual consumer deception to prove liability under the Lanham
Act.57 Where the advertised claim is merely misleading, a plaintiff must meet the materiality
requirement by showing that the advertisement actually or likely causes consumers to hold a
misconception.58
54
Lanham Act § 45, 15 U.S.C. § 1127 (2006).
55
SC Johnson & Sons, Inc. v. Clorox Co., 241 F.3d 232, 238 (2d Cir. 2001); Johnson & Johnson v. GAC
Int‘l Inc., 862 F.2d 975, 977 (2d Cir. 1988) (outlining the two different theories of false advertising as
either ―(1) an advertisement must be false on its face; or (2) the advertisement may be literally true, but
given the merchandising context, it nevertheless his likely to mislead and confuse consumers‖).
56
Pizza Hut Inc. v. Papa Johns Inter., Inc., 227 F.3d 489, 497 (5th Cir. 2000) (―With respect to
materiality, when the statements of fact at issue are shown to be literally false, the plaintiff need not
introduce evidence on the issue of the impact the statements had on consumers.‖).
57
Cashmere & Camel Hair Mfr. Inst. v. Saks Fifth Ave., 284 F. 3d 302 (1st Cir. 2002) (finding a
presumption of consumer deception when garments with less than 1% cashmere were labeled as 10%
cashmere and where garments labeled ―cashmere‖ were actually ―recycled cashmere‖); Coca-Cola Co. v.
Tropicana Prods., Inc., 690 F.2d 312, 317 (2d. Cir. 1982) (holding that when a challenged representation
is shown to be ―literally or explicitly false, the court may grant relief without referencing to the
advertisement‘s impact on the buying public‖).
58
Sandoz Pharms. Corps. v. Richardson-Vicks, Inc., 902 F.2d 222, 228-29 (3d. 1990); Am. Home Prods.
Corp. v. Johnson & Johnson, 577 F.2d 160, 165-66 (2d Cir. 1978). Litigants typically employ surveys to
demonstrate, or rebut, consumer deception. Courts have found material deception when 15% to 20% of
respondents report being misled. See Novartis Consumer Health, Inc. v. Johnson & Johnson-Merck
Consumer Pharms. Co., 290 F.3d 578, 594-95 (3d Cir. 2002) (finding that a material deception rate of
15% was sufficient to demonstrate a likelihood of substantial consumer confusion); However, a
misconception rate of less than 10% has been held to be insufficient evidence. See Johnson & Johnson-
Merck Consumer Pharms., Co. v. Rohne Poulenc Rorer Pharms., Inc., 19 F.3d 125, 135-36 (3d Cir. 1994)
(holding that a misconception rate of only 7.5% was insufficient evidence).
19In recent years, several circuits have embraced a third category of false advertising,
whereby an advertisement is offensive if it is ―literally false by necessary implication.‖ 59 Such
advertisements contain statements that, while true, have unambiguous implications that are
literally false. An implication is unambiguous ―when, considering the advertisement in its
entirety, the audience would recognize the claims as readily as if it had been explicitly stated.‖ 60.
The ―necessary implication‖ category avoids the requirement otherwise imposed on plaintiffs to
bring extrinsic evidence of actual consumer deception.61 In order to be considered a ―necessary
implication,‖ an implied claim must be ―unmistakable‖ and ―susceptible to no more than one
interpretation.‖62
Our study indicates that, while Microsoft makes no literally false claims, several of its
implicit representations may be found to be either literally false by necessary implication or
otherwise misleading. The following subsections analyze Microsoft‘s express and implied claims
under the Lanham Act.
A. Analysis of Microsoft‟s Express Claims.
Microsoft expressly claimed that (1) ―In blind tests, people choose Bing search results
over Google‖ results at a nearly 2-to-1 ratio,63 and (2) ―In blind tests, people preferred Bing over
59
A total of six federal circuits have affirmed the doctrine, including the First, Second, Third, Fourth,
Ninth and Tenth Circuits. See, e.g., Time Warner Cable, Inc. v. DirecTV, Inc., 497 F.3d 144 (2d Cir.
2007); Zoller Labs., LLC v. NBTY, Inc., 111 F. App‘x 978 (10th Cir. 2004); Scotts Co. v. United Indus.
Corp., 315 F.3d 264 (4th Cir. 2002); Novartis Consumer Health, Inc. (3d Cir. 2002); Clorox Co. P.R. v.
Procter & Gamble Commercial Co., 228 F.3d 24 (1st Cir. 2000); Southland Sod Farms v. Stover Seed
Co., 108 F.3d 1134, 1139 (9th Cir. 1997).
60
Clorox Co. P.R., 228 F.3d at 35.
61
Id.
62
Time Warner Cable, Inc., 497 F.3d at 158. See also Johnson & Johnson-Merck Consumer Pharms. Co.
v. Proctor & Gamble Co., 285 F. Supp. 2d 389, 391 (S.D.N.Y. 2003).
63
People Chose Bing, supra note 1.
20Google for the web‘s top searches.‖64 Both claims are based on actual tests that Microsoft
commissioned. Presuming that Microsoft had indeed conducted blind comparison tests and did
not falsify results, it is unlikely that plaintiffs can show that these claims are literally false.65
B. Analysis of Representations Implicit in Microsoft‟s Express Claims Regarding the General
Preferences of Consumers
Implicit in the reporting of test results is the representation that the results, rather than
being specific to participants who took the test, are appropriately generalizable. In Southland
Sod, a Ninth Circuit panel held that a chart depicting that ―Bonsai‖ turfgrass grew slower in ―an
independent comparison test‖ than other fescues necessarily implied (falsely) a general claim
about the growth rates of different grasses.66 By the Ninth Circuit‘s logic, implicit in Microsoft‘s
reporting of test results is the representation that Internet users generally prefer Bing over Google
by a ratio of 2:1, and this preference holds true for the ―web‘s top searches.‖ The
generalizability implication is strengthened by Microsoft‘s current representation, ―Wherever we
go, people prefer Bing over Google for the web‘s top searches.‖
Microsoft‘s implied claim regarding the preferences of consumers generally can be
judged legally false by demonstrating that the supporting tests were not sufficiently reliable to
permit one to conclude with reasonable certainty that the general proposition holds true.67 A
Ninth Circuit panel declared that, ―plaintiff[s] may meet this burden either by attacking the
validity of the defendant‘s tests directly or by showing that the defendant‘s tests are contradicted
64
Wallaert, supra note 1.
65
However, as discussed in the Web Appendix, the second statement‘s express claim of applicability to
―the web‘s top searches‖ raises the possibility of a misleading finding.
66
Southland Sod Farms v. Stover Seed Co., 108 F.3d 1134 (9th Cir. 1997).
67
Id. at 1139.
21or unsupported by other scientific tests.‖68 Effective attacks against the validity of Microsoft‘s
commissioned study require more information about how it was conducted. Even if the original
study was internally valid, the implied claims would still be vulnerable to contradicting scientific
tests. Our research indicates that the likelihood of people in the general population preferring
Bing over Google at a 2:1 ratio is virtually nil, and the likelihood of people preferring Bing over
Google for the most popular web searches is less than 1%.69 Our results undermine the validity
of Microsoft‘s tests, and create a strong presumption that an implicit claim of generizability was
false.
C. Analysis of Microsoft‟s Implicit Representation that Its Express Claims were Based on a
Sample Size of 5 Million
After making the ―nearly 2:1‖ claim that the results of blind comparison tests favor Bing
over Google, bingiton.com invites visitors to ―[d]ecide for yourself which search engine you
prefer‖70 by taking the online Bing It On challenge. The proximity of the two phrases on the
website, combined with Microsoft‘s encouragement to ―join the 5 million people who've visited
the challenge,‖ may be viewed as implying (falsely) that Microsoft‘s claims regarding people‘s
preference for Bing over Google are substantiated by data collected from five million Bing It On
challenge takers, rather than data from a single, independent study commissioned by Bing with
slightly less than one thousand participants.
A court might find that the advertisement necessarily implies that Microsoft‘s claims
were based on the larger sample or, alternatively, that the results from the five million blind
68
Id.
69
See supra Section III.
70
BING IT ON, http://www.bingiton.com (last visited July 7, 2013).
22challenge takers are consistent with the results from the (significantly smaller) commissioned
study. Even if a court does not find the representation to be necessarily and unambiguously
implied, it might still find that Microsoft‘s failure to adequately distinguish the different blind
tests has a tendency to mislead consumers. The confusion caused by this failure is likely
substantial—the results of our independent study provide strong evidence that the preferences of
the five million online challenge takers are not in fact consistent with the purported results of
Microsoft‘s commissioned study.
The Bing It On website includes a disclaimer in small text at the bottom of the webpage,
as well as a hyperlink that takes the visitor to another webpage that provides limited details
(―using a representative online sample of nearly 1,000 people, ages 18 and older, from across the
US‖) about the commissioned study.71 However, courts have often found corrective disclaimers
inadequate when they are not readily accessible to consumers.72 For example, in American Home
Products v. Johnson & Johnson, the Southern District of New York held, ―If the advertisement
contains a definition or disclaimer [that] is so inconspicuously located or in such a fine print that
readers tend to overlook it, it will not remedy the misleading nature of the claim.‖ 73 Furthermore,
the Third and Fourth Circuits have voiced doubts over whether disclaimers can ever correct for a
literally false claim, whether it is explicitly false or false by necessary implication.74
The Bing It On disclaimer is particularly weak; it only clarifies that the reported test was
―[b]ased upon a comparison of web search results panes only; excludes ads, Bing‘s snapshots
71
Id.
72
See, e.g., Giant v. FTC, 322 F.2d 977 (D.C. Cir. 1963) (finding that the term ―manufacturer‘s list price‖
in an advertisement misled consumers to believe that the price was the competitive sales price and
holding that a small print disclaimer explaining the meaning of ―manufacturer‘s list price‖ was
insufficient to correct for consumer deception).
73
Am. Home Prod. v. Johnson & Johnson, 654 F. Supp. 568, 590 (S.D.N.Y. 1987).
74
Scott v. United Indus. Corp., 315 F. 3d 264, 276 (4th Cir. 2002) (―If the graphic conveyed a literally or
impliedly false claim, then the disclaimer might not be sufficient to eliminate the Confusion.‖).
23and Social Search panes and Google‘s Knowledge graph.‖75 The disclaimer merely describes the
testing conditions employed by the commissioned study, which appear to be identical to the
conditions employed by Microsoft to test the preferences of five million online users who took
the Bing It On Challenge. The disclaimer does not indicate that the ―blind test‖ that the 2:1 claim
refers to was based on data collected independently of the online Bing It On Challenge, and on a
sample size considerably smaller than five million.
The second sentence of the disclaimer references a ―study,‖ but it is the only use of the
word in the entire advertisement, leaving readers unclear as to what is being referenced. Only
after clicking on the hyperlink and reading several paragraphs does the visitor learn that the
study refers to a series of blind tests that were distinct from the Bing It On challenge. 76 The
necessary information is hidden away on a separate website. As a result, Microsoft‘s disclaimer
is likely to be judged inadequate.
D. Analysis of Microsoft‟s Unstated Implication that the Bing It On Challenge is Free from Bias
The Bing It On Challenge is advertised as a ―Bing vs. Google‖ comparison test available
to visitors. An implicit claim imbedded in this invitation is that the comparison tests will not be
biased–that the suggested search terms on bingiton.com were not chosen to favor Bing. This
implication of lack of bias is clear from the description of the test as ―blind‖ and the disclaimer
emphasizing that search results strip away identifying characteristics. 77 Yet our analysis of
MTurk data indicates that the search terms suggested by Microsoft were likely biased in favor of
75
BING IT ON, http://www.bingiton.com (last visited July 7, 2013).
76
Wallaert, supra note 1.
77
BING IT ON, http://www.bingiton.com (last visited July 7, 2013).
24Bing. As a result, Microsoft‘s representation regarding the impartiality of its testing procedure is
likely false.
We found that the preference for Google over Bing was significantly higher when
subjects used popular search terms (55% to 39%) and self-selected search terms (57% to 35%)
rather than Bing-suggested terms (47% to 48%). Regression analysis indicates (at the 95%
confidence level) that using Bing-suggested terms significantly increased the likelihood of
preferring Bing search results in the Bing It On Challenge. These findings create a strong
presumption that Microsoft made strategic choices regarding the search terms that were
recommended on the Bing It On website. Though the unbiased nature of suggested terms is only
implied by the advertisement, courts are likely to find it to be a necessary implication, as the
Bing It On Challenge‘s advertised message of Bing being superior to Google would be
undermined without it.78
V. CONCLUSION
This article reports the results of a randomized experiment assessing the robustness of
Internet-user preferences for Bing or Google search results on the www.bingiton.com challenge
site. Although Microsoft has claimed that in an independent study nearly two out of three users
preferred Bing, this article performed a similarly sized study and was not able to replicate the
Microsoft result. On the contrary, we found a statistically significant preference for Google
results over Bing results using Microsoft‘s own challenge site. Moreover, the results of our
study suggest that Microsoft recommends that online users taking the Bing It On challenge
employ search terms that are statistically more likely to produce user preferences for Bing than
78
See Southland Sod Farms v. Stover Seed Co., 108 F.3d 1134, 1144 (9th Cir. 1997) (stating that a claim
is a necessary implication where alternative meanings are ―nonsensical‖).
25terms chosen by the users or those that appear on a list of popular search terms. Google likely
has a viable Langham Act claim against Microsoft for making advertising claims with
misleading ―necessary implications.‖
26You can also read