"Intuition Rather Than Deliberation Determines Selfish and Prosocial Choices" - 1213 May 2021 - Bence Bago, Jean-François Bonnefon, Wim De Neys ...
←
→
Page content transcription
If your browser does not render page correctly, please read the page content below
1213

                                          May 2021

“Intuition Rather Than Deliberation Determines Selfish and
                    Prosocial Choices”

      Bence Bago, Jean-François Bonnefon, Wim De Neys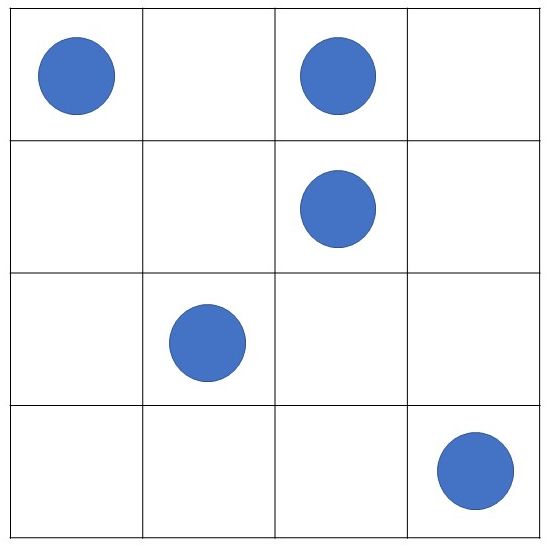
Intuition Rather Than Deliberation Determines Selfish and Prosocial Choices

                        Bence Bago1, Jean-François Bonnefon2, Wim De Neys3*

Affiliations:

1
    Institute for Advanced Study in Toulouse, University of Toulouse Capitole, Toulouse 31015,
France.
2
    Toulouse School of Economics (TSM-Research), Centre National de la Recherche Scientifique,
University of Toulouse Capitole, Toulouse 31015, France.
3
    Université de Paris, LaPsyDÉ, CNRS, F-75005 Paris, France.

                        (In Press) - Journal of Experimental Psychology : General

*Corresponding author:
Wim De Neys
LaPsyDE (CNRS & Université de Paris)
Sorbonne - Labo A. Binet
46, rue Saint Jacques
75005 Paris
France
wim.de-neys@parisdescartes.fr
2
ABSTRACT
Human interactions often involve a choice between acting selfishly (in ones' own interest) and acting
prosocially (in the interest of others). Fast-and-slow models of prosociality posit that people intuitively favour
one of these choices (the selfish choice in some models, the prosocial choice in other models), and need to
correct this intuition through deliberation in order to make the other choice. We present 7 studies that force
us to reconsider this longstanding “corrective” dual process view. Participants played various economic
games in which they had to choose between a prosocial and a selfish option. We used a two-response
paradigm in which participants had to give their first, initial response under time-pressure and cognitive load.
Next, participants could take all the time they wanted to reflect on the problem and give a final response. This
allowed us to identify the intuitively generated response that preceded the final response given after
deliberation. Results consistently showed that both prosocial and selfish responses were predominantly made
intuitively rather than after deliberate correction. Pace the deliberate correction view, the findings indicate
that making prosocial and selfish choices does typically not rely on different types of reasoning modes
(intuition vs deliberation) but rather on different types of intuitions.3
INTRODUCTION
Humans show unique prosocial behavior. Often we are willing to pay a personal cost to help
strangers who we never expect to encounter again (Jensen, Call, & Tomasello, 2007). This prosocial tendency
is a key factor that allows human societies and economies to prosper (Fehr & Fischbacher, 2003; Tomasello,
2019). Economists, psychologists and other social scientists have long tried to pinpoint the mechanisms
underlying human prosociality. Recent experimental work has been heavily influenced by the dual process
framework that conceives human thinking as resulting from an interplay between fast intuition and slow
deliberation (Kahneman, 2011). For example, one popular deliberate prosociality view entails that making
prosocial choices requires deliberate control of our intuitive selfish impulses (e.g., DeWall, Baumeister,
Gailliot, & Maner, 2008; Knoch, Pascual-Leone, Meyer, Treyer, & Fehr, 2006; Zaki & Mitchell, 2013). An
alternative deliberate selfishness view entails that our intuitions favor prosocial choices and it is only after
deliberation that we will seek to maximize our self-interest (e.g., Rand, Greene, & Nowak, 2012; Sanfey,
Rilling, Aronson, Nystrom, & Cohen, 2003).
Despite the differences with respect to which behavior is assumed to be favored by deliberation and
the—extensive—resulting debate (e.g., Baumeister, Vohs, & Tice, 2007; Bouwmeester et al., 2017; Capraro &
Cococcioni, 2016; Rand, 2016, 2019; Tinghög et al., 2013, 2016; see Capraro, 2019 for a review), both the
deliberate prosociality and deliberate selfishness view are built on the same underlying corrective deliberation
model: Intuition will favor one type of behavior whereas making the competing choice will require slow,
deliberate processes to control and correct the initial intuitive impulse (Wills, Hackel, & Van Bavel, 2019). If
correct, such deliberate correction model holds interesting policy implications and promises since it implies
that we can steer people towards more/less prosocial behavior by simply pushing them to deliberate
more/less (Krajbich, Bartling, Hare, & Fehr, 2015).
Here we present a critical direct test of the underlying deliberate correction model. In our studies
participants played incentivized, anonymous, one-shot economic games in which they had to choose to
maximize their self-interest or opt for a prosocial choice. These classic games vary in their specifics but in all
of them the prosocial choice consisted in paying a personal cost to give a benefit to others (Dictator Game,
DG; Public Goods Game, PG) or to punish others’ selfish behavior (second-mover Ultimatum Game, UG).
Each game involves a specific sub-type of prosocial behavior (e.g., altruism, DG; costly punishment, UG;
cooperation, PG). By including the various games we aimed to get the broadest possible test of the deliberate
correction model of prosocial behavior.
We used a two-response paradigm (e.g., Kessler, Kivimaki, & Niederle, 2017; Krawczyk &
Sylwestrzak, 2018; Thompson, Turner, & Pennycook, 2011) in which participants initially had to respond as
fast as possible with the first intuitive answer that came to mind. Immediately afterwards they were given all
the time they wanted to reflect and give a final answer. To make maximally sure that the initial response was4
generated intuitively, possible deliberation was experimentally “knocked-out” by having people make their
initial choice under time-pressure (i.e., a 2 s to 6 s response deadline) and concurrent cognitive load (i.e.,
memorization of a complex visual pattern). Given that deliberate processing is assumed to be more time and
cognitive resource demanding than intuitive processing, forcing people to respond under time-pressure and
load minimizes the possibility that people will deliberate during the initial response phase (Bago & De Neys,
2017, 2019). If the dual process correction model is correct, we expect that the alleged deliberate response—
be it selfish or prosocial— will only (or at least predominantly) be observed in the final response stage after
correction of one’s initial response (i.e., selfish-to-prosocial or prosocial-to-selfish changes).
We ran a total of seven studies. The various studies tested the generality and robustness of the
findings across different games and methodological refinements.
STUDY 1: DICTATOR GAME
METHOD
Participants
112 Hungarian students (79 female, Mean age = 22.1 years, SD = 2.23 years) from the Eotvos
Lorand University of Budapest were tested. A total of 86.7% of participants reported high school as the
highest completed educational level, while 13.3% reported having a postsecondary education degree.
Participants received course credit in return for participation and a possible monetary bonus payment (see
further).
The sample size decision was based on previous two-response studies in the logical and moral
reasoning field (Bago & De Neys, 2017, 2019) in which approximately 100 participants per condition were
tested.
Participants in Study 1-4 were recruited from a pool which was renewed each semester and consisted
of approximately 400 individuals. Study 1 and 4 were run in the same semester, Study 2 and 3 in the
subsequent semester. All participants participated online. Recruitment numbers were regularly checked and
manually stopped when at least 100 participants were tested or the pool was depleted. Each semester
participants for the one-response pretests (see further) were recruited after the main two-response studies
were completed.
Materials
Dictator Game (DG). We designed the two-choice DG following Schulz, Fischbacher, Thöni, and
Utikal (2014). Participants were presented with a total of 16 DG trials (8 standard and 8 control, see further).
In each trial, participants played the role of Dictator and were asked to divide 100 points (which were later5
converted into money, at a rate of 1 point = 3 HUF, approximately $0.01) between a new anonymous other
player and themselves. Each trial presented two allocations of the 100 points. One allocation was always more
fair (equal) than the other. For example:
a) You keep 61, and the other player gets 39.
b) You keep 51, and the other player gets 49.
For the fair option, we used four types of quasi-equal allocations: 51/49, 52/48, 53/47, 54/46. To
avoid an “equality heuristic” (Schulz et al., 2014), we did not use the absolute fair 50/50 allocation and always
allotted the largest share of the quasi-equal fair split to the participant. For the unfair option, we used both
high difference trials (81/19, 82/18, 83/17, or 84/16) and low difference trials (61/39, 62/38, 63/37, or
64/36). Fair and unfair options were paired together such that the difference between the participant’s gains
in all high and low difference trials remained constant (e.g., the unfair 81/19 and 82/18 options were paired
with fair options 51/49 and 52/48, respectively). Note that the high and low difference factor did not affect
the correction findings and was not further considered. The presentation order of the fair and unfair option
was counterbalanced.
In addition to 8 standard DG trials, we also presented 8 control DG trials. In the standard problems
the participant maximized self-interest by selecting the unfair split. Thus, selfish and prosocial fairness
considerations cue conflicting choices. In the control trials, the participant gained more by selecting the quasi-
equal fair split. This was achieved by changing the pay-off structure of the unfair option; in control trials the
participants received the smallest share of the unfair split. For example:
a) You keep 39, and the other player gets 61.
b) You keep 51, and the other player gets 49.
Thus, in control trials selfish and prosocial fairness considerations cued the same response (i.e., the fair
split). This should result in a high, non-random selection rate of this response option (Engel, 2011). For
convenience, we label the response as the selfish choice. The presentation order of the two response options
was counterbalanced and the same allocation combinations as in the standard trials were used. The eight
standard and control trials were presented in random order.
Control trials allowed us to test for a guessing confound and are reported in this context. Unless
otherwise noticed all reported results in the main text and supplementary material concern the critical
standard trials.6
Load task. We wanted to make maximally sure that participants’ initial response was intuitive (i.e.,
deliberation is minimized). Therefore, we used a cognitive load task (i.e., the dot memorization task, see
Miyake, Friedman, Rettinger, Shah, & Hegarty, 2001) to burden participants’ cognitive resources while they
were making their initial choice. The rationale behind the load manipulation is simple; dual process theories
assume that deliberation requires more cognitive resources than intuition (Evans & Stanovich, 2013).
Consequently, if we burden someone’s cognitive resources, it will be less likely that they can engage in
deliberation. We opted for the dot memorization task because it has been repeatedly shown to hinder
deliberation during logical reasoning and economic game decision making (De Neys, Novitskiy, Geeraerts,
Ramautar, & Wagemans, 2011; De Neys & Schaeken, 2007; De Neys & Verschueren, 2006; Franssens & De
Neys, 2009). Before each game, participants were presented with a 3 x 3 grid, in which four grid squares were
filled with crosses (see Figure 1 and S1). Participants were instructed that it was critical to memorize the
location of the crosses even though it might be hard while making a game decision. After the DG choice was
made, participants were shown four different matrices and they had to choose the correct, to-be-memorized
pattern. They received feedback as to whether they chose the correct or incorrect pattern. The load was only
applied during the initial response stage and not during the subsequent final response stage in which
participants were allowed to deliberate (see further).
Procedure
Reading pretest. Before we ran the main study we recruited an independent convenience sample of 6
participants for a reading pretest (2 female, Mean age = 34.7 years, SD = 13.1 years). The basic goal of the
reading pretest was to determine the response deadline which could be applied in the main DG study. The
idea was to base the response deadline on the average reading time in the reading test (e.g., Bago & De Neys,
2017). The rationale was that if people are allotted the time they need to simply read the problem, we can
expect that any further deliberate reasoning will be minimized (Bago & De Neys, 2017, 2019). Thus, in the
reading pretest participants were presented with the same items as in the main DG. They were instructed to
simply read the problems and randomly click on one of the answer options (see Supplementary Material A for
literal instructions).
Each of the 16 problems was presented to the participants. Before each trial, a fixation cross was
presented for one second. Once participants clicked on one of the response options, they were automatically
taken to the next trial.
The average reading time was M = 3.4 s (SD = 1.7). Note that raw reaction time (RT) data were first
logarithmically transformed prior to analysis. Mean and standard deviation were calculated on the
transformed data, and then they were back-transformed into seconds (geometrical mean and SD). We wanted
to give the participants some minimal leeway, thus we rounded the average reading time to the closest higher
natural number (Bago & De Neys, 2017); the response deadline was therefore set to 4 s.7
One-response (deliberative-only) pretest. We also ran a traditional “one-response” version of our Dictator
game (without deadline or load). The same material as in the main two-response study was used. The only
difference was that as in traditional economic game studies, participants were simply asked to give one single
answer for which they could take all the time they wanted. We recruited an independent sample of 82
participants (61 female, Mean age = 22.4 years, SD = 3.1 years) from the Eotvos Lorand University of
Budapest who received course credit and a possible monetary bonus payment depending on the game
outcome. A total of 86.6% of the participants reported high school as highest completed educational level,
while 13.4% reported having a postsecondary education degree.
The one-response version allowed us to check for a possible consistency confound in the two-
response paradigm. When people are asked to give two consecutive responses, they might be influenced by a
desire to look consistent. Thereby, the paradigm might underestimate the correction rate. Previous two-
response work in other fields already argued against such a confound (De Neys & Bago, 2017, 2019;
Thompson et al., 2011). Here we tested for it by contrasting the proportion of selfish responses on the
standard trials in the one-response pretest and the final two-response stage in the main study. A consistency
confound would result in a clear discrepancy. However, results showed that the rates in the one-response
(43.4%, SD = 49.6) and final two-response stage were very similar (50.4%, SD = 50, see also Table S1). A
mixed-effect logistic regression model (accounting for the random intercept of participants and items)
indicated that the difference was not significant, χ2 (1) = 1.7, p = 0.19, b = 0.65.
We also contrasted response latencies in the one-response pretest and main two-response study to
check whether participants were under time-pressure when giving their initial response in the main study.
Raw reaction time (RT) data were first logarithmically transformed prior to analysis (and again back-
transformed into s afterwards). We focused on the critical standard trials. Results confirmed that participants
responded faster in the initial two-response stage (Mean = 2.02 s, SD = 2.15) than in the unrestricted one-
response condition (Mean = 2.53, SD = 1.86). A mixed-effect linear regression model (accounting for the
random intercept of participants and items) indicated that the difference was significant, χ2 (1) = 9.79, p <
0.0001, b = -0.07.
Two-response Dictator Game. The experiment was run online. Participants were specifically instructed at
the beginning that we were interested in their very first, initial answer that came to mind. They were also told
that they would have additional time afterwards to reflect on the problem and could take as much time as
they needed to provide a final answer. After this general introduction, participants were presented with a
more specific instruction page which explained them the upcoming game. Participants were informed that the
game was incentivized and anonymous. Participants were told that each game was played with a different8
anonymous person and that their identity would never be revealed (see Supplementary Material A for full
instructions and pay-out structure).
After the specific instruction page, participants were presented with an attention check. They saw a
hypothetical trial on screen and were asked to enter how many points they and the other player would make
when they chose option A or B. Right amounts could be simply copied from the screen information. If a
mistake was made, a second, similar attention check was given. If the second attention check was failed, the
study immediately ended. After the attention check, participants started a practice session to familiarize them
with the experimental procedure. First, they were presented with two practice DG trials in which they simply
had to respond before the deadline. Next, they solved two practice dot matrix load problems (without
concurrent DG). Finally, at the end of the practice, they had to solve the one earlier practice game and a new
one under cognitive load just as in the main study.
Figure 1 illustrates the full trial structure. Each trial started with the presentation of a fixation cross
for 1 s followed by the load matrix that stayed on the screen for 2 s. Next, the Dictator proposal choice
appeared. From this point onward participants had 4 s to enter their answer; after 3 s the background of the
screen turned yellow to warn participants about the upcoming deadline. If they did not provide an answer
before the deadline, they were asked to pay attention to provide an answer within the deadline on subsequent
trials. After the initial response, participants were asked to rate their experienced decision difficulty (“How hard
did you find it to make a decision? Please type a number from 0 (absolutely not hard) to 100 (very hard)”). Next, they were
presented with four matrix pattern options, from which they had to choose the correct, to-be-memorized
pattern. If the answer was not correct, they were asked to pay more attention to memorize the correct pattern
on subsequent trials. Finally, the full problem was presented again, and participants were asked to provide a
final response. After the response was entered, participants again rated the experienced difficulty.
The colour of the answer options was green during the first response, and blue during the final
response phase, to visually remind participants which question they were answering. Therefore, right under
the question we also presented a reminder sentence: “Please indicate your very first, intuitive answer!” and
“Please give your final answer”, respectively, which was also coloured as the answer options. At the end of
the study participants completed a page with standard demographic questions. As in Rand et al. (2012), at this
point, we also asked about their prior experience participating in similar economic game studies.
Exclusion criteria. All participants passed the attention check questions. Participants failed to provide a
first response before the deadline in 1.4% of the trials. In addition, in 8.4% of the trials participants
responded incorrectly to the dot memorization load task. All these trials were removed from the analysis
because it cannot be guaranteed that the initial response resulted from intuitive processing: If participants
took longer than the deadline or neglected the load task, they might have engaged in deliberation. Removing
trials that did not meet the inclusion criteria gives us the purest possible test of our hypothesis. In total, 9.6%9
of trials were excluded and 1620 trials (out of 1792) were further analysed (initial and final response for the
same item counted as 1 trial).
Statistical analysis and Confidence Intervals (CI). Unless otherwise noticed, throughout the article we used
mixed-effect regression models to analyze our results (Baayen, Davidson, & Bates, 2008), accounting for the
random intercept of participants and items. For this, we used the lme4 package (Bates, Sarkar, Bates, &
Matrix, 2007) in R (R Core Team, 2018). For binary choice data, we used logistic regression while for
continuous data (RT and confidence) we used linear regression. When we had singular fit issues, the random
intercept of items was excluded (these tests are shown with an * next to them).
CIs were computed using the DescTools package in R (Signorell, 2016). For binomial distributions
(correction indexes, see further) we used the default “Wilson” confidence interval (Brown, Cai, & DasGupta,
2001) and for multinomial distributions (initial-to-final SS, PP, SP, PS averages, see further) we used the
default “Sison-Glaz” approach (Sison & Glaz, 1995).
RESULTS AND DISCUSSION
Given that there are two response stages and two possible choices (selfish or prosocial) there are four
possible combinations in which a subject can change their answer or not (initial and final selfish, SS; initial
and final prosocial, PP; Initial selfish and final prosocial, SP; initial prosocial and final selfish, PS). Figure 2A
plots an overview of the Study 1 results for the critical standard trials (see Table S2 for table format). It will
be clear that we find evidence for corrective selfish (PS, 7.6% of total) and prosocial (SP, 8.8% of total)
responses in which an initial choice is changed after deliberation in the final response stage. In and of itself,
this indicates that deliberate correction exists. However, the problem is that these corrective cases are
relatively rare. As Figure 2A indicates, it is far more likely that one’s final selfish (SS, 42.8%) or prosocial (PP,
39.6%) choice was already selected in the initial response stage. Hence, both selfish and prosocial choices are
typically already made intuitively in the absence of any deliberation. To quantify this, the last two bars in
Figure 2A present the correction indexes (selfish correction index, CorS = the proportion of corrective selfish
trials (PS), out of all final selfish choice trials (PS+SS); and the prosocial correction index, CorP = the
proportion of corrective prosocial trials (SP) out of all final prosocial choice trials (SP+PP)). If the deliberate
correction model is appropriate, this ratio should be at ceiling—or at the very least be above 50% and
account for the majority of cases. Indeed, a low absolute proportion of PS or SP trials is not necessarily
problematic for the corrective model. The key prediction is that in case the alleged (demanding) deliberate
choice is made, it should only be made as final response. It is this critical ratio that is captured by the
correction indexes.10
However, as Figure 2A indicates, the selfish and prosocial correction indexes were far from ceiling or
even the 50% mark (average CorS = 15.1%; average CorP = 20.2%). To test this statistically, for the selfish
correction rate, we recoded SS trials as 0 and PS trials as 1. Then we excluded all PP and SP trials and
calculated the average (which is equal to the CorS rate) and 95% CI. We used mixed-effect linear regression
models to test whether the average of this variable differed from 50%. For the prosocial correction rate we
coded PP as 0 and SP as 1, excluded all SS and SP trials, and applied the same statistics. Results showed that
both the CorS, b = -2.43, p < 0.0001* and CorP, b = -1.67, p < 0.0001, indexes were significantly below 50%.
A critic might argue that the strong cognitive constraints at the initial response stage led people to
make random first responses. Such guessing could overestimate the true initial selfish/prosocial response rate
and drive the correction rate down. To test for such a general confound, half of the trials in our game were
control trials in which there was no conflict between the selfish and prosocial choice. This was achieved by
varying the pay-off structure such that a prosocial decision also maximized personal payoff. If people refrain
from blind guessing, one expects a non-random preference for the prosocial/selfish choice on these control
problems. Results showed that this was indeed the case. In Study 1, the selection rate of the selfish/prosocial
response option (i.e., the fair split) in the control trials reached 77% (SD = 50%, see also Table S1) which
significantly differed from chance, b = -2.19, p < 0.0001. We also calculated a stability index on the standard
trials: For each participant, we calculated on how many standard trials they showed the same direction of
change pattern (i.e., SS, PP, SP, or PS). The average stability in Study 1 was 76.3% (SD = 23.1) which was
significantly higher than 50% chance, t (111) = 12.06, p < 0.0001 (in all our studies we used a one-sample,
one-sided t-test for the stability analysis). This response consistency further indicates that participants were
not giving random responses.
In sum, the Study 1 Dictator Game findings directly argue against the corrective deliberation model.
In the vast majority of cases participants arrived at their selfish (prosocial) answer without any deliberation. In
Study 2 we tested the generality of the findings with a two-response version of the Ultimatum Game.
STUDY 2: ULTIMATUM GAME
METHOD
Participants
101 Hungarian students (77 female, Mean age = 21.1 years, SD = 1.8 years) from the Eotvos Lorand
University of Budapest were tested. A total of 85.7% of participants reported high school as the highest
completed educational level, while 14.3% reported having a postsecondary education degree. Participants
received course credit in return for participation and a possible monetary bonus payment.11
Materials
Ultimatum Game (UG). Participants were presented with 16 UG trials (8 standard and 8 control, see
further). The procedure was based on the work of Sanfey and colleagues (Sanfey et al., 2003; Van’t Wout,
Kahn, Sanfey, & Aleman, 2006). Participants played the role of responder (second-mover). In every trial,
participants were faced with an offer made by a new, anonymous proposer to split an allocated sum of 10
points (points were later converted to HUF at a rate of 1 point = 10 HUF, approximately $0.035). If
participants accepted the offer, both players received the proposed amount. If they refused, neither player
received anything. The item format looked as follows:
You received the following offer:
Player "A" keeps 9, and you get 1.
Do you accept this offer?
Yes
No
We presented 8 standard and 8 control trials in random order. In the standard trials the participant
was presented with an unfair offer in which the proposer kept the larger part (9:1, 8:2, 7:3, and 6:4).
Participants were presented every unfair offer twice. In the control trials the proposer always offered a fair
(5:5) split. In all trials, participants always maximized their self-interest by accepting the offer. In the standard
trials participants could make a prosocial choice and pay a personal cost to punish the other’s player selfish
behaviour by rejecting the offer (Rand et al., 2012). In control trials, the other player did not behave selfishly
so there was no prosocial motivation to punish the other and reject the offer. Hence, a high rate of accepted
control offers can be expected (Sanfey et al., 2003). For convenience, we will refer to accepted control trials
as “selfish” responses.
Procedure
Reading pretest. Before we ran the main study we recruited an independent sample of 28 participants
for a reading pretest (20 female, Mean age = 21.8 years, SD = 4.2 years) following the same procedure and
logic as in Study 1. Each of the 16 UG items was presented to the participants. They were asked to simply
read the sentences and click on one of the answers to advance to the next item.
The average reading time was 3.3 s (SD = 1.8). Note that raw RT data were first logarithmically
transformed prior to analysis. Mean and standard deviation was calculated on the transformed data, and then
they were back-transformed into seconds (geometrical mean and SD). In Study 1, results showed that on12
average participants managed to give a response in the initial response stage well before the 4 s deadline.
Therefore, in Study 2 we decided to round the reading time down to the lower integer and set the response
deadline to 3 s.
One-response (deliberative-only) pretest. Following the same logic as in Study 1, we also ran a one-response
pretest of the Ultimatum Game. We recruited an independent sample of 58 participants (44 female, Mean age
= 21.5 years, SD = 2.5 years) from the Eotvos Lorand University of Budapest who received course credit
and a possible monetary bonus payment depending on the game outcome. A total of 89.7% of the
participants reported high school as highest completed educational level, while 10.3% reported having a
postsecondary education degree.
We again observed a fairly similar rate of selfish choices on standard trials in the one-response pretest
(39%, SD = 48.8) and the final stage of the main two-response study 41.9% (SD = 42.4), χ2(1) = 0.07, p =
0.79, b = 0.14. Latency analysis indicated that participants responded faster on standard trials in the initial
two-response stage (Mean = 1.87 s, SD = 1.29) than in the unrestricted one-response condition (Mean = 2.74
s, SD = 1.84), χ2(1) = 153.56 p < 0.0001, b = -0.29.
Two-response paradigm. As in Study 1, participants were specifically instructed at the beginning that we
were interested in their very first, initial answer that came to mind. They were also told that they would have
additional time afterwards to reflect on the problem and could take as much time as they needed to provide a
final answer. After the general two-response introduction (see Study 1), participants were presented with a
more specific instruction page which explained them the upcoming game. Participants were informed that the
game was incentivized and anonymous (see Supplementary Material A for full instructions and pay-out
structure). The remainder of the two-response procedure was similar to Study 1. After the specific instruction
page, participants were presented with an attention check, familiarized with the deadline and load procedure,
and started the game. The only difference was that the initial response deadline was set to 3 s in the UG.
Exclusion criteria. Three participants failed the introductory attention check questions and could not
participate further. The remaining participants failed to provide a first response before the deadline in 2.6%
of the trials. In addition, in 8.6% of the trials participants responded incorrectly to the dot memorization load
task. All missed deadline and load trials were excluded (10.8% of trials; 1399 trials out of 1568 were analysed).
RESULTS
Figure 2B and Table S2 show the results. We report an overview of the statistical analyses here. See
Study 1 results for background.13
As Figure 2B indicates, selfish (PS, 8.9%) and prosocial (SP, 5.5% deliberate correction was rare and
the corresponding correction indexes were low. Our statistical analysis confirmed that the selfish, 21.2%, b =
-1.57, p = 0.006, and prosocial, 9.4%, b = -2.6, p < 0.0001, correction index rate for the standard UG were
significantly lower than 50%.
The selection rate of the selfish/prosocial response option (i.e., accepting the fair split) in the control
trials was 95.3% (SD = 21.2%) which significantly differed from chance, b = 10.52, p < 0.0001*. The average
standard trial stability in Study 2 was 74.8% (SD = 21.5) which was significantly higher than 50% chance, t
(97) = 11.43, p < 0.0001.
Study 2 showed that deliberate correction in the Ultimatum Game was the exception rather than the
rule. As in Study 1, correction indexes were low and people typically arrived at their selfish (prosocial) answer
without deliberation. In Study 3, we further tested the generality of the findings with a two-response version
of a two-player Public Good Game.
STUDY 3: PUBLIC GOOD GAME
METHOD
Participants
95 Hungarian students (58 female, Mean age = 21.2 years, SD = 1.95 years) from the Eotvos Lorand
University of Budapest were tested. A total of 86.6% of participants reported high school as the highest
completed educational level, while 13.4% reported having a postsecondary education degree. Participants
received course credit in return for participation and a possible monetary bonus payment.
Materials
Public Good Game (PG). Participants played 16 PG trials (8 standard and 8 control trials). In each trial,
participants were randomly paired with another, anonymous participant. In each trial participants were given
100 points and were told that they could both decide to contribute this allocation to a common pool or not.
They were informed that the number of points in the common pool would be multiplied by a factor 1.2 to 2.9
and that the resulting total points would be equally split between the two participants. In each trial
participants were presented with the actual pay-off matrix on screen. For example:
Player B contributes Player B doesn't contribute
You contribute 120 / 120 60 / 16014
You don't contribute 160 / 60 100 / 100
Do you contribute to the common pool?
a) Yes
b) No
The participants’ pay-off was shown in black, the other players’ pay-off in grey. The order of the
matrix rows (and response options) was counterbalanced; for half of the participants the top row (“You
contribute”) stated the pay-offs in case they contributed, for the other half the top row stated the pay-offs in
case of non-contribution. Response options were ordered similarly (e.g., if first row stated contribution pay-
off, the upper response option stated “Yes”).
We presented 8 standard and 8 control trials. In standard trials we multiplied the number of points
with a multiplier between 1.2 and 1.9. In these trials, self-interest is maximized by not contributing whereas
the group pay-off is maximized by contributing. Hence, selfish considerations cue a “No” decision, whereas
prosocial considerations cue a “Yes” decision. In control trials, we selected multipliers between 2.2 and 2.9.
In these trials, contributing always yields a higher pay-off compared to non-contribution both for oneself and
for the group. Hence, both selfish and prosocial motivations cue the same “Yes” response. Consequently, a
high, non-random proportion of “Yes” responses is expected on the control trials. For convenience, we label
such “Yes” control responses as “selfish” choices.
Procedure
Reading pretest. Before we ran the main study we recruited an independent sample of 28 participants
for a reading pretest (20 female, Mean age = 21.3 years, SD = 2.3 years) following the same procedure and
logic as in Study 1-2. Each of the 16 PG items was presented to the participants. They were asked to simply
read the information and click on one of the answers to advance to the next item.
The average reading was 6.1 s (SD = 2.5). Note that raw reaction time (RT) data were first
logarithmically transformed prior to analysis. Mean and standard deviation were calculated on the
transformed data and back-transformed into seconds. Following the logic of Study 2, we rounded the average
reading time to the closest lower natural number; the response deadline was therefore set to 6 s.
One-response (deliberative-only) pretest. Following the same logic as in Study 1-2, we also ran a one-
response pretest of our Public Good Game. We recruited an independent sample of 65 participants (48
female, Mean age = 21.5 years, SD = 2 years) from the Eotvos Lorand University of Budapest who received15
course credit and a possible monetary bonus payment depending on the game outcome. No specific
education level information was recorded but the participants came from the same university sample as the
ones in the main study.
We again observed a fairly similar mean rate of selfish choices on standard trials in the one-response
pretest (70.6%, SD = 45.6%) and the final stage of the main two-response study (66.2%, SD = 47.3%), χ2 (1)
= 0.04, p = 0.84, b = -0.1. Latency analysis indicated that participants responded faster on standard trials in
the initial two-response stage (Mean = 2.94 s, SD = 1.5) than in the unrestricted one-response condition
(Mean = 6.92 s, SD = 2.25), χ2 (1) = 96.93, p < 0.0001, b = -0.37.
Two-response paradigm. As in Study 1-2, participants were specifically instructed at the beginning that
we were interested in their very first, initial answer that came to mind. They were also told that they would
have additional time afterwards to reflect on the problem and could take as much time as they needed to
provide a final answer. After the general two-response introduction (see Study 1), participants were presented
with a more specific instruction page which explained them the upcoming game. Participants were informed
that the game was incentivized and anonymous (see Supplementary Material A for full instructions and pay-
out structure).
The remainder of the two-response procedure was similar to Study 1. After the specific instruction
page, participants were presented with an attention check, familiarized with the deadline and load procedure,
and started the game. The only difference was that the initial response deadline was set to 6 s in the PG.
Exclusion criteria. Three participants failed the introductory attention check questions and could not
participate further. The remaining participants failed to provide a first response before the deadline in 1.7%
of the trials. In addition, in 8.7% of the trials participants responded incorrectly to the dot memorization load
task. All missed deadline and load trials were excluded (10.1% of trials; 1180 trials out of 1312 were analysed).
RESULTS
Figure 2C and Table S2 show the results. As Figure 2C indicates, selfish (PS, 10.6%) and prosocial
(SP, 6.1%) deliberate correction was rare and the corresponding correction indexes were low. The selfish,
16%, b = -2.2, p < 0.0001*, and prosocial, 18.2%, b = -2.06, p < 0.0001*, correction indexes in the standard
PGG trials were significantly lower than 50%.
The selection rate of the selfish/prosocial response option (i.e., “Yes” responses) in the control trials
was 86% (SD = 34.7) which significantly differed from chance, b = 10.5, p < 0.0001*. The average standard
trial stability was 78.7% (SD = 22) which was significantly higher than 50% chance, t (81) = 11.83, p <
0.0001.16
In sum, the Study 3 Public Goods Game findings were consistent with the results we obtained for
the Dictator Game (Study 2) and Ultimatum Game (Study 2) and showed that prosocial and selfish responses
are typically driven by intuitive processing rather than deliberate correction.
In Study 4-7 we addressed various alternative explanations and possible experimental confounds.
One might note that although the two-response paradigm allows participants to deliberate in the final
response stage, this does not guarantee they actually do so. This is also a common issue for previous studies
that only use a single (one-response), deliberative stage. A common solution when examining the impact of
deliberation on prosocial choice is to force people to think for at least 10 s before they can enter a response
(Rand et al., 2012). Therefore, in Study 4 participants played the same Dictator Game as in Study 1 but with
forced deliberation in the final response stage.
STUDY 4: DICTATOR GAME WITH FORCED DELIBERATION
METHOD
Participants
112 Hungarian students (79 female, Mean age = 22.13 years, SD = 2.4 years) from the Eotvos
Lorand University of Budapest were tested. A total of 89.2% of participants reported high school as the
highest completed educational level, while 10.8% reported having a postsecondary education degree.
Participants received course credit in return for participation and a possible monetary bonus payment.
Materials & Procedure
Delayed final response. We used the same DG trials with the same two-response paradigm as in Study 1.
The only change we made was the forced deliberation at the final response stage. Participants were instructed
to reflect for at least 10 s in the final response stage and could not enter a response before 10 s had passed
(see Supplementary Material A for full instructions).
Exclusion criteria. One participant failed the introductory attention check questions and could not
participate further. The remaining participants failed to provide a first response before the deadline in 2.9%
of the trials. In addition, in 10.3% of the trials participants responded incorrectly to the dot memorization
load task. All missed deadline and load trials were excluded (12.5% of trials; 1554 trials out of 1776 were
analysed).
RESULTS17
Figure 2D and Table S2 show the results. As Figure 2 indicates, despite the forced deliberation in
Study 4 results were similar to Study 1. Deliberate correction remained the rare exception. The statistical
analysis confirmed that the selfish, 11.7%, b = -2.64, p < 0.0001, and prosocial, 20.2%, b = -2.51, p < 0.0001*,
correction index rates on the standard trials were significantly lower than 50% in Study 4.
With respect to guessing, the selection rate of the selfish/prosocial response option in the control
trials was 81.2% (SD = 39.1%) which significantly differed from chance, b = 2.85, p < 0.0001*. The average
standard trial stability in Study 4 was 80.3% (SD = 21.7) which was significantly higher than 50% chance, t
(110) = 14.73, p < 0.0001.
In sum, Study 4 confirmed the Study 1 results. In study 5-7 we further refined the methodology.
Although our instructions, load, and time-pressure manipulations were based on established procedures, one
could argue that they were not demanding enough and still allowed participants to deliberate during the initial
response stage (Kessler et al., 2017; Krawczyk & Sylwestrzak, 2018). Therefore, we tuned up our
manipulations in Study 5-7. In addition to the forced deliberation we also used more stringent response
deadlines and more extreme load. In Study 1-4 participants memorized a 4-dot pattern in a 3x3 grid while
making their initial game choices whereas this was increased to a 5-dot pattern in a 4x4 grid in study 5-7. In
addition, the response deadline for each of the games in Study 5-7 was set at the average initial response time
observed in Study 1-4.
STUDY 5: DICTATOR GAME WITH FORCED DELIBERATION AND EXTREME TIME
PRESSURE/LOAD
METHOD
Participants
119 participants were recruited (56 female, Mean age = 32.5 years, SD = 10.7 years) on Prolific
Academic. Only native English speakers from Canada, Australia, New Zealand, the United States of America
or the United Kingdom were allowed to take part in the study. Among them 47.1% reported high school as
the highest completed educational level, while 52.1% reported having a postsecondary education degree.
Participants received a participation fee (£5/hour) and a possible bonus payment depending on the game
outcome.
Because we expected a higher number of excluded trials in the extreme deadline/load treatment we
recruited a slightly higher number of participants in Study 5-7. For each study the goal was to get at
approximately 120 analyzable data sets (vs approximately 100 in Study 1-4).18
Materials & Procedure
Delayed final response. The exact same Dictator Game with forced deliberation procedure as in Study 4
was used.
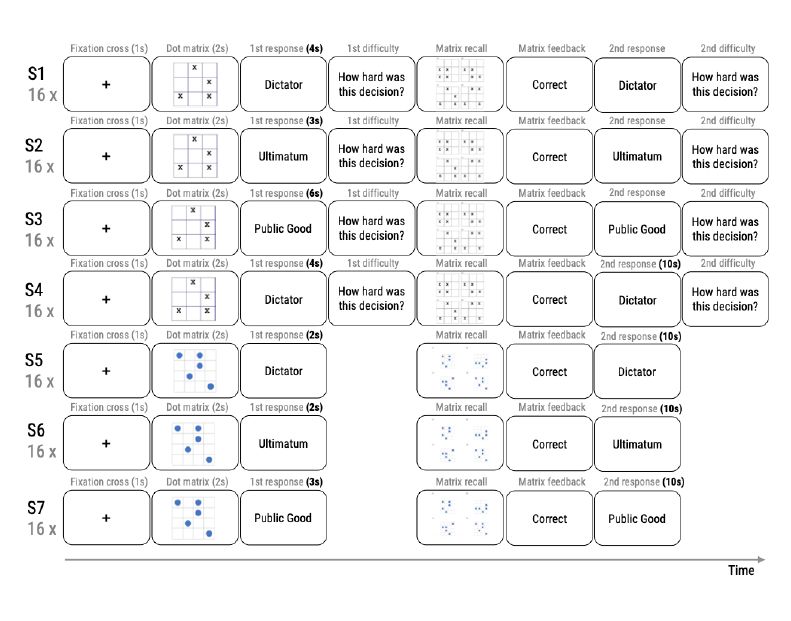
Extreme load. In Studies 1–4, participants had to memorize a complex four-dot pattern in a 3 x 3 grid
during the initial response stage. In Study 5 we presented an even more complex five-dot pattern in a 4 x 4
grid (e.g., Białek & De Neys, 2017; Trémolière & Bonnefon, 2014, see Figure 1 and S1). Except for the
precise load pattern, the load procedure was similar to Study 1–4.
Response deadline. In Study 1 and 4 the response deadline for the initial DG response was 4 s and the
average initial response latency on standard trials was 2.02 s (SD = 2.15). In Study 5 we decreased the
deadline to this average (rounded to nearest integer) and set it to 2 s. The screen background turned yellow
to alert the participant to enter their response 500 ms before the deadline.
Difficulty rating. In Study 1-4 participants were asked to indicate how hard they found it to make a
decision after each response. In Study 5-7 this difficulty rating was dropped.
Exclusion criteria. All participants passed the introductory attention check questions. Participants failed to
provide a first response before the deadline in 8.9% of the trials. In addition, in 14.6% of the trials
participants responded incorrectly to the dot memorization load task. All missed deadline and load trials were
excluded (21% of trials; 1505 trials out of 1904 were analysed). Note that—consistent with the stronger
constraints—the percentage of discarded trials in Study 5(-7) was generally higher than in Study 1(-4).
RESULTS
Figure 2E and Table S2 show the Study 5 results. As Figure 2 indicates, despite the stronger
constraints, results were similar to Study 1 and 4. Deliberate correction remained exceptional and never
became the dominant pattern. Statistical testing indicated that the selfish, 8.3%, b = -3.18, p < 0.0001*, and
prosocial, 27.7%, b = -1.32, p < 0.0001*, correction index rates were significantly lower than 50%.
Given the stronger cognitive constraints in Study 5 it is important to check for a possible random
responding or guessing confound. However, the selection rate of the selfish/prosocial response option in the
control trials reached 86.6% (SD = 34.1) which significantly differed from chance, b = 3.15, p < 0.0001. The
average standard trial stability in Study 5 was 83.2% (SD = 20.03) which was significantly higher than 50%
chance, t (117) = 17.996, p < 0.0001. This establishes that despite the stronger constraints, participants were
not responding randomly.19
The Study 5 Dictator Game findings are consistent with the Study 1 and 4 Dictator Game results. In
Study 6 we adopted the same strong constraints as in Study 5 with the Ultimatum Game.
STUDY 6: ULTIMATUM GAME WITH FORCED DELIBERATION AND EXTREME TIME
PRESSURE/LOAD
METHOD
Participants
126 participants (55 female, Mean age = 33.8 years, SD = 10.4 years) were recruited on Prolific
Academic. Only native English speakers from Canada, Australia, New Zealand, the United States of America
or the United Kingdom were allowed to take part in the study. 35.3% of participants reported high school as
the highest completed educational level, while 63.8% reported having a postsecondary education degree.
Participants received a participation fee (£5/hour) and a possible bonus payment depending on the game
outcome.
Materials & Procedure
Delayed final response. We used the same ultimatum game trials as in Study 2. The delayed response
procedure was completely similar to the one adopted in Study 4-5.
Extreme load. We used the same extreme load task as described in Study 5.
Response deadline. In Study 2 the response deadline for the initial DG response was 3 s and the average
initial response latency on standard trials was 1.87 s (SD = 1.29). In Study 6 we decreased the deadline to this
average (rounded to nearest integer) and set it to 2 s. The screen background turned yellow to alert the
participant to enter their response 500 ms before the deadline.
Exclusion criteria. Five participants failed the introductory attention check questions and could not
participate further. The remaining participants failed to provide a first response before the deadline in 14.6%
of the trials. In addition, in 17.7% of the trials participants responded incorrectly to the memorization load
task. All missed deadline and load trials were excluded (27% of trials; 1514 trials out of 1936 were analysed).
RESULTS20
Figure 2F and Table S2 show the Study 6 results. As Figure 2 indicates, despite the stronger
constraints, key results were similar to Study 2. Deliberate correction remained exceptional and never became
the dominant pattern. The selfish, 6.3%, b = -10.87, p < 0.0001, and prosocial, 23.1%, b = -1.96, p < 0.0001*,
correction index rates on the standard trials were both significantly lower than 50%.
The selection rate of the selfish/prosocial response option in the control trials reached 96.7% (SD =
17.9) which significantly differed from chance, b = 8.72, p < 0.0001*. The average standard trial stability in
Study 6 was 78.1% (SD = 20.8) which was significantly higher than 50% chance, t (113) = 14.43, p < 0.0001.
This again indicates that the stronger cognitive constraints did not underestimate the correction indexes by
prompting a random response tendency.
Study 6 confirmed our previous findings. In the final Study 7 we also tested the Public Good Game
with the strong constraints that we adopted in Study 5-6.
STUDY 7: PUBLIC GOODS GAME WITH FORCED DELIBERATION AND EXTREME TIME
PRESSURE/LOAD
METHOD
Participants
131 participants (63 female, Mean age = 30.3 years, SD = 10.5 years) were recruited on Prolific
Academic. Only native English speakers from Canada, Australia, New Zealand, the United States of America
or the United Kingdom were allowed to take part in the study. 47.3% of participants reported high school as
the highest completed educational level, while 50% reported having a postsecondary education degree.
Participants received a participation fee (£5/hour) and a possible bonus payment depending on the game
outcome.
Materials & Procedure
Delayed final response. We used the same Public Good Game trials as in Study 3. The delayed response
procedure was completely similar to the one adopted in Study 4-6.
Extreme load. We used the same extreme load task as described in Study 5-6.
Response deadline. In Study 3 the response deadline for the initial PG response was 6 s and the average
initial response latency on standard trials was 2.94 s (SD = 1.5). Consistent with the Study 5-6 rationale, in
Study 7 we decreased the deadline to this average (rounded to nearest integer) and set it to 3 s. The screen
background turned yellow 1 s before the deadline to alert the participant to enter their response.21
Exclusion criteria. 19 participants failed the introductory attention check questions and could not
participate further. The remaining participants failed to provide a first response before the deadline in 11.5%
of the trials. In addition, in 13.8% of the trials participants responded incorrectly to the dot memorization
load task. All missed deadline and load trials were excluded (15.8% of trials; 1509 trials out of 1792 were
analysed).
RESULTS
Figure 2G and Table S2 show the Study 7 results. As Figure 2 indicates, despite the stronger
constraints, critical findings are consistent with our Public Good Game findings in Study 3 and our other
studies. The correction indexes indicate that deliberate correction never became the dominant pattern. The
statistical analysis confirmed that both the selfish, 25.2%, b = -1.73, p < 0.0001, and prosocial, 25.2%, b = -
1.26, p = 0.002, correction index rate on the standard trials were significantly lower than 50%.
The selection rate of the selfish/prosocial response option in the control trials in Study 7 was 85.6%
(SD = 35.1) which significantly differed from chance, b = 3.06, p < 0.0001. The average standard trial stability
was 72.2% (SD = 20.8) which was significantly higher than 50% chance, t (111) = 11.67, p < 0.0001. This
again indicates that participants were not responding randomly.
Our results were very similar in the different studies that we ran. For convenience, we also ran an
analysis on the combined Study 1-7 data. These results are show in Figure 2H (see Supplementary Material B
for statistical tests).
GENERAL DISCUSSION
The present study tested the corrective dual process model of prosocial behavior. This influential model
entails that intuition will favor one type of behavior whereas making the competing choice will require slow,
deliberate processing to control and correct the initial intuitive impulse. Pace the deliberate correction
prediction, in each of our seven studies we consistently observed that both prosocial and selfish responses
were predominantly made intuitively rather than after deliberate correction. Although corrective patterns
were observed, they were the rare exception rather than the rule. In general, it seems that the corrective dual
process model—and the deliberate prosociality and deliberate selfishness views that are built on it—has given
too much weight to deliberation. Making prosocial and selfish choices does not typically rely on different
types of reasoning systems (i.e., an intuitive “System 1” and deliberate “System 2” or an impulsive and
controlled system) but rather on different types of intuitions.
Clearly, the conclusion only holds in so far as there are no alternative explanations or experimental
confounds. In the consecutive studies and pretests we controlled for various possible issues. We summarize22
the key points here and discuss some additional control analyses. First, the cognitive constraints at the first
stage of the two-response paradigm might have led people to make random first responses, which would lead
to an underestimation of the frequency and systematicity of their corrections. However, our “control” trials
(on which prosocial decisions also maximized personal payoff) and stability analysis consistently indicated
that responses at the intuitive stage were not random.
Second, the two-response paradigm might introduce experimental demands for consistency or an
anchoring effect that would artificially reduce the rate at which participants correct their decisions. To rule
out this concern, Studies 1–3 included an additional “one-response” pretest in which participants only gave
deliberate responses, skipping the first intuitive stage. Results showed that choices in the final two-response
stage and pretest were very consistent. For none of the games, choices differed by more than 7%. Hence, a
possible consistency confound cannot explain the very low correction rates.
Third, the two-response paradigm allows people to deliberate in the final response stage but does not
guarantee they actually do so. Since previous studies that examined the impact of deliberation on prosocial
choice often forced people to think for at least 10 s before they could enter a response, Studies 4-7 adopted
this forced deliberation in the final response stage. However, even with forced deliberation, the correction
rates remained floored.
Fourth, even if our instructions, time pressure and cognitive load manipulations had all been largely
validated by previous research, it is still possible that they were not demanding enough, and thus allowed
participants to engage in deliberation at the first, intuitive stage. To rule out this concern, we used more
extreme load and time pressure manipulations in Study 5-7. Deliberate correction remained infrequent and
never became the modal pattern.
Fifth, contrasting of the unrestricted one-response pretests latencies in Study 1-3 and the
corresponding initial two-response latencies also established that even in our least restrictive two-response
studies 1-3, participants were under time pressure. In addition, we also ran an extra control analysis in which
we contrasted the correction index rate for fast and slow initial responses (based on a median split on initial
response time in each of the studies). If our deadlines were not stringent enough and allowed (some)
participants to engage in deliberation in the initial response stage, one expects that the correction rate should
be higher for fast vs slow initial responses (since slow responders had more time to engage in possible
preemptive deliberation). Results showed this was not the case (see supplementary Material B, Table S2-S4).
Even for the fastest half of responses, the correction rate remained floored.
Sixth, the literature has pointed to possible moderators of the prevalence of selfish/prosocial choice
such as gender and experience in participating in economic games (McAuliffe, Forster, Pedersen, &
McCullough, 2018; Rand, 2016; Rand, Brescoll, Everett, Capraro, & Barcelo, 2016; Rand et al., 2012). In
additional control tests we also analyzed results separately for both genders (Table S5-S6) and for subjects
who indicated they had previously participated in economic game studies or not (Table S7-S8). Given thatYou can also read