NBA Chemistry: Positive and Negative Synergies in Basketball
←
→
Page content transcription
If your browser does not render page correctly, please read the page content below
International Journal of Computer Science in Sport – Volume 12/2013/Edition 2                    www.iacss.org

                       NBA Chemistry:
         Positive and Negative Synergies in Basketball
                         Allan Z. Maymin1, Philip Z. Maymin2 & Eugene Shen1
                                                1
                                                    AllianceBernstein
                                         2
                                             NYU-Polytechnic Institute

         Abstract
         We introduce a novel Skills Plus Minus (“SPM”) framework to measure on-court
         chemistry in professional basketball. First, we evaluate each player’s offense and
         defense in the SPM framework for three basic skill categories: scoring,
         rebounding, and ball-handling. Next, we simulate games using the skill ratings of
         the ten players on the court. Finally, we calculate the synergies of each NBA
         team by comparing their 5-player lineup’s effectiveness to the “sum-of-the-parts.”
         We find that these synergies can be large and meaningful. Because skills have
         different synergies with other skills, our framework predicts that a player’s value
         depends on the other nine players on the court. Therefore, the desirability of a
         free agent depends on the current roster. Indeed, our framework generates
         mutually beneficial trades between teams. Other ratings systems cannot generate
         ex-ante mutually beneficial trades since one player is always rated above another.
         We find more than two hundred mutually beneficial trades between NBA teams,
         situations where the skills of the traded players fit better on their trading partner’s
         team. We also find that differences in synergies between teams explain as much
         as six wins and that teams are no more likely to exhibit positive chemistry than
         negative chemistry.

KEYWORDS: NBA, SYNERGY, CHEMISTRY, SKILLS PLUS-MINUS

Introduction
        “My model for business is The Beatles. They were four guys who kept each other’s
        negative tendencies in check. And the total was greater than the sum of the parts.
        Great things in business are not done by one person; they are done by a team of
        people.”
                                                                                           – Steve Jobs
Basketball, one of the world’s most popular and widely viewed sports, is a timed game played
by two teams of five players on a rectangular court1. While the exact playing regulations vary
across different governing bodies, we focus on the National Basketball Association (“NBA”),
which is widely considered the premier men’s professional basketball league in the world.
Teams alternate possession of the basketball and attempt to score points by shooting a ball
through a hoop 18 inches in diameter and 10 feet high mounted to a backboard at each end of
the floor. The team with the most points at the end of the game wins the game. In the NBA,

1
    Background information on the game of basketball draws from http://en.wikipedia.org/wiki/Basketball.

                                                                                                            4
International Journal of Computer Science in Sport – Volume 12/2013/Edition 2 www.iacss.org
teams have 24 seconds to attempt a field goal. A successful field goal attempt is worth two
points for the shooting team, or three points if the shooting player is behind the three-point line.
A free throw is awarded to an offensive player if he is fouled while shooting the ball. A
successful free throw attempt is worth one point. Each possession ends with either a field goal
attempt, free throw attempt, or a turnover (if a player loses possession to the opposing team).
Turnovers can occur when the ball is stolen (a “steal”) or if the player steps out of bounds or
commits a violation (“non-steal turnover”). A missed field goal attempt or free throw attempt
results in a rebounding opportunity, where the teams fight to gain possession of the ball. Each
possession ends with a finite number of possible outcomes, making the simulation of a game
feasible.
The rules of basketball do not specify any positions whatsoever, and there are no special
positions such as goalie. Over time, positions have evolved, where shorter and quicker players
play “guard”, a position that requires more ballhandling, passing and outside shooting.
Meanwhile, taller and stronger players typically play “forward” or “center”, operate closer to
the basket, and grab more rebounds. Traditionally, teams play with two guards, two forwards,
and one center, but it is possible to play with five guards or five centers, if a team so desires.
A box score summarizes the statistics of a game, detailing player contributions such as minutes
played, field goal attempts, successful field goals, free throw attempts, successful free throws,
rebounds, assists, steals, blocks and turnovers. Assists are awarded when a player passes the
ball to a teammate who then scores a field goal. A block occurs when a defensive player
legally deflects a field goal atatempt by an offensive player. In general, guards accumulate
more assists, while centers block more shots. There have been many attempts to rate individual
basketball players using box score statistics. Examples include Wins Produced or Win Shares
(see Oliver 2004). These ratings systems generally agree with expert opinions on the best
players in the league. For example, during the 2012-2013 season, both Wins Produced and
Win Shares suggested that LeBron James and Kevin Durant were the two best players in the
NBA. These two players also finished first and second in Most Valuable Player (“MVP”)
voting for that season.
While these box score ratings can measure an individual’s contributions, they do not
necessarily explain how players interact on the court. For example, it is possible that the five
best players in the NBA are all centers. In this case, a team with five centers may not be the
optimal lineup, since there would be no one to bring the ball up the court or guard the quicker
opposing guards. Therefore to determine the optimal lineup, we would want to measure the
“synergies” among players, and predict which players play well with each other. Our paper
attempts to address this issue by introducing a Skills Plus Minus (“SPM”) framework that
decomposes a player’s contributions into three skills: scoring, rebounding and ball-handling.
In sports, synergies are not often applied to individual athletes. Bollinger and Hotchkiss (2003)
in evaluating baseball define team synergy as firm-specific productivity such as the signals and
strategies unique to the team. MacDonald and Reynolds (1994) explicitly avoid attention to
“synergy” or “chemistry” and focus only on the value of each baseball player on his own.
Indeed, they hypothesize “a reasonably efficient market in player talent and a consequently
quasi-efficient assignment of players among teams and within team line-ups.” Idson and
Kahane (2000) begin the path of testing this hypothesis by separating out the effects of
individual and team productivity on salary determination in the National Hockey League, and
indeed find that team attributes not only directly affect individual pay, but can also diminish
certain individual productivity effects. Their results in fact hint at synergies: they find
complementarity across some productive attributes but not others and they hypothesize that
“larger, more significantly positive interactions might follow if certain positions are paired.”
5International Journal of Computer Science in Sport – Volume 12/2013/Edition 2 www.iacss.org
They leave this open as a fruitful subject of future research.
Here we are able to actually test this hypothesis by using a large dataset of repeated interactions
combined with our Skills Plus Minus model and framework to decompose the players into their
constituent skill groups and evaluate the synergies resulting from various combinations of those
skill groups. We find that the allocation of players within teams is not efficient, and that there
are hundreds of trades that would have benefitted both trading teams because of the effects on
team chemistry.
An example helps frame our argument. With the third pick in the 2005 NBA draft, the Utah
Jazz selected Deron Williams, a 6’3” point guard who played collegiately at Illinois. Using the
very next pick, the New Orleans Hornets drafted Chris Paul, a 6’0” point guard from Wake
Forest. Since the moment they entered the league, the careers of Williams and Paul have often
been compared. Countless debates and discussions sparked about who is the better point guard.
There are arguments for both sides.
The box score statistics seem to favor Paul. His career statistics (18.7 points per game, 4.6
rebounds, 9.9 assists, 2.4 steals, 0.571 true shooting percentage (“TS%”)) are better than
Williams across the board (17.2 points, 3.2 rebounds, 9.2 assists, 1.1 steals, 0.560 TS%). Paul
has played in more All-Star games (4 vs. 2) and appeared on more All-NBA teams (3 vs. 2).
Meanwhile, supporters of Williams point to his better regular season record (0.590 winning
percentage vs. 0.555 for Paul), relative playoff success (20 playoff wins vs. 10), head-to-head
record against Paul, size, strength, and durability. They argue that Williams is a stronger one-
on-one defender who does not gamble for steals.
At the end of the 2009-2010 season, if Utah had traded Deron Williams for Chris Paul, would
they have been better off? If New Orleans had traded Chris Paul for Deron Williams, would
they have been better off? Using the framework introduced in this paper, we can answer these
questions: surprisingly, the answer is YES to both. A Williams-for-Paul swap would have
made both teams better off and is an example of a mutually beneficial trade. Such a trade
should not have been possible if team composition were efficient; at the very least, such a trade
should have been consummated, but it never was.
This paper introduces a novel Skills Plus Minus framework to measure on-court chemistry in
basketball. This SPM framework builds upon the Advanced Plus Minus (“APM”) framework
first introduced by Rosenbaum (2004). While APM evaluates each player based on the points
scored while they are in the game, SPM evaluates each player based on the offensive and
defensive components of three basic categories of skills: scoring, rebounding and ball-
handling. For example, a player’s “steal” ratings (part of the ball-handling category) are
determined by how many steals occur while he is in the game. Like APM, SPM considers the
other nine players on the court. A benefit of the APM and SPM framework is the ability to
capture skills that are not found in traditional box score measures, such as off-the-ball defense,
boxing out, and setting picks. Also, in contrast to other ratings such as Wins Produced, APM
and SPM do not make position and team adjustments to the player ratings.
We use the SPM framework to simulate games using the skill ratings of the ten players on the
court. These simulations incorporate how each play starts: out-of-bounds, steal, defensive
rebound or offensive rebound. We find these starting conditions materially affect the outcome
of the possession. The simulations are then used to measure the effectiveness of individual
players and 5-player lineups.
We investigate which basketball skills have synergies with each other. Traditionally, team
chemistry has been difficult to measure. Berri and Jewell (2004) use roster stability as a proxy
6International Journal of Computer Science in Sport – Volume 12/2013/Edition 2 www.iacss.org
for chemistry. While they acknowledge the “potential impact of disruptive players,” (which we
would call negative synergies in our framework) they note that “identifying and quantifying the
impact of such players appears problematic.” Our framework solves this problem.
Another method to measure chemistry compares the “lineup APM” versus the sum of the
constituent single player APM’s. The problem with that approach is that there are too many
possible five-player lineup combinations. The APM’s of the five-player lineups have small
sample problems since the minutes played of any given five-player lineup can be small. Our
innovation is that we are able to predict synergies while avoiding this problem.
We calculate the synergies of each NBA team by comparing their 5-player lineup’s
effectiveness to the “sum-of-the-parts.” These synergies can be large and meaningful. Because
skills have different synergies with other skills, a player’s value depends on the other nine
players on the court. Therefore the desirability of a free agent depends on the players currently
on the roster.
Finally, our framework is able to generate mutually beneficial trades. Other ratings systems
cannot generate mutually beneficial trades, since one player is always rated above another, c.f.
Kubatko, Oliver, Pelton, and Rosenbaum (2007) for a review of most of them, or Berri (1999)
or Berri (2008) for more detail on Wins Produced. Berri and Brook (1999) investigate whether
trades are ex-post mutually beneficial and argue that trades can be ex-ante mutually beneficial
if the ex-post distribution of minutes is known and different. In contrast, our framework
generates ex-ante mutually beneficial trades without a change in the distribution of minutes
played. Using our framework, we find many mutually beneficial trades, when the skills of the
traded players fit better on their trading partner’s team. One such mutually beneficial trade is
Chris Paul for Deron Williams.
Methods
Description of the Data
While our primary innovation is a theoretical framework to model on-court chemistry, we use
data to illustrate. Berri and Schmidt (2010) criticize APM because the player ratings are not
stable from year-to-year. They favor ratings that use box score statistics (e.g. Wins Produced),
because the ratings are more predictable from year-to-year. We acknowledge Berri and
Schmidt’s criticism and therefore use data from four NBA seasons (2006-2007 through 2009-
2010) to achieve better estimates for player skills. While Fearnhead and Taylor (2011) allow
their APM ratings to be time-varying, we estimate one rating for all four years.
The data we use is from basketballgeek.com, maintained by Ryan J. Parker, and represents a
processed version of the play-by-play information from the NBA and ESPN. The data includes
the names of all players on the court at each time, the location of the shots taken, result of
possession, and more. The data set includes 4,718 games and 987,343 plays.
Tables 1-4 display summary statistics from our data set.
7International Journal of Computer Science in Sport – Volume 12/2013/Edition 2 www.iacss.org
Table 1. Possession Start Variables
Possession Start Count Percent
Defensive Rebound 256,589 26.0%
Offensive Rebound 104,903 10.6%
Steal 59,329 6.0%
Out of Bounds 566,522 57.4%
Total 987,343 100.0%
Table 2. Possession Outcomes
Possession Outcomes Count Percent
Steal 68,460 6.9%
Non-steal turnover 66,912 6.8%
Missed FT – 2 pts 5,953 0.6%
Missed FT – 1 pt 15,068 1.5%
Missed FT – 0 pts 7,161 0.7%
Made FT – 3 pts 16,650 1.7%
Made FT – 2 pts 59,746 6.1%
Made FT – 1 pt 19,908 2.0%
Missed 3 FG 108,651 11.0%
Made 3 FG 60,652 6.2%
Missed 2FG 298,416 30.3%
Made 2 FG 257,524 26.1%
Total 985,101 100.0%
Table 3. Offensive Rebounds
Type OReb Missed Shots OReb%
Field Goal 127,489 407,154 31.3%
Free Throw 3,749 28,218 13.3%
8International Journal of Computer Science in Sport – Volume 12/2013/Edition 2 www.iacss.org
Table 4. Players Involved in the Most Plays in Our Data Set.
Name Plays Name Plays Name Plays Name Plays Name Plays Name Plays
1 Andre Iguodala 53,798 Samuel Dalembert 39,505 Ronnie Brewer 29,750 Brook Lopez 22,937 Mike James 17,691 Kris Humphries 12,515
2 Kobe Bryant 50,783 LaMarcus Aldridge 39,388 Antonio McDyess 29,712 Jason Maxiell 22,841 Michael Beasley 17,603 Josh Powell 12,290
3 Dwight Howard 49,297 Zach Randolph 39,098 Zydrunas Ilgauskas 29,589 Aaron Brooks 22,826 Eddy Curry 17,458 Leon Powe 12,131
4 LeBron James 49,254 Carlos Boozer 38,806 Luke Ridnour 29,559 Carlos Delfino 22,801 Jamaal Tinsley 17,428 Renaldo Balkman 12,010
5 Antawn Jamison 48,399 Allen Iverson 38,764 T.J. Ford 29,412 Jason Williams 22,734 C.J. Miles 17,399 Tony Battie 11,894
6 Jason Kidd 47,746 Mike Miller 38,742 Luis Scola 29,352 Jordan Farmar 22,712 Marko Jaric 17,225 Tyreke Evans 11,793
7 Andre Miller 47,515 Mike Bibby 38,565 Peja Stojakovic 29,175 Linas Kleiza 22,674 Josh Childress 17,156 Jamaal Magloire 11,681
8 Rudy Gay 47,238 Kevin Durant 38,436 DeShawn Stevenson 29,124 Daniel Gibson 22,402 Wally Szczerbiak 17,126 Ersan Ilyasova 11,617
9 Joe Johnson 47,209 Kirk Hinrich 38,322 Andres Nocioni 28,806 Dahntay Jones 22,334 Fabricio Oberto 17,051 Brent Barry 11,546
10 Dirk Nowitzki 47,053 Derek Fisher 38,318 Ricky Davis 28,802 Antoine Wright 22,124 Bobby Jackson 17,040 Joel Anthony 11,468
11 Vince Carter 46,936 Marvin Williams 38,152 Al Thornton 28,749 Darko Milicic 22,106 Sasha Vujacic 16,880 Ronnie Price 11,402
12 Deron Williams 46,845 Troy Murphy 38,081 Charlie Villanueva 28,184 Darius Songaila 22,103 Carlos Arroyo 16,803 Malik Allen 11,259
13 Stephen Jackson 46,780 Rafer Alston 37,792 Kyle Korver 28,084 Zaza Pachulia 22,071 Mark Blount 16,769 Chris Quinn 11,230
14 Raymond Felton 46,622 Kevin Martin 36,967 Brendan Haywood 27,983 Spencer Hawes 21,991 Kevin Love 16,669 Dan Gadzuric 11,164
15 Steve Nash 46,241 Andrea Bargnani 36,872 Kenyon Martin 27,980 Kelenna Azubuike 21,909 Joey Graham 16,504 Ruben Patterson 11,139
16 Danny Granger 44,800 Earl Watson 36,624 Trevor Ariza 27,905 Ime Udoka 21,876 Lou Williams 16,432 Mardy Collins 11,109
17 Rashard Lewis 44,796 Steve Blake 36,609 Michael Finley 27,314 Ronny Turiaf 21,834 Tony Allen 16,380 Hilton Armstrong 11,098
18 Carmelo Anthony 44,607 Corey Maggette 36,458 Maurice Evans 27,273 Desmond Mason 21,825 J.J. Redick 16,281 Shaun Livingston 11,069
19 Richard Jefferson 44,195 Udonis Haslem 36,362 Mickael Pietrus 27,156 Jamario Moon 21,783 Matt Harpring 16,124 Brandon Jennings 11,028
20 Amare Stoudemire 44,009 Devin Harris 36,074 Erick Dampier 27,145 Devin Brown 21,695 Jannero Pargo 16,092 Greg Buckner 10,956
21 John Salmons 43,992 Richard Hamilton 35,991 Mike Conley 27,132 Marc Gasol 21,243 Johan Petro 16,085 Louis Williams 10,837
22 Caron Butler 43,968 Kevin Garnett 35,817 Tracy McGrady 27,095 Luke Walton 21,210 Daequan Cook 16,052 Tyronn Lue 10,799
23 Baron Davis 43,896 Brad Miller 35,648 Andray Blatche 27,074 Marquis Daniels 21,140 Anthony Morrow 16,044 Sam Cassell 10,783
24 Josh Smith 43,851 Tony Parker 35,389 Elton Brand 26,906 Kurt Thomas 20,910 Brandon Bass 16,016 Shannon Brown 10,719
25 David West 43,690 Chris Duhon 35,372 O.J. Mayo 26,888 Gilbert Arenas 20,868 Jerry Stackhouse 15,986 Antoine Walker 10,706
26 Shawn Marion 43,629 Jeff Green 34,935 Thaddeus Young 26,800 Eddie House 20,834 DeSagana Diop 15,962 Jonny Flynn 10,695
27 Hedo Turkoglu 43,429 Rasheed Wallace 34,399 Nate Robinson 26,773 Trenton Hassell 20,735 Stephon Marbury 15,942 Travis Diener 10,637
28 Gerald Wallace 43,407 Rasual Butler 34,381 Travis Outlaw 26,601 Eric Gordon 20,699 Dorell Wright 15,676 Damon Jones 10,551
29 Ray Allen 43,312 Jose Calderon 34,105 Sebastian Telfair 26,548 Anthony Carter 20,679 Nazr Mohammed 15,627 Yakhouba Diawara 10,507
30 Chris Bosh 43,234 Raja Bell 34,066 Damien Wilkins 26,462 Joe Smith 20,623 Earl Boykins 15,455 Louis Amundson 10,496
31 Jamal Crawford 43,109 Nick Collison 33,773 Thabo Sefolosha 26,415 Antonio Daniels 20,580 Sergio Rodriguez 15,429 Ryan Hollins 10,496
32 Chauncey Billups 43,101 Andrew Bogut 33,578 Michael Redd 26,288 Vladimir Radmanovic 20,564 Brevin Knight 15,427 Gerald Green 10,446
33 Boris Diaw 42,703 Ben Wallace 33,548 Andrew Bynum 26,127 Joel Przybilla 20,361 Jose Juan Barea 15,270 Donte Greene 10,406
34 David Lee 42,058 Beno Udrih 33,220 Shaquille O'Neal 26,077 Quinton Ross 20,277 Bobby Simmons 15,147 Brian Scalabrine 10,220
35 Jason Terry 42,027 Charlie Bell 32,791 Francisco Garcia 25,833 Jason Thompson 20,148 Luc Richard Mbah a Moute 14,977 Damon Stoudamire 10,033
36 Jason Richardson 41,972 Chris Kaman 32,745 Mikki Moore 25,590 Corey Brewer 19,934 Rashad McCants 14,961 J.J. Hickson 10,000
37 Lamar Odom 41,838 Mike Dunleavy 32,577 Keith Bogans 25,362 Rasho Nesterovic 19,823 James Jones 14,839 Will Bynum 9,989
38 Monta Ellis 41,190 Andrei Kirilenko 32,491 Roger Mason 25,261 Luther Head 19,741 George Hill 14,710 Marco Belinelli 9,987
39 Anthony Parker 41,146 Matt Barnes 32,362 Derrick Rose 25,171 Morris Peterson 19,736 Chucky Atkins 14,471 Chris Douglas-Roberts 9,683
40 Al Harrington 41,112 Leandro Barbosa 32,337 Channing Frye 25,100 Jared Dudley 19,490 Chris Andersen 14,460 Marreese Speights 9,650
41 Emeka Okafor 41,065 Paul Millsap 32,061 Jason Kapono 25,015 Nenad Krstic 19,399 Juan Dixon 14,353 Kevin Ollie 9,635
42 Tayshaun Prince 40,991 Kendrick Perkins 31,802 Ronald Murray 24,884 Yi Jianlian 19,211 Jason Collins 14,319 Nicolas Batum 9,630
43 Ben Gordon 40,867 Nene Hilario 31,676 Bruce Bowen 24,745 Carl Landry 19,159 Devean George 14,240 Julian Wright 9,560
44 Paul Pierce 40,827 J.R. Smith 31,579 Chris Wilcox 24,716 Brandon Rush 18,997 Glen Davis 14,098 Taj Gibson 9,535
45 Pau Gasol 40,827 Jermaine O'Neal 31,564 Wilson Chandler 24,707 Nick Young 18,976 Danilo Gallinari 13,895 Eddie Jones 9,527
46 Shane Battier 40,740 Jameer Nelson 31,478 Tyrus Thomas 24,604 Matt Carroll 18,958 Rudy Fernandez 13,885 Ryan Anderson 9,435
47 Jarrett Jack 40,737 Tyson Chandler 31,467 Jeff Foster 24,261 Sasha Pavlovic 18,891 Stephen Curry 13,801 Goran Dragic 9,414
48 Mo Williams 40,617 Al Horford 31,233 Rodney Stuckey 24,191 Anthony Johnson 18,781 Shelden Williams 13,731 Jonas Jerebko 9,322
49 Tim Duncan 40,522 Josh Howard 31,201 Russell Westbrook 24,190 Ramon Sessions 18,706 Brian Skinner 13,715 Darren Collison 9,252
50 Chris Paul 40,417 Manu Ginobili 31,152 Jarvis Hayes 23,956 Reggie Evans 18,599 D.J. Augustin 13,689 James Singleton 9,169
51 Luol Deng 40,259 Anderson Varejao 31,125 Cuttino Mobley 23,915 Eduardo Najera 18,416 Roy Hibbert 13,626 JaVale McGee 9,120
52 Ryan Gomes 40,214 Andris Biedrins 30,943 Chuck Hayes 23,911 Josh Boone 18,415 Amir Johnson 13,586 Eric Snow 9,088
53 Al Jefferson 40,184 Quentin Richardson 30,442 Yao Ming 23,740 Arron Afflalo 18,406 Kwame Brown 13,554 Solomon Jones 9,052
54 Marcus Camby 40,171 Hakim Warrick 30,398 Jared Jeffries 23,737 Rodney Carney 18,385 Royal Ivey 13,401 Omri Casspi 8,748
55 Dwyane Wade 40,132 Willie Green 30,335 Craig Smith 23,697 Matt Bonner 18,327 Bostjan Nachbar 13,294 Kenny Thomas 8,659
56 Brandon Roy 40,028 James Posey 30,109 Kyle Lowry 23,638 Courtney Lee 17,996 Dominic McGuire 13,117 Stromile Swift 8,634
57 Ron Artest 39,947 Randy Foye 29,993 Keyon Dooling 23,530 Mario Chalmers 17,965 Marcus Williams 13,086 Juan Carlos Navarro 8,621
58 Mehmet Okur 39,831 Drew Gooden 29,973 Martell Webster 23,281 C.J. Watson 17,950 Adam Morrison 13,011 Jacque Vaughn 8,568
59 Rajon Rondo 39,647 Larry Hughes 29,899 Joakim Noah 23,155 Juwan Howard 17,883 Francisco Elson 12,653 Bonzi Wells 8,544
60 Grant Hill 39,532 Delonte West 29,880 Tim Thomas 23,000 Fred Jones 17,789 Smush Parker 12,626 Anthony Randolph 8,543
Description of the Model
In our Skills Plus Minus (“SPM”) framework, we run a series of nested probit regressions to
estimate the likelihood of various events for a given play. We order a series of events {EVTi, i
= 1,…n} sequentially. We then define , the conditional probability of each EVTi
occurring, as:
⋅ ⋅ ! ⋅ "#$
is the probability of the event i, conditional on all prior events in the sequence not
occurring (since only one event can occur per play). ⋅$ is the cdf of the standard normal
distribution, is a constant associated with the event, is the home court dummy
variable, is the possession start variable, and and "# are player dummy
variables. is 1 if the home team has possession, and 0 if the away team has possession.
are dummy variables for either “Defensive Rebound”, “Offensive Rebound”, or “Steal”.
9International Journal of Computer Science in Sport – Volume 12/2013/Edition 2 www.iacss.org
“Out of Bounds” has been normalized to 0. are the dummy variables that indicate the
offensive players on the court during the play, while "# are the dummy variables that
indicate the defensive players.
We have dummy variables for the 360 players2 who have participated in the most plays in our
data sample, and define all others to be “replacement level” players. , ,
, and ! are coefficients associated with the variables, for event i. Each
player has two ratings in any given event: offense and defense. Table 5 displays the regression
results for steals.
Table 5. Probit Estimation of Steals
% % % ⋅ % ⋅ %! ⋅ "#$
Estimate Std. Err. z value Pr(>|z|)
(Intercept) -1.4230 0.0187 -76.02 0.0%
Home Court -0.0128 0.0039 -3.29 0.1%
Dreb 0.0598 0.0045 13.39 0.0%
Oreb -0.1336 0.0069 -19.29 0.0%
Steal 0.0130 0.0082 1.57 11.5%
Offense Estimate Std. Err. z value Pr(>|z|) Defense Estimate Std. Err. z value Pr(>|z|)
Chris Paul -0.1483 0.0269 -5.51 0.0% Thabo Sefolosha 0.1169 0.0207 5.66 0.0%
Vince Carter -0.0927 0.0191 -4.85 0.0% Trevor Ariza 0.1045 0.0201 5.19 0.0%
Leandro Barbosa -0.0951 0.0200 -4.76 0.0% Renaldo Balkman 0.1348 0.0265 5.09 0.0%
Kobe Bryant -0.1149 0.0247 -4.65 0.0% Gerald Wallace 0.1063 0.0214 4.96 0.0%
Joe Johnson -0.1141 0.0249 -4.59 0.0% C.J. Watson 0.1156 0.0239 4.84 0.0%
Tyreke Evans -0.1521 0.0343 -4.43 0.0% Chuck Hayes 0.1051 0.0226 4.66 0.0%
Stephon Marbury -0.1132 0.0293 -3.86 0.0% Ronnie Brewer 0.0970 0.0209 4.63 0.0%
LeBron James -0.0856 0.0223 -3.84 0.0% Monta Ellis 0.0856 0.0190 4.50 0.0%
Rajon Rondo -0.0959 0.0254 -3.78 0.0% Devin Harris 0.0929 0.0211 4.41 0.0%
Jannero Pargo -0.0982 0.0261 -3.77 0.0% Thaddeus Young 0.0939 0.0215 4.36 0.0%
… best 10 above, worst 10 below … … best 10 above, worst 10 below …
Dwight Howard 0.0739 0.0232 3.18 0.1% J.J. Hickson -0.1060 0.0340 -3.11 0.2%
Bonzi Wells 0.0981 0.0304 3.22 0.1% Fabricio Oberto -0.0835 0.0260 -3.21 0.1%
Brook Lopez 0.0955 0.0293 3.26 0.1% Andres Nocioni -0.0672 0.0198 -3.39 0.1%
Shaquille O'Neal 0.0652 0.0199 3.28 0.1% Jermaine O'Neal -0.0739 0.0203 -3.63 0.0%
Louis Amundson 0.1078 0.0327 3.30 0.1% Wally Szczerbiak -0.0909 0.0245 -3.71 0.0%
Andris Biedrins 0.0712 0.0206 3.45 0.1% Joel Anthony -0.1145 0.0301 -3.80 0.0%
Ryan Hollins 0.0993 0.0279 3.56 0.0% Andrea Bargnani -0.0809 0.0207 -3.91 0.0%
Andrew Bogut 0.0866 0.0242 3.57 0.0% Amare Stoudemire -0.1041 0.0241 -4.31 0.0%
Chris Kaman 0.0921 0.0204 4.51 0.0% Erick Dampier -0.1109 0.0248 -4.48 0.0%
Eddy Curry 0.1471 0.0286 5.15 0.0% Mike Miller -0.0918 0.0202 -4.54 0.0%
For example, if Rajon Rondo plays on the road on a team with four other replacement level
players, against a team with five replacement level players, the probability of a steal for a
possession that started out-of-bounds would be:
% & '1.423 ' 0.0128 ∗ 0 ' 0.0959$ & 6.4% if Rondo’s team has the ball
% & '1.423 ' 0.0128 ∗ 1 0.0937$ & 9.0% if Rondo’s opponent has the ball
2 We use 360 players since there are 30 NBA teams and twelve players are allowed to play in a given game. Thus, replacement
players are those who would likely be the worst player on any team. If we change the number of players, then the PORP
numbers will change, since the cutoff for a replacement player will be different. The other results, including synergies calculated,
however, will not be materially different.
10International Journal of Computer Science in Sport – Volume 12/2013/Edition 2 www.iacss.org
We bucket each event into the following “skill” categories:
Ball-handling Category: Steal, Non-steal turnover
Rebounding Category: Rebound of a missed field goal, Rebound of a missed free throw
Scoring Category: Made field goal (2 or 3 points), Missed field goal, Made free throw (1, 2, 3,
or 4 points), Missed free throw (0, 1, 2, or 3 points).
Features of the Model
Uses simulations to estimate both mean and variance of outcomes
The SPM framework estimates how the start-of-play state variable (defensive rebound,
offensive rebound, steal or out of bounds) affects the probability of an outcome. If we start a
game with an out of bounds play, we are able to simulate an entire basketball game, since we
can use the estimated coefficients to estimate the probability of every possible outcome and the
resultant end-of-play state variable. We can then convert these simulations into winning
percentages and point differentials. To rate each player, we simulate games with the player and
four “replacement-level” players on one team, and five “replacement level” players on the
other team.
Possession
Start Event Sub-event Points Sub-event Change End**
Steal Steal 0 Yes Steal \
/
OOB Non-Steal 0 Yes OOB \
Turnover /
Made 2,3 Yes OOB \
Oreb FGA /
Oreb No Oreb \
Missed 0 /
Dreb Yes Dreb \
/
Made 1,2,3,4 Yes OOB \
Dreb FTA* /
Oreb No Oreb \
Missed 0,1,2,3 /
Dreb Yes Dreb \
/
Figure 1. Flow chart of events.34
Figure 1 shows the “flow chart” of the simulations. The probabilities associated with each
node in the chart are calculated using the point estimates of the nested probit model we
estimated. For the analysis done in this paper, we do not simulate games since each simulation
is computationally time-consuming. Instead, we calculate a “steady-state” level of outcomes
which would occur if a game has infinite length. We rank each player by the estimated point
differential of an average length game that starts and ends in this “steady state.” The results are
not materially different from a simulation that starts with an out-of-bounds play. Using this
* Free throw events include “and-1” situations.
** Steals, Oreb, and Dreb sometimes end with an OOB situation if a timeout is taken or a non-shooting foul is committed, for
example.
11International Journal of Computer Science in Sport – Volume 12/2013/Edition 2 www.iacss.org
“steady state” approach, we do not calculate a range of outcomes. Instead, we calculate
expected point differentials using the point estimates of the player skill parameters.
Models at the “play” level instead of the “possession level”
Imagine a situation where a team misses five consecutive field goals, and grabs five
consecutive offensive rebounds, before finally making a field goal. Traditional APM will
consider that sequence of events one possession which results in two points. Our SPM
framework will instead count six plays, five of which end in missed field goals and offensive
rebounds, and the sixth resulting in a made field goal. SPM will determine that the team with
the ball has poor scoring skills but excellent offensive rebounding skills. Our framework
distinguishes this sequence of events from a situation where the team immediately scores a
field goal, since the outcomes were achieved in dramatically different ways. In the former
scenario, the defensive team may want to counter with a defensive rebounder, while in the
latter scenario, the defensive team could counter with a stronger on-the-ball defender.
Considers how a play starts
Unlike traditional APM, our framework identifies how each play starts: out-of-bounds, steal,
defensive rebound or offensive rebound. We find that the start variable materially affects the
outcome of the play. For example, we find that if a play starts with a steal, the average points
scored increases from 0.83 to 1.04.
Reveals the strengths and weaknesses of each player
SPM provides granularity to a player’s offensive and defensive ratings. If a player is a strong
defender, is it because they create steals, prevent scoring, or grab defensive rebounds?
Results and Discussion
Individual Player Ratings
In this section we provide the results of the skill ratings of the 360 players who participated in
the most plays in our data sample. See the Appendix for the various tables of player ratings. To
estimate the contribution of each skill (e.g. steals), we isolate a player’s “steals” ratings, and set
his other skills to replacement levels. For example, we create a fictional player who has
Ronnie Brewer’s “steals” ratings, but is replacement level in all other skills. We then simulate
games where one team consists of the fictional player and four replacement players, and their
opponent utilizes five replacement players. The estimated point differential of this game is the
player’s ratings for that particular skill. For example, we estimate that Ronnie Brewer’s
defensive ball-handling skills are worth 3.2 points per game.
We rank the players by Points Over Replacement Player (“PORP”), the average expected point
differential if the player plays an entire game with replacement players. For instance, a team
with LeBron James and four replacement players would outscore a team with five replacement
players by 15.1 points per game on average. The weighted average PORP across our data set is
2.82 points. The high rating of LeBron James provides some validation of our model, since
many experts considered him the best player in the NBA during the four seasons in our data
set5. Also, not surprisingly, a point guard (Chris Paul) is rated the best ball-handler, while the
5
LeBron James received the most total votes for Most Valuable Player from 2006-2007 to 2009-2010. Source:
www.basketball-reference.com.
12International Journal of Computer Science in Sport – Volume 12/2013/Edition 2 www.iacss.org
best rebounders are generally power forwards and centers (e.g Jason Collins).
SPM Can Predict Which Skills Go Well with Each Other
To investigate synergies, we took the best players in the six skills and isolated their skills by
setting their other skills to zero, or replacement level. We then tested 6 ∗ 7/2 & 21
combinations to see which skills have synergies. The six players are shown in Table 6.
Table 6. The best players in each of the six skills.
Offensive Defensive
Ballhandling Chris Paul Ronnie Brewer
Rebounding Reggie Evans Jason Collins
Scoring Steve Nash Kevin Garnett
We measured synergies by how many additional points a combination of two skills create. For
example, Chris Paul's offensive ballhandling is worth 4.8 points, while Reggie Evans' offensive
rebounding is worth 3.1 points. We calculate that a team with Chris Paul's offensive
ballhandling and Reggie Evans’ defensive rebounding will have a 8.1 point advantage.
Therefore we calculate synergies as worth 0.2 points (8.1-4.8-3.1). Synergies are the difference
between the point differential of the combined team and the sum of the two individual players;
they tell us which types of players work well with one another. Table 7 has the results. We
highlight a few of the bigger numbers.
Table 7. Synergies between skills.
Offensive ballhandling (preventing turnovers) has negative synergies with itself (-0.825)
because a lineup with one great ballhandler does not need another. Defensive ballhandling
(creating turnovers) has positive synergies with itself (0.307) because defenders who create
turnovers feed off each other, creating more turnovers than they would individually. Offensive
scoring has negative synergies with itself (-0.826) because players must share one ball.
Defensive scoring has negative synergies with itself (-0.284) because most defensive stands
end with a stop anyway.
Offensive rebounding has positive self-synergies (0.293), while defensive rebounding has
negative self-synergies (-0.394). This differential sign illustrates a larger aspect of SPM.
Because synergy is the excess to the total beyond the sum of the individual parts, any skill that
adds to an event that is already likely to happen (such as securing a defensive rebound) will not
give as much benefit as a skill that adds to an event that is unlikely to happen (such as securing
an offensive rebound).
The cross-terms are more complex. Offensive ballhandling has positive synergies with
offensive rebounding (0.550) because offensive ballhandling helps a team convert possessions
into shot attempts, and offensive rebounding increases the number of possessions over which
the ballhandler can protect the ball. Similarly, offensive ballhandling has positive synergies
13International Journal of Computer Science in Sport – Volume 12/2013/Edition 2 www.iacss.org
with offensive scoring (0.550) because the team receives more scoring opportunities, and those
opportunities are good ones.
Offensive scoring has positive synergies with defensive rebounding (0.254) and negative
synergies with offensive rebounding (-0.191) because defensive rebounding increases the
number of potential scoring opportunities while offensive rebounding is more valuable when
offensive scoring is low, since poor offensive players generate more offensive rebounding
opportunities.
Empirical Evidence Suggests that Synergies Exist
Our framework predicts that skills that affect rare events (e.g. steals, offensive rebounds) will
have positive synergies, while skills that contribute to common events (e.g. defensive
rebounds) will have negative synergies. This feature is a result of our nested probit
specification. Is this specification realistic? Do two players with strong defensive ballhandling
skills create more turnovers than one? In this section, we investigate empirical evidence to
validate our model.
We sorted the 987,343 observations into one hundred buckets, ordered by predicted steals.
Within each bucket (each with 9873 or 9874 observations), we calculated the total predicted
steals and the total actual steals. In the following scatterplot, we graph the one hundred data
points, each representing a bucket of actual steals and predicted steals. If positive synergies in
steals do not exist, then we would see that actual steals are less than predicted steals, for both
low and high levels of predicted steals. For medium levels of predicted steals, we would see
actual steals are higher than predicted steals. Instead, we see that actual steals are well within
the 95% confidence intervals of predicted steals across all levels: only three points out of one
hundred fall outside, two below and one above. This evidence suggests that our choice of
probit to model the synergies in steals is a reasonable one.
Figure 3: Actual Steals (y-axis) versus Predicted Steals (x-axis), with 95% probability confidence bands
14International Journal of Computer Science in Sport – Volume 12/2013/Edition 2 www.iacss.org
Figure 4: Actual Offensive Rebounds (y-axis) versus Predicted Offensive Rebounds (x-axis),
with 95% probability confidence bands
Our framework also predicts that offensive rebounding has positive synergies with itself.
Using the same methodology, we plot actual offensive rebounds versus predicted offensive
rebounds. We have 407,154 missed field goals in our data set, so that each bucket contains
4,071 or 4072 observations. The above scatterplot shows that only four points out of one
hundred fall outside the 95% confidence bands. These two scatterplots suggest that positive
synergies do exist for both steals and offensive rebounds, as our framework predicts.
SPM Can Be Used to Calculate Synergies for Each NBA Team
For each NBA team, we formed lineups using the top five players in terms of plays played in
our data sample. We calculated their ratings individually and as the 5-player lineup. For a
given lineup of players x1, x2, x3, x4 and x5, define PORP(x1,x2,x3,x4,x5) to be the estimated
point differential between a game played by this team of players against a lineup of
replacement players (“RP”).
We then define synergies as the difference of the sum-of-the-parts from the team total:
671, 72, 73, 74, 75$ ' 671, 6, 6, 6, 6$ ' 672, 6, 6, 6, 6$
' 673, 6, 6, 6, 6$ ' 674, 6, 6, 6, 6$
' 675, 6, 6, 6, 6$
The results are in Table 8. Orlando’s lineup has the highest amount of synergies, over one
point per game, while Minnesota’s negative synergies cost their lineup just under one point per
game. Using the Pythagorean expectation formula with coefficients between 14 and 16.5 (c.f.
Morey 1993), 1-2 points per game can translate into 3-6 wins per season (for a team that would
otherwise score and allow 100 points per game). Thus a team that consistently fields a highly
positively synergistic lineup will win up to six games more than if it consistently fields a highly
negatively synergistic lineup. Such a differential could be the difference between making or
missing the playoffs.
To investigate why Orlando’s lineup has positive synergies, we replace players from their
lineup one-by-one with replacement players and see how the synergies change. We find that
Jameer Nelson and Hedo Turkoglu play well together. Our framework suggests that Nelson’s
superior ballhandling skills complement Turkoglu’s offensive skills, since Nelson gives
15International Journal of Computer Science in Sport – Volume 12/2013/Edition 2 www.iacss.org
Turkoglu more chances to score.
Using the same method, we find that Minnesota’s Ryan Gomes and Randy Foye are not good
fits since they are both good offensive players who protect the ball well. As noted earlier, our
framework predicts negative synergies for both offense (since the players must share the ball)
and offensive ball-handling (since one good ball-handler is enough for one lineup).
Table 8. Synergies within teams.
Player1 Player2 Player3 Player4 Player5 Separate Combined Synergies
ORL D. Howard R. Lewis H. Turkoglu J. Nelson K. Bogans 24.3 25.6 1.2
CLE L. James A. Varejao Z. Ilgauskas D. Gibson M. Williams 30.7 31.8 1.1
IND D. Granger T. Murphy M. Dunleavy J. Foster B. Rush 18.2 19.3 1.1
DEN C. Anthony N. Hilario J. Smith K. Martin A. Iverson 14.9 16.0 1.1
SAC K. Martin B. Udrih J. Salmons F. Garcia B. Miller 12.9 14.0 1.0
NOK D. West C. Paul P. Stojakovic T. Chandler R. Butler 23.0 23.8 0.8
DAL D. Nowitzki J. Terry J. Howard J. Kidd E. Dampier 25.4 26.0 0.6
LAL K. Bryant L. Odom D. Fisher P. Gasol A. Bynum 28.1 28.6 0.4
NJN V. Carter D. Harris B. Lopez R. Jefferson J. Kidd 23.6 24.0 0.4
SEA K. Durant J. Green N. Collison E. Watson R. Westbrook 18.6 18.8 0.2
DET T. Prince R. Hamilton R. Wallace R. Stuckey J. Maxiell 15.4 15.5 0.1
BOS P. Pierce R. Rondo R. Allen K. Perkins K. Garnett 29.4 29.5 0.0
UTA D. Williams M. Okur C. Boozer A. Kirilenko P. Millsap 25.0 25.0 0.0
HOU S. Battier L. Scola R. Alston T. McGrady C. Hayes 22.3 22.3 0.0
GSW M. Ellis A. Biedrins S. Jackson B. Davis K. Azubuike 18.0 18.0 0.0
PHI A. Iguodala S. Dalembert A. Miller W. Green T. Young 18.6 18.5 -0.1
CHA R. Felton G. Wallace E. Okafor B. Diaw M. Carroll 13.2 13.1 -0.2
LAC C. Kaman A. Thornton C. Mobley E. Gordon B. Davis 10.2 10.0 -0.2
TOR C. Bosh A. Bargnani J. Calderon A. Parker R. Nesterovic 19.1 18.9 -0.2
CHI L. Deng K. Hinrich B. Gordon D. Rose J. Noah 19.8 19.5 -0.3
MIA D. Wade U. Haslem M. Chalmers M. Beasley D. Cook 18.0 17.7 -0.4
NYK D. Lee N. Robinson W. Chandler J. Crawford J. Jeffries 14.3 13.9 -0.4
ATL J. Johnson J. Smith M. Williams A. Horford M. Bibby 20.0 19.6 -0.4
PHX S. Nash A. Stoudemire L. Barbosa G. Hill R. Bell 26.2 25.6 -0.6
POR B. Roy L. Aldridge T. Outlaw S. Blake M. Webster 19.6 19.0 -0.6
MEM R. Gay M. Conley O. Mayo H. Warrick M. Gasol 10.0 9.4 -0.6
WAS A. Jamison C. Butler D. Stevenson A. Blatche B. Haywood 18.2 17.6 -0.6
MIL A. Bogut C. Bell M. Redd C. Villanueva M. Williams 14.6 13.9 -0.7
SAS T. Duncan T. Parker M. Ginobili M. Finley B. Bowen 25.8 25.1 -0.7
MIN R. Gomes A. Jefferson R. Foye C. Brewer C. Smith 8.2 7.3 -0.8
SPM Gives Context Dependent Player Ratings
An implication of the SPM framework is that player values depend upon the other players on
the court. To illustrate this concept, we took the top four players in terms of plays played for
each team. We then put everyone else into a "free agent" pool. For each team, we calculated
which free agent would be the best fit for the remaining four players. In this analysis, Kevin
Garnett is a “free agent” because he switched teams from Minnesota to Boston in our data
sample, and played only the fifth highest number of minutes for Boston. Not surprisingly, he
would be the most coveted free agent by every single team. Russell Westbrook, a “free agent”
because he played only two seasons in our data sample, is likewise highly coveted. There are,
however, significant differences among the more marginal players. For example, Eddie Jones,
although retired, would fit well in a team like Minnesota (who rank him the fourth most
desirable free agent), but would not fit in on the Spurs (who rank him seventeenth). Likewise,
Marcus Camby would be coveted by the Knicks or Nets (ranked sixth), but not by the Pacers
(ranked nineteenth).
16International Journal of Computer Science in Sport – Volume 12/2013/Edition 2 www.iacss.org
Table 9 shows the “free agent” fits for each team.
Table 9: “Free agents” and synergies.
Top Choice 2nd Choice 3rd Choice 4th Choice 5th Choice 6th Choice
CHI K. Garnett R. Westbrook A. Johnson N. Batum R. Hibbert C. Billups
PHX K. Garnett R. Hibbert A. Johnson R. Westbrook N. Batum B. Jennings
ATL K. Garnett A. Johnson R. Westbrook R. Hibbert N. Batum E. Jones
HOU K. Garnett A. Johnson R. Westbrook R. Hibbert N. Batum T. Young
IND K. Garnett R. Westbrook A. Johnson N. Batum C. Billups B. Jennings
LAC K. Garnett A. Johnson R. Westbrook N. Batum R. Hibbert C. Billups
MIL K. Garnett A. Johnson R. Westbrook R. Hibbert N. Batum T. Young
NOK K. Garnett A. Johnson R. Westbrook N. Batum R. Hibbert C. Billups
NYK K. Garnett R. Westbrook A. Johnson R. Hibbert N. Batum M. Camby
POR K. Garnett R. Westbrook A. Johnson N. Batum R. Hibbert C. Billups
TOR K. Garnett R. Westbrook A. Johnson R. Hibbert N. Batum C. Billups
WAS K. Garnett R. Westbrook A. Johnson R. Hibbert N. Batum C. Billups
DEN K. Garnett R. Westbrook C. Billups N. Batum A. Johnson B. Jennings
SAS K. Garnett A. Johnson R. Westbrook R. Hibbert N. Batum Y. Ming
CHA K. Garnett A. Johnson R. Westbrook N. Batum R. Hibbert T. Young
CLE K. Garnett R. Westbrook A. Johnson N. Batum R. Hibbert C. Billups
DET K. Garnett A. Johnson R. Westbrook R. Hibbert N. Batum T. Young
MIN K. Garnett A. Johnson R. Westbrook E. Jones N. Batum R. Hibbert
NJN K. Garnett R. Westbrook A. Johnson N. Batum R. Hibbert M. Camby
PHI K. Garnett A. Johnson R. Westbrook R. Hibbert N. Batum T. Young
SAC K. Garnett R. Westbrook N. Batum C. Billups A. Johnson R. Hibbert
SEA K. Garnett R. Westbrook A. Johnson R. Hibbert C. Billups N. Batum
UTA K. Garnett R. Westbrook A. Johnson R. Hibbert N. Batum T. Young
BOS K. Garnett R. Westbrook A. Johnson N. Batum R. Hibbert T. Young
DAL K. Garnett R. Westbrook N. Batum A. Johnson R. Hibbert C. Billups
MEM K. Garnett R. Westbrook A. Johnson C. Billups N. Batum E. Jones
LAL K. Garnett R. Westbrook A. Johnson R. Hibbert N. Batum C. Billups
MIA K. Garnett R. Westbrook A. Johnson N. Batum R. Hibbert E. Jones
ORL K. Garnett R. Westbrook A. Johnson N. Batum R. Hibbert B. Jennings
GSW K. Garnett R. Westbrook A. Johnson N. Batum R. Hibbert T. Young
Using SPM to Find Mutually Beneficial Trades
Other player rating systems like WP or Win Shares (see Oliver 2004) cannot generate ex-ante
mutually beneficial trades because one player is always ranked higher than another (unless the
distribution of minutes is changed). In contrast, the SPM framework can generate mutually
beneficial trades because each potential lineup has different synergies. We examined every
possible two player trade from one team’s starting five to another team’s starting five. There
are a total of 30 ⋅ 29/2 & 435 possible team trading partners. Each pair of teams has 5 ⋅ 5 &
25 possible trades, so there are 435 ∗ 25 & 10,875 possible trades. We found 222 mutually
beneficial trades, or 2% of all possible trades. These trades do not consider the distribution of
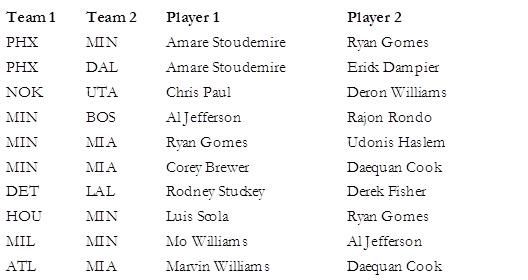
minutes or the composition of the team’s bench. Table 10 lists a few trades.
Figure 2 shows the network of the 222 mutually beneficial trades among the various teams.
Not surprisingly, the teams with the lowest synergies (Minnesota and San Antonio) have the
most possible trading partners and are near the interior of this “trade network”. Meanwhile the
teams with the highest synergies (Orlando and Cleveland) have the fewest trading partners and
are on the perimeter.
Why is Chris Paul for Deron Williams a mutually beneficial trade? Overall, our SPM ratings
rate Chris Paul and Deron Williams nearly the same, but with differences in skills. Paul is a
better ballhandler, Williams a slightly better rebounder, and Williams is better at offense and
defense. See Table 11.
17International Journal of Computer Science in Sport – Volume 12/2013/Edition 2 www.iacss.org
Table 10. Some mutually beneficial trades.
Table 11. Comparison of Chris Paul and Deron Williams
Off Def Off Def Off Def
Ballhand. Ballhand. Rebound. Rebound. Scoring Scoring
Chris Paul 4.8 1.2 -0.4 -1.4 4.7 -0.9
Deron Williams 1.9 -0.3 -1.7 0.1 6.5 1.4
Figure 2. Trade network of mutually beneficial trades.
The SPM framework predicts that Chris Paul is a better fit for Utah because he creates a lot of
steals (3.1 steals per 48 minutes (“SP48M”)), while no one else in the New Orleans lineup does
(West 1.0 SP48M, Stojakovic 1.1, Chandler 0.7, Butler 0.9). Utah, on the other hand, has
18International Journal of Computer Science in Sport – Volume 12/2013/Edition 2 www.iacss.org
many players who create steals (Kirilenko 2.0, Boozer 1.5, Millsap 1.7, Okur 0.9, Williams
1.4). Because defensive steals has positive synergies in our system, Chris Paul's ballhawking
skills fit better in Utah, where he can team up with others and wreak havoc to opponents'
ballhandlers.
Conversely, why would New Orleans trade for Deron Williams? Our framework predicts that
Williams is a better offensive fit with New Orleans. There are negative synergies between two
good offensive players since they must share only one ball, and the New Orleans starters take
fewer shots than Utah’s. At New Orleans, Deron Williams would not need to share the ball
with so many players.
The Utah lineup of Williams (PG), Okur (F-C), Boozer (F-C), Kirilenko (F) and Millsap (F)
may seem big. The next player on Utah’s roster in terms of plays in our sample is Ronnie
Brewer (G-F). If we substitute Millsap for Brewer, the case for a Deron Williams for Chris
Paul trade becomes stronger, since Brewer is good at steals (2.7 SP48M).
Conclusion
We provide a novel Skills Plus Minus (“SPM”) framework that can be used to measure
synergies within basketball lineups, provide roster-dependent rankings of free agents, and
generate mutually beneficial trades. To our knowledge, the SPM framework is the first system
that can generate ex-ante mutually beneficial trades without a change in the minutes played.
Other ranking systems cannot generate mutually beneficial trades because one player is always
ranked ahead of another.
Future research could use the SPM framework to calculate the optimal substitution patterns that
maximize overall synergies given a fixed distribution of minutes played to each player,
highlight the risks and exposures each team with respect to the specific skills, and evaluate the
possibility of a separate synergy factor of players that may improve the skills of their
teammates by even more than would be suggested by the synergies of the skills.
Acknowledgments
The authors thank the two anonymous reviewers, Kevin Arnovitz, David Berri, Jeff Chuang,
Harry Gakidis, Matt Goldman, Shane Kupperman, Irwin Lee, Wayne Winston, and members of
the APBRmetrics forum for their helpful feedback and comments.
References
Berri, D., Jewell, R. (2004). Wage inequality and firm performance: Professional basketball's
natural experiment. Atlantic economic journal, 32(2), 130-139.
Berri, D. (1999). Who is most valuable? Measuring the player’s production of wins in the
National Basketball Association. Managerial and Decision Economics, 20, 411-427.
Berri, D. (2008). A simple measure of worker productivity in the National Basketball
Association. In Brad Humphreys and Dennis Howard (Eds.), The Business of Sport, 3
volumes (pp. 1-40). Westport, Conn.: Praeger.
Berri, D., Brook, S. (1999). Trading players in the National Basketball Association: For better
or worse. In John Fizel, Elizabeth Gustafson, and Larry Hadley (Eds.), Sports
Economics: Current Research (pp. 135-151).
Berri, D., Schmidt, M. (2010). Stumbling on Wins: Two Economists Explore the Pitfalls on
the Road to Victory in Professional Sports. Princeton, NJ: Financial Times Press.
19International Journal of Computer Science in Sport – Volume 12/2013/Edition 2 www.iacss.org
Bollinger, C., Hotchkiss, J. (2003). The upside potential of hiring risky workers: Evidence
from the baseball industry. Journal of labor economics, 21(4), 923-944.
ElGee (2011). Interpreting advanced statistics in basketball. Retrieved from
http://www.backpicks.com/2011/01/24/interpreting-advanced-statistics-in-basketball.
Fearnhead, P., Taylor, B. (2011). On estimating the ability of NBA players. Journal of
quantitative analysis in sports, 7(3), Article 11.
Idson, T., Kahane, L. (2000), Team effects on compensation: An application to salary
determination in the National Hockey League. Economic inquiry 38(2), 345-357.
Kubatko, J., Oliver, D., Pelton, K., Rosenbaum, D. (2007). A starting point for analyzing
basketball statistics. Journal of quantitative analysis in sports 3(3), Article 1.
MacDonald, D., Reynolds, M. (1994). Are baseball players paid their marginal products?
Managerial and decision economics, 15(5), 443-457.
Morey, D. (1993). In John Dewan, Don Zminda, STATS, Inc. Staff, STATS Basketball
Scoreboard (p. 17). STATS, Inc..
Oliver, D. Basketball on paper. Potomac Books Inc..
Pelton, K. (2010). WARP2 electric boogaloo. Retrieved from
http://basketballprospectus.com/article.php?articleid=1209.
Rosenbaum, D. (2004). Measuring how NBA players help their teams win. Retrieved from
http://www.82games.com/comm30.htm.
20International Journal of Computer Science in Sport – Volume 12/2013/Edition 2 www.iacss.org
Appendix: Player Ratings
Best and Worst Overall
Best PORP Worst PORP
LeBron James 15.1 Johan Petro -3.3
Steve Nash 14.3 Gerald Green -3.3
Dwyane Wade 13.5 Joel Anthony -3.8
Kevin Garnett 13.3 Brian Skinner -4.5
Kobe Bryant 10.2 Dominic McGuire -4.5
Dirk Nowitzki 9.7 Hakim Warrick -4.9
Tim Duncan 9.6 Earl Boykins -5.4
Chris Bosh 9.5 Eddy Curry -6.7
Manu Ginobili 9.4 Josh Powell -7.8
Russell Westbrook 9.4 J.J. Hickson -8.8
Best and Worst Offensive Ballhandling (preventing steals and turnovers)
Best PORP Worst PORP
Chris Paul 4.8 Mikki Moore -2.4
Brandon Jennings 4.6 Andrew Bogut -2.4
Kobe Bryant 4.3 Louis Amundson -2.5
Sasha Vujacic 3.8 Hilton Armstrong -2.7
Sam Cassell 3.6 Kwame Brown -2.8
LeBron James 3.3 Yao Ming -2.8
Chauncey Billups 3.2 Ryan Hollins -3.3
Mike Conley 3.1 Kendrick Perkins -3.4
Daequan Cook 3.1 Joel Przybilla -3.5
Jason Terry 3.0 Eddy Curry -6.3
Best and Worst Defensive Ballhandling (creating steals and turnovers)
Best PORP Worst PORP
Ronnie Brewer 3.2 Tim Duncan -2.0
Gerald Wallace 2.9 Michael Finley -2.3
Thabo Sefolosha 2.9 Brook Lopez -2.4
Devin Harris 2.9 Aaron Brooks -2.5
Monta Ellis 2.8 Andrew Bynum -2.5
Renaldo Balkman 2.8 Taj Gibson -2.6
Rajon Rondo 2.7 Joel Anthony -2.8
Luc Richard Mbah a Moute 2.7 Amare Stoudemire -3.3
C.J. Watson 2.7 Erick Dampier -3.6
Eddie Jones 2.7 J.J. Hickson -4.2
21International Journal of Computer Science in Sport – Volume 12/2013/Edition 2 www.iacss.org
Best and Worst Offensive Rebounding
Best PORP Worst PORP
Reggie Evans 3.1 Chris Quinn -1.9
Matt Harpring 3.0 Jannero Pargo -2.0
Kevin Love 2.9 Donte Greene -2.0
Jeff Foster 2.7 Brandon Rush -2.1
Jason Maxiell 2.6 Rashard Lewis -2.3
Louis Amundson 2.5 Damon Stoudamire -2.3
Leon Powe 2.2 Danilo Gallinari -2.4
Amir Johnson 2.1 Travis Diener -2.5
Joakim Noah 2.0 Stephen Curry -2.8
Jared Jeffries 2.0 Jonny Flynn -2.8
Best and Worst Defensive Rebounding
Best PORP Worst PORP
Jason Collins 3.0 Francisco Garcia -1.5
Tim Duncan 2.6 Sasha Vujacic -1.5
Joel Przybilla 2.5 Eddie House -1.6
Jeff Foster 2.5 Josh Childress -1.6
Andrew Bogut 2.3 Dominic McGuire -1.6
Zydrunas Ilgauskas 2.3 Darren Collison -1.6
Nene Hilario 2.2 Charlie Bell -1.7
Roy Hibbert 2.2 Jamaal Tinsley -1.8
Rasho Nesterovic 2.2 Travis Diener -2.1
Samuel Dalembert 2.0 Earl Boykins -2.1
Best and Worst Offense (assuming no turnovers)
Best PORP Worst PORP
Steve Nash 12.7 James Singleton -2.3
Dwyane Wade 9.4 Josh Powell -2.3
LeBron James 7.8 Hilton Armstrong -2.4
Deron Williams 6.5 Louis Amundson -2.4
Kevin Martin 6.4 Brian Skinner -2.4
Kobe Bryant 6.3 Ben Wallace -2.5
Goran Dragic 6.2 Jason Collins -2.7
Dirk Nowitzki 5.9 Eric Snow -3.0
Manu Ginobili 5.9 Renaldo Balkman -3.4
Danny Granger 5.9 Nene Hilario -3.7
22International Journal of Computer Science in Sport – Volume 12/2013/Edition 2 www.iacss.org
Best and Worst Defense (assuming no turnovers)
Best PORP Worst PORP
Kevin Garnett 6.2 Damien Wilkins -3.0
Brendan Haywood 5.7 Josh Powell -3.0
Tim Duncan 5.4 Kevin Martin -3.0
Joel Przybilla 5.2 Gerald Green -3.0
Amir Johnson 5.0 Marreese Speights -3.2
Andrew Bogut 4.8 Juan Carlos Navarro -3.2
Chris Andersen 4.5 Royal Ivey -3.4
Jacque Vaughn 3.9 Jose Calderon -3.4
Yao Ming 3.9 Sasha Vujacic -3.7
Kendrick Perkins 3.9 Will Bynum -4.2
23You can also read