USER EXPERIENCE ANALYSIS OF ABC 19 RAPID TEST VIA LATERAL FLOW IMMUNOASSAYS FOR SELF ADMINISTRATED SARS COV 2 ANTIBODY TESTING
←
→
Page content transcription
If your browser does not render page correctly, please read the page content below
www.nature.com/scientificreports
OPEN User experience analysis
of AbC‑19 Rapid Test
via lateral flow immunoassays
for self‑administrated SARS‑CoV‑2
antibody testing
Min Jing1, Raymond Bond1, Louise J. Robertson2, Julie Moore2, Amanda Kowalczyk2,
Ruth Price2, William Burns1, M. Andrew Nesbit2, James McLaughlin1* & Tara Moore2,3*
Lateral flow immunoassays are low cost, rapid and highly efficacious point-of-care devices, which
have been used for SARS-CoV-2 antibody testing by professionals. However, there is a lack of
understanding about how self-administered tests are used by the general public for mass testing in
different environmental settings. The purpose of this study was to assess the user experience (UX)
(including usability) of a self-testing kit to identify COVID-19 antibodies used by a representative
sample of the public in their cars, which included 1544 participants in Northern Ireland. The results
based on 5-point Likert ratings from a post-test questionnaire achieved an average UX score of
96.03% [95% confidence interval (CI) 95.05–97.01%], suggesting a good degree of user experience.
The results of the Wilcoxon rank sum tests suggest that UX scores were independent of the user’s age
and education level although the confidence in this conclusion could be strengthened by including
more participants aged younger than 18 and those with only primary or secondary education. The
agreement between the test result as interpreted by the participant and the researcher was 95.85%
[95% CI 94.85–96.85%], Kappa score 0.75 [95% CI 0.69–0.81] (indicating substantial agreement). Text
analysis via the latent Dirichlet allocation model for the free text responses in the survey suggest
that the user experience could be improved for blood-sample collection, by modifying the method of
sample transfer to the test device and giving clearer instructions on how to interpret the test results.
The overall findings provide an insight into the opportunities for improving the design of SARS-CoV-2
antibody testing kits to be used by the general public and therefore inform protocols for future user
experience studies of point-of-care tests.
The SARS-CoV-2 pandemic has provided an impetus for the rapid development of laboratory and point-of-care
(PoC) diagnostic serological assays, which would meet a clinical need and fulfil epidemiological requirements
including vaccine response monitoring and research needs. Commercial professional tests including lab-based
immunoassays and lateral flow immunoassays (LFIA)1 were released into the market over very short time frames.
Well established, low-cost, rapid and highly efficacious PoC devices in the form of LFIA have been developed for
home pregnancy t ests2,3, HIV4,5, Influenza A (H1N1)6, and more recently for COVID-19 antibody t esting7–10.
Given the research community is currently trying to establish how long COVID-19 antibodies p ersist11,12, the
capability to rapidly test for the presence of these antibodies is a vital tool for understanding coronavirus related
public health planning.
According to Ara Darzi, Director of the Institute of Global Health Innovation, “The testing landscape is like
the wild west with no rules, no standards, and widely varying reliability. Even the most accurate test is useless
unless it is usable”13. Given the novelty of COVID-19, there is a paucity of research related to the user experi-
ence of COVID-19 related products, services, and testing kits by the general public. One s tudy7 which evalu-
ated a SARS-CoV-2 antibody test by LFIA stated that their patient and public involvement activities found that
1
Faculty of Computing, Engineering and the Built Environment, Ulster University, Jordanstown, UK. 2Biomedical
Sciences Research Institute, Ulster University, Coleraine, UK. 3Avellino USA, 1505 Adams Dr, Menlo Park,
CA 94025, USA. *email: jad.mclaughlin@ulster.ac.uk; tara.moore@ulster.ac.uk
Scientific Reports | (2021) 11:14026 | https://doi.org/10.1038/s41598-021-93262-0 1
Vol.:(0123456789)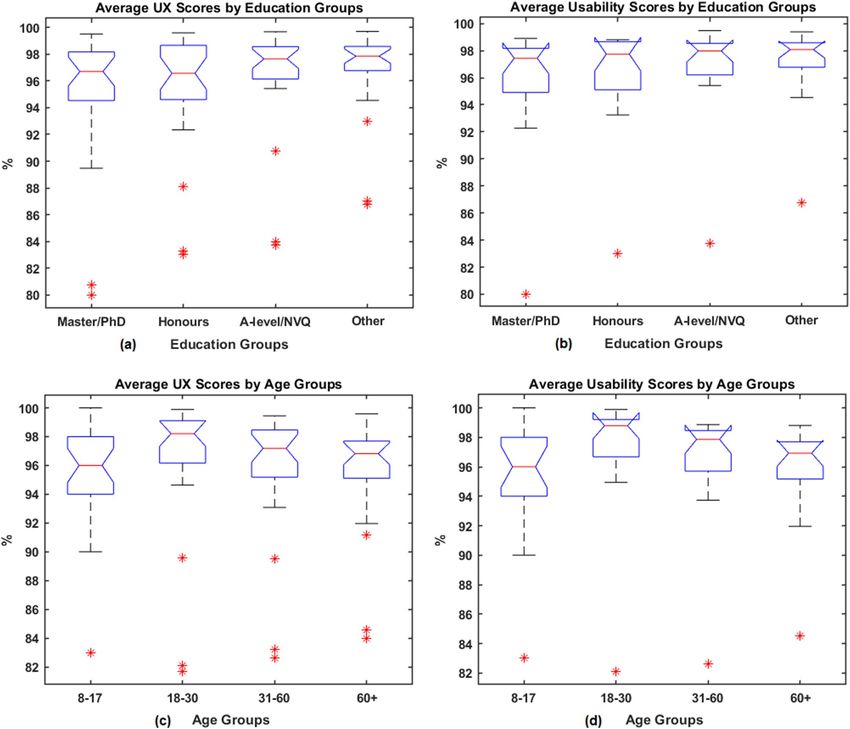
www.nature.com/scientificreports/
“user-expressed difficulties interpreting results motivated us to investigate agreement between self-reported and
clinician-reported results”. Hence, a follow-up usability and acceptability s tudy8 recruited members of the public
who self-administered an antibody test in a home environment. Feedback from pilot testing with 315 volunteers
helped the design of a nationally representative study using two types of LFIAs (by Guangzhou Wondfo Biotech
Co Ltd and Fortress Orient Gene Biotech Co Ltd) with 10,600 and 3,800 participants in England, completed
by 97.5% and 97.8% of r espondents8, respectively. Agreement between the participant and clinician interpreta-
tion of the results of the testing kits achieved Kappa scores of 0.72 and 0.89 for two LFIA tests respectively. The
presented usability analysis was only summarised by descriptive statistics based on data from questionnaires,
which identified the difficulties in use of the lancet, a need for clearer instructions for using the kit and inter-
pretation of results.
The purpose of our study was to evaluate whether the LFIA test can be easily understood and effectively self-
administered by a sample of citizens, without incidents of difficulty, confusion, or failure due to the test design.
Testing kits need to be user-friendly and intuitive for the majority of the citizens to perform the test correctly.
The UX analysis will help to improve the design of testing kits and inform protocols for future studies. This study
was led by Ulster University researchers, using the AbC-19 Rapid Test developed by Abingdon Health. When
this study was conducted, this device was approved for professional use in the UK and E U14. Unlike the previ-
8
ously published s tudy that was conducted in a home setting, in the study presented here, the tests were carried
out in an in-car setting at a university car park (due to the social distancing rules during the pandemic, the car
park was an environment in which this study could be safely conducted). The participants self-administered the
test in their own cars (overseen by the researchers), which had different environmental conditions and spatial
constraints compared to a home or laboratory setting.
To evaluate the participants’ ability to interpret their test result, we analysed the agreement between a partici-
pant’s self-reported result and the researcher’s interpretation of the same test, coupled with a post-test question-
naire to collect data regarding the user experiences of the testing kit. Several studies related to user experience
of LFIA self-testing conducted the analysis have used the similar approach (via evaluation of agreement and
questionnaire)2,4,8. Apart from studying the post-test survey data, we carried out the UX analysis based on user’s
age and education attainment. Testing the user experience of a product across educational levels and age is
important to show if a product is user friendly and independent of age and education, thereby the product can
be reliably released into communities with the reasonable expectation that it can be safely and intuitively used by
users of various demographics. Research from the usability literature15 suggests the importance of considering
age in testing which helps further justify this research question. Furthermore, we also carried out text analysis
based on the users’ free text responses to open questions in the survey, which helped identify opportunities to
improve the design of these testing kits. In this paper, we answer the following research questions:
• Do members of the public find the testing kit easy to use?
• Is ability to use the testing kit independent of age and education level?
• Which testing kit user experience issues are identified?
• What is the agreement rate between the results as interpreted by participants and researchers?
For clarity, this paper does not attempt to address or report on the diagnostic accuracy of the LFIA to detect
antibodies against SARS-CoV-2 virus, but instead is a study that was focused on the user experience and the
agreement rate between participants and trained researchers when interpreting the test results.
Materials and methods
Materials. The AbC-19 Rapid Test is a single-use test for the detection of SARS-CoV-2 IgG antibodies in
human capillary whole blood. Using a blood sample from a finger-stick puncture the Rapid Test will identify the
presence of IgG antibodies against the trimeric spike protein of SARS-CoV-2 virus (the virus responsible for the
COVID-19 disease), signifying a recent or previous infection by the virus. The test kit materials include: one test,
two single-use lancets, blood collector, test solution, waste bag and instructions. Fig. 1 presents: (a) structure of
the testing device showing the sample hole, viewing window with the control line (C-line) and test line (T-Line)
as an example of positive result; (b) example of negative result.
To perform testing, the participants followed the steps provided in the instruction (in Supplementary file):
(a) hands were cleaned using warm water only; (b) the blood sample was taken from the ring or middle finger
of the non-dominant hand by using the lancet; (c) the blood was collected using the blood collector; (d) blood
was added to the test sample hole, and the test solution was then applied to the sample hole; (e) after 20 minutes,
if C-line appears (indicating the test was performed successfully), the test results were interpreted by looking
at the viewing window.
Participants and study setup. Potential participants who had expressed an interest in taking part in the
study following either university or media publicity were invited to complete an online consent form and ques-
tionnaire which collected data such as gender, age, education, COVID-like symptoms etc. Individuals from each
age/gender group were randomly selected to achieve as balanced an overall cohort as representative of the NI
population as possible. No financial or other types of incentives were received by the participants.
All participants were members of the public in Northern Ireland and included children above the age of 8
years old and adults. Data collection was completed over 2 days, on 4th and 5th September 2020 in a car park at
Ulster University (address: Newtownabbey, Co. Antrim, Northern Ireland, UK). Informed consent was obtained
prior to commencing the study. Consent for children was provided by their parent/guardian. Consent could only
Scientific Reports | (2021) 11:14026 | https://doi.org/10.1038/s41598-021-93262-0 2
Vol:.(1234567890)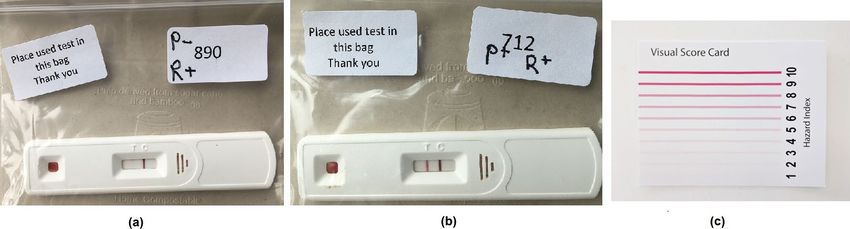
www.nature.com/scientificreports/
Figure 1. (a) structure of the testing device showing the sample hole, viewing window with the control line and
test line as an example of positive result; (b) an example of negative result.
Figure 2. The diagram for the study flow.
be given by individuals who were capable of independently understanding the information provided. Participants
aged between 8 and 17 years old could be assisted by their parent/guardian.
A diagram to illustrate the study flow is presented in Fig. 2. Participants were given prior access to written
instructions and a video on YouTube16 before the test. On arrival they were directed to a parking space, given
a test kit and performed the self-test within their cars. If no C-line was visible by using a single test kit, the
participant was asked to repeat the testing procedure. After participants obtained their results, a researcher
(one of 20 trained volunteers from university staffs and post-graduate students) would interpret the same tests
performed by participants. Interpretation of any queried results, e.g. a very weak T-line, lack of a C-line in LFIA,
was undertaken by three highly experienced LFIA users. The researchers also gathered participant responses to
a post-test questionnaire.
UX and usability analysis. According to ISO definition (ISO 9241-11)17, usability is related to “effective-
ness, efficiency and satisfaction with which specified users achieve specified goals in particular environments”,
whilst user experience is “A person’s perceptions and responses that result from the use and/or anticipated use of
a product, system or service. (ISO 9241-210)18. Although there are diverse definitions of UX, most agreed that
UX is more than just a product’s usefulness and u sability19–21. The aim of UX analysis in this study was to exam-
ine the user’s interaction with the testing kit and to identify the areas of difficulty encountered during testing; the
aim of usability analysis was to assess whether the testing kit was easy for users to complete the test successfully.
Both UX and usability were analysed, in which UX was considered a higher level construct (where usability is a
sub-component).
The data for the UX and usability analysis were collected from the post-test questionnaire (provided in Supple-
mentary file). The questionnaire was comprised of seven sections each of which included 3 to 6 questions based
on 5-point Likert rating scales, which measure the UX or usability of a particular aspect of the testing kit. There
were 28 Likert ratings in the seven sections which include: (Q1) outer packaging; (Q2) collection of finger-prick
blood sample; (Q3) application of sample to test; (Q4) application of test solution to the lateral flow device; (Q5)
development of a control line and interpretation of results; (Q6) instructions for use; (Q7) risks and warnings.
We considered that all questions in the survey that were related to UX. Questions not describing the usability
constructs, Q1a, Q2d, Q2e, Q2f, Q4d, Q7a, Q7b, Q7c and Q7d, were removed for the usability analysis. The rat-
ings for the questions in a section were counted and normalised as a percentage to provide a UX or usability score.
Age and education. A key concern for the LFIA self-testing is to ensure that the testing kit is inclusive and
usable to as many members of the public as possible, including the older population and those with lower educa-
tional attainment. To study whether the scores were affected by age or education levels, we categorised the par-
ticipants into four age groups (8-17, 18-30, 31-60 and age above 60) and four educational attainments (Master/
PhD, Honours Degree, A-level/NVQ (National Vocational Qualifications) and Primary/Secondary/Other edu-
cation). The range and the size of each age group are given in Table 1. Since older people generally suffer more by
Scientific Reports | (2021) 11:14026 | https://doi.org/10.1038/s41598-021-93262-0 3
Vol.:(0123456789)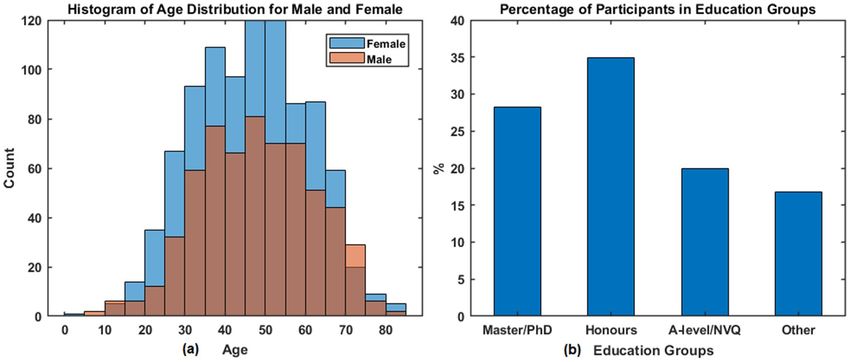
www.nature.com/scientificreports/
the SARS-CoV-2 virus due to their relative weak immune system, and that younger children may need assistance
from a parent/guardian, we had additional discussion for these cohorts (those aged 8-17 and those aged over 60).
Statistical analysis. Statistical analysis was carried out to assess whether the UX and usability scores were
independent of the education and the age of the participant based on the Wilcoxon rank-sum tests (for data that
were not normally distributed). The Bonferroni c orrection22 was applied to adjust the significance level during
multiple hypothesis testing.
Kappa statistic23–25 was used to evaluate the agreement between the participant and researcher interpreted
results, which has been the metric of choice in a home-based COVID-19 antibody self-testing s tudy8 and HIV
rapid diagnostic t ests26–28. (Kappa score was calculated using MATLAB source c ode29). The range of Kappa scores
can be interpreted as follows30 :< 0 = poor agreement, 0.00–0.20 = slight agreement, 0.21–0.40 = fair agreement,
0.41–0.60 = moderate agreement, 0.61–0.80 = substantial agreement, and> 0.8 = almost perfect agreement. The
agreement rate was also measured by the percentage of cases where the participant and the researcher agreed
when interpreting the test result.
Text analysis. Text analysis was performed on the participants’ comments using natural language process-
ing (NLP) techniques, in which each comment was considered as a single document and all comments are
considered as the corpus. The processing steps included: (1) the actual number of comments was determined
by removal of empty documents; (2) texts were tokenized to break up the comments and represent them as a
collection of words; (3) the words were lemmatised, a process of normalisation to reduce words to their root
form, e.g. ”disposal” and ”dispose” become ”dispos”; (4) punctuation was erased; (5) stop words (such as “and”,
“of ”, and “the”) were removed; (6) words with two or fewer characters and words with 15 or more characters
were removed. After processing, a bag-of-words (BoW) was created to present the word frequency in each com-
ment. The importance of a word in the document can be ranked by the word frequency. The concept of BoW
was initially used in a linguistic context31 but has been widely used for text classification32 and computer vision33.
The latent Dirichlet allocation (LDA) model34 was applied to the BoW to discover the topics based on the word
probabilities. The number of topics for all comments was estimated based on comparing the goodness-of-fit of
LDA models. The word clouds were used to visualise the key topics learned from users feedback by LDA.
All data analyses were performed using MATLAB (MathWorks, USA) and Microsoft Excel for Microsoft365
(MSO 32-bit).
Ethical approval. This study was approved by Ulster University Institutional Ethics committee (Ref:
REC/20/0043) in full adherence to the Declaration of Helsinki. All participants provided fully informed consent.
Informed consent for children in this study was obtained from their parents/guardian.
Results
Characteristics of study participants. Initially 2100 individuals were invited to take part, which included
participants from a database of individuals who expressed an interest in taking part in the research alongside
individuals who had previously volunteered and had been shown to have antibodies to SARS-Cov-2 virus. Not
everyone who made a booking participated, some attended but were excluded if a consent form was missing.
The final dataset for this study included 1544 participants and the characteristics are provided in Table 1, which
presents the proportion of participants in gender, age, education and ethnicity.
The histograms of age distribution (for male and female) are presented as in Fig. 3a. It is noticed that female
participants were over-represented in middle-age groups, which was due to the fact that we had more female
volunteers than male (as shown in Table 1 that 60% of 1544 participants are females). The percentages of par-
ticipants in four educational groups are shown in Fig. 3b, which shows fewer participants in Primary/Second-
ary/Other education (shown as ‘Other’) than other groups. However, every effort has been made to achieve as
balanced an overall cohort as possible.
Ease of use. The participants were asked to give scores from 1 to 5 for 28 Likert style questions in seven
sections of the questionnaire (provided in Supplementary Information) and 1539 provided the scores. The
seven sections were devoted to specific aspects of the testing kit. The participants’ scores for each question were
counted and the percentage of the counts are provided in Table 2.
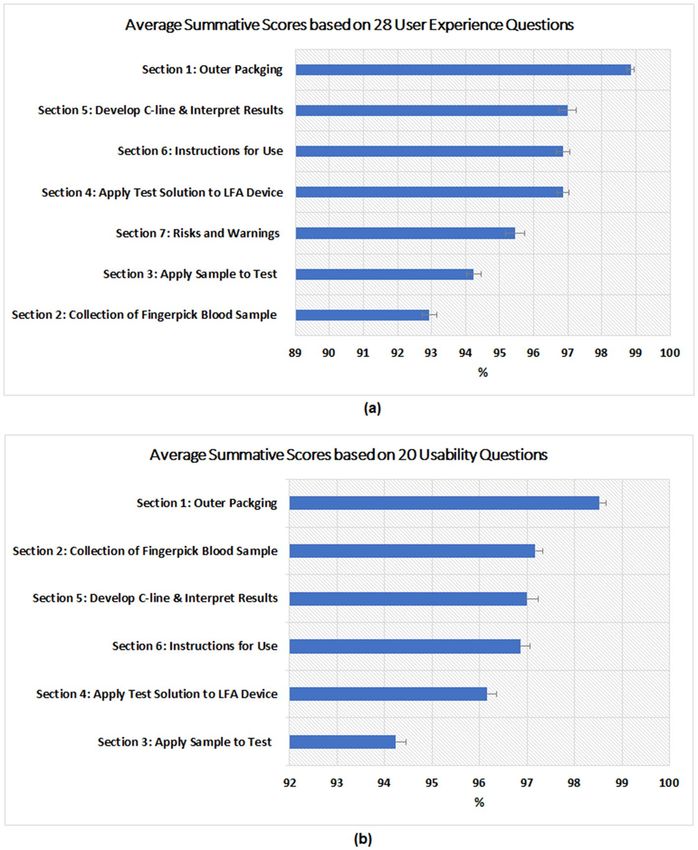
To assess the overall UX scores for each section of the questionnaire, the summative scores (sum of ratings
for all questions normalised as a percentage) for 1539 participants in each section were calculated and the mean
and standard errors are presented in Fig. 4a. The means for each section are higher than 92.5% with an overall
average of 96.03% (SD = 0.05, 95% CI 95.05-97.01%). The results suggest an overall good user experiences by
the public although the testing experience for the collection of the blood sample (Q2) and the application sample
to the test (Q3) will need further improvement in the future.
To assess the usability, we removed the questions Q1a, Q2d, Q2e, Q2f, Q4d, Q7a, Q7b, Q7c and Q7d which
were not related to the usability construct, and then calculated the summative scores for the remaining 20 ques-
tions. The results of usability scores with mean and standard errors are given in Fig. 4b. The means for each
section are higher than 94.2% with an overall average of 96.66% (SD = 0.2, 95% CI 93.03-95.37%). It is noticed
that section Q2 (relates to collection of the blood sample) has the second highest usability score but the lowest
UX score, for the rest, the order of scores (from high to low) remains unchanged. The reason for this was due to
usability analysis excluded Q2d and Q2e. From Table 2, we can see that participants scored relatively low for Q2d
(‘The correct amount of blood was collected from the finger prick puncture’) and Q2e (‘The bleeding stopped
without the need to apply pressure’), which suggest they were the difficult areas in user experience.
Scientific Reports | (2021) 11:14026 | https://doi.org/10.1038/s41598-021-93262-0 4
Vol:.(1234567890)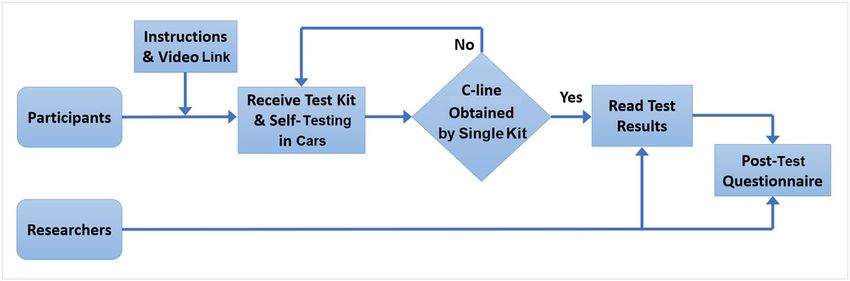
www.nature.com/scientificreports/

                                   Characteristics            Groups                            Proportions n (%)
                                   Number of Participants     All                               1544 (100)
                                                              Male                               613 (39.7)
                                   Gender                     Female                             927 (60.0)
                                                              Other                                4 (0.3)
                                                              8–17 (11.8 ± 3.7)                   20 (1.3)
                                                              18–30 (25.9 ± 3.5)                 191 (12.4)
                                   Age [8-85, 47 ± 14.1]
                                                              31–60 (45.4 ± 8.3)                1046 (67.7)
                                                              60+ (66.9 ± 4.9)                   287 (18.6)
                                                              PhD                                 76 (4.9)
                                                              Master’s                           362 (23.4)
                                                              Honours Degree                     539 (34.9)
                                                              A-Level / NVQ                      307 (19.9)
                                   Education
                                                              Secondary School Education         186 (12.1)
                                                              Some Secondary Education            36 (2.3)
                                                              Primary Education                    7 (0.5)
                                                              Other Education                     31 (2.0)
                                                              White                             1530 (99.1)
                                                              Mixed                                5 (0.32)
                                                              Asian / Chinese / British Asian      4 (0.26)
                                                              White African                        1 (0.064)
                                   Ethnicity
                                                              A-level / NVQ                        1 (0.064)
                                                              Middle East                          1 (0.064)
                                                              Irish Traveler                       1 (0.064)
                                                              Other                                2 (0.128)

                                  Table 1.  Characteristics of study participants. The values for age are presented in the range (mean ± standard
                                  deviation (SD)).

                                  Figure 3.  (a) The histogram of age distribution for female and male participants; (b) percentage of participants
                                  in four education groups.

                                  Use of resource. Question Q2f and Q6f assessed the efficiency in use of resource. Q2f asked whether the
                                  second lancet was required for the test, in which 19.95% (307 of 1539) answered ‘yes’. We cross-examined how
                                  many of those required the second lancet in each age group and the results are summarised in Table 3. It appears
                                  that the highest proportion 32% (46 of 190) comes from the young adult age group 18-30. Moreover, age groups
                                  8-17 and those over 60 years old appeared to have the least need for a second lancet when compared to the other
                                  groups. No statistical significance was found (Chi-square tests p-values provided in Supplementary Table.S6).
                                     Question Q6f asked how many times the participant consulted the instructions during the test. We cross
                                  examined the answers from the participants in the four age groups and the results are given in Table 4. The

Scientific Reports |   (2021) 11:14026 |                    https://doi.org/10.1038/s41598-021-93262-0                                              5

                                                                                                                                             Vol.:(0123456789)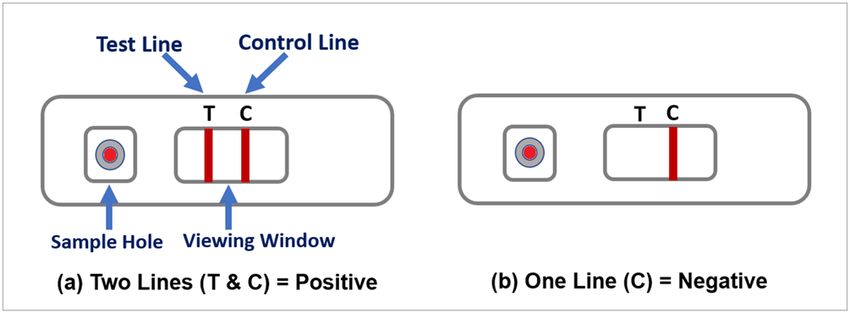
www.nature.com/scientificreports/
Score count (%)
Questions 1 2 3 4 5
Q1a Did the packaging provide sufficient protection to the kit materials? 0.06 0.06 0.13 1.75 97.99
Q1b Were the kit materials easily accessed? 0.13 0.39 1.10 3.70 94.67
Q1c Did the packaging provide clear information to the type of test and materials inside? 0.13 0.45 1.04 3.25 95.13
Q2a The lancet was easily identified. 0.32 0.39 0.97 2.86 95.45
Q2b The lancet cap was easy to remove. 0.32 0.26 1.88 6.43 91.10
Q2c The fingerpick puncture was easy to perform. 1.10 0.97 4.55 6.50 86.87
Q2d The correct amount of blood was collected from the fingerpick puncture. 3.05 4.48 8.32 8.38 75.76
Q2e The bleeding stopped without the need to apply pressure. 10.33 5.13 10.27 6.04 68.23
Q2f The second lancet was required to be used. Yes 19.95 No 80.05
Q3a The test device was easily identified. 0.32 0.39 0.45 2.08 96.75
Q3b The test was easy to remove from the foil packaging. 0.84 0.97 2.86 4.48 90.84
Q3c The correct place to apply the sample (‘sample hole’) was easily identified. 0.26 0.26 1.36 3.38 94.74
Q3d The blood was easily expelled from the blood collector to the test. 8.38 7.47 10.33 8.71 65.11
Q4a The test solution was easily identified. 0.71 0.39 0.71 2.40 95.78
Q4b The twist cap was easy to remove. 1.56 1.36 4.55 7.34 85.19
Q4c The test solution was easily applied to the sample hole on the device. 0.58 1.36 4.55 7.47 86.03
Q4d There was no test solution left in the container. 0.32 0.32 0.52 1.95 96.88
Q5a Clearly understood that the C line is a control line. 3.38 0.78 1.82 1.82 92.20
Q5b Clearly understood that the T line is a test line. 2.99 0.65 1.69 1.69 92.98
Q5c A control line was easily identified within the test window. 0.65 0.20 0.52 1.24 97.40
Q5d Results were easily interpreted based on the information provided in the instructions. 1.43 1.04 1.30 1.82 94.41
Q6a The instructions provided were easy to follow. 0.32 0.45 1.62 4.29 93.31
Q6b The user steps were simple and easy to perform. 0.26 0.39 1.56 5.26 92.53
Q6c The items in the kit were appropriately labelled. 2.79 1.95 4.09 6.43 84.73
Q6d The test is in an easy to use format. 0.06 0.45 1.43 5.72 94.41
Q7a The lancet was understood to contain a needle. 1.36 0.78 2.21 2.47 93.18
Q7b The risks associated with the lancet was clearly understood. 2.60 1.30 2.21 2.34 91.55
Q7c The potential for small components to be a choking hazard was clearly understood. 4.16 1.88 3.12 2.86 87.98
The importance of disposing the kit materials in general waste and not within the recy-
Q7d 2.92 1.43 2.53 2.73 90.38
cling was understood.
Table 2. The questions and participants’ score counts in % (n=1539).
majority 74.2% (1142 of 1539) participants consulted the instructions 1-3 times, 299 of 1539 needed to refer to
the instructions 4-6 times, 64 participants read the instructions 6-9 times and 34 did more than 10 times. Among
the 34 people who consulted the instructions at least 10 times, only 2.9 % (1 of 34) were aged under 18, 23.5%
(8 of 34) were over 60 years old, and age group 31–60 refer to instructions more frequently than other groups
(significance was found in Chi-square tests results given Supplementary Table S7).
Age groups and education levels. The boxplot of average summative scores for the different groups are
presented in Fig. 5: (a) UX scores by education group; (b) usability scores by education groups; (c) UX scores
by age groups and (d) usability scores by age groups, respectively. In the boxplot, the central line indicates the
median, whilst the bottom and top lines represent the 25th and 75th percentiles, respectively, (with outliers plot-
ted as an asterisk).
To assess whether the scores have a normal distribution, one-sample Kolmogorov-Smirnov tests were per-
formed for each group and all results show a p < 0.001, which suggest that the scores do not have a standard
normal distribution. (The histogram for UX scores and usability scores for education and age groups are provided
from Supplementary Figure S.1 to Figure S.4. Therefore the paired Wilcoxon rank sum tests were applied to access
the medium differences between the groups. Bonferroni corrections were used for multiple hypothesis testing,
hence the significance level α was as 0.05/6 = 0.0083.
The p-values of differences in results for education groups are given in Tables 5 and 6, and those for the age
groups are presented in Tables 7 and 8. No significant differences were found between age groups and education
groups. The results based on the data collected for this study show that the UX scores and usability scores are
independent of users’ age and educational attainment. However, this is based on the dataset that lacks represen-
tation from some groups, such as age 8-17 and those with primary or secondary education, the current finding
could be improved by recruiting more participants in these groups in a future study.
Free text analysis: factors to consider for enhancing usability. The topics in free text learned by the
LDA model34 are presented by word clouds in Supplementary Figure S.5, which suggest the key topics including
Scientific Reports | (2021) 11:14026 | https://doi.org/10.1038/s41598-021-93262-0 6
Vol:.(1234567890)www.nature.com/scientificreports/
Figure 4. Average summative scores for 1539 responses based on: (a) all 28 UX questions; (b) 20 questions
related to usability construct only. The error bars represent the standard errors.
Second lancet needed Age: 8–17 Age: 18–30 Age: 31–60 Age: 60+ Total
Yes 3 46 206 52 307
No 17 144 837 234 1232
Ratio (Yes/No) 0.18 0.32 0.25 0.22 0.25
Table 3. Number of participants in four age groups that required the second lancet to complete the test.
Times consulted instruction Age: 8–17 Age: 18–30 Age: 31–60 Age: 60+ Total
1–3 15 137 769 221 1142
4–6 4 44 200 51 299
7–9 0 8 50 6 64
10+ 1 1 24 8 34
Table 4. Number of times the participants consulted the instructions in four age groups.
Scientific Reports | (2021) 11:14026 | https://doi.org/10.1038/s41598-021-93262-0 7
Vol.:(0123456789)www.nature.com/scientificreports/
Figure 5. Boxplot for average of: (a) UX scores by education groups; (b) Usability scores by education groups;
(c) UX scores by age groups and (d) Usability scores by age groups.
Education groups Master/PhD Honours A-levels Other
Master/PhD 1 – – –
Honours 0.6288 1 – –
A-Levels 0.1030 0.2547 1 –
Other 0.0701 0.2315 0.7369 1
Table 5. P values based on paired Wilcoxon tests for UX scores in four education groups.
Education groups Master/PhD Honours A-levels Other
Master/PhD 1 – – –
Honours 0.5427 1 – –
A-levels 0.1895 0.4734 1 –
Other 0.1197 0.4651 0.7557 1
Table 6. P-values based on paired Wilcoxon tests for usability scores in four education groups.
Scientific Reports | (2021) 11:14026 | https://doi.org/10.1038/s41598-021-93262-0 8
Vol:.(1234567890)www.nature.com/scientificreports/
Age groups 8–17 18–30 31–60 60+
8–17 1 – – –
18–30 0.1061 1 – –
31–60 0.5384 0.0868 1 –
60+ 0.5602 0.0338 0.4173 1
Table 7. P-values based on paired Wilcoxon tests for UX scores from four age groups.
Age groups 8–17 18–30 31–60 60+
8–17 1 – – –
18–30 0.0598 1 – –
31–60 0.2848 0.0601 1 –
60+ 0.5070 0.0114 0.1332 1
Table 8. P-values based on paired Wilcoxon tests for usability scores from four age groups.
Figure 6. Examples of two test kits placed in the polyester bag (to prevent cross-contamination): (a)
participant’s result read as negative (P-) and researcher’s was positive (R+); (b) both participant and researcher’s
results were positive (P+ and R+); (c) a visual score card for T-lines.
‘blood’, ‘video’, ‘lancet’, ‘line’, ‘bubble’, ‘instruction’, ’test’ and ’sample’. The examples of user comments in each of
five comment sections are provided in Supplementary Tables S1 to S5, which include: (1) key words based on
word frequency; (2) the popularity of the key word, in which the proportion shows the percentage of the com-
ments mentioned this word related to total users; and (3) representative samples of user comments related to
the key word.
The analysis of user comments on applying sample to test (Q3; Supplementary Table S1) suggest a total of
26.58% (421 of 1544) subjects provided a free text response, in which 44.90% (189 of 421) were related to the
‘blood’, and specifically 25% of 421 related to the blood collector. The analysis of the text responses based on the
application of test solution to the lateral flow device (Q4) are summarised in Supplementary Table S2. A total of
16.90% (261 of 1544) subjects provided a response, and 29.50% of 261 related to (blood) bubbling leaving the
transfer device which made transfer difficult, and 23.75% of 261 were related to the issues with the test solution.
The analysis of the user comments related to the control line and the interpretation of the test result (Q5: Sup-
plementary Table S3) show that a total of 15.22% (235 of 1544) commented on this aspect and 22.55% of 235
were related to the lines in the test. The responses related to instructions (Q6: Supplementary Table S4) suggest
that a total of 22.60% (349 of 1544) provided a response to this question, in which 109 of 349 pointed out the
importance of the video to demonstrate the test. Finally, the analysis of free text related to the potential misuse
of the testing kit (Q8: Supplementary Table S5). A total of 31.99% (494 of 1544) subjects provided comments,
where 84.82% of 494 reported no issues found, 9.31% of 494 were related to the potential misuse of the spare
lancet and 2.02% of 494 were related to the supervision of children when self-administering the test .
Agreement between participant‑interpreted and researcher‑interpreted results. Two exam-
ples of the test kit is given in Fig. 6, in which the test kit was placed in a polyester bag to prevent cross-contami-
nation. Fig. 6a shows an example that the result from participant was negative (indicated as ‘P-’ on the bag) and
researcher read it as positive (‘R+’). It can be seen that the T-line was difficult to read even when the picture was
taken under good light condition. Fig. 6b shows an example with both participant and researcher’s results were
positive (P+ and R+). Fig. 6c presents a visual score card for T-lines according to the level of antibodies present
in the blood. It can be seen that a T-line that is attributed a score of 1/10 is a relatively faint line.
Scientific Reports | (2021) 11:14026 | https://doi.org/10.1038/s41598-021-93262-0 9
Vol.:(0123456789)www.nature.com/scientificreports/
Researcher results n(%)
Positive Negative Invalid Total
Participant results
Positive 109 (7.1) 2 (0.1) 0 (0.0) 1431 (92.7)
Negative 62 (4.0) 1369 (88.7) 0 (0.0) 111 (7.2)
Invalid 0 (0.0) 0 (0.0) 1 (0.1) 1 (0.1)
Total 171 (11.0) 1371 (88.9) 1 (0.1) 1543 (100)
Table 9. Results based on self-test in cars interpreted by the participants and the researchers. The values in the
brackets show the percentage of the results related to total number of results (n=1543).
It was difficult to read the test results due to the difficult weather conditions and the need to put samples
within a translucent plastic bag, especially for those faint T-lines due to low signal intensity. Interpretation of
any queried results, e.g. a very weak T-line, was undertaken by three highly experienced LFIA users. These
consisted in the most part of faint test lines (scored 1/10 in visual score card in Fig. 6c) that are difficult to read
and perhaps reflective of the level of antibodies present in the blood of subjects who may have been infected
in March 2020 during the first wave of COVID-19 within Northern Ireland whilst this study was conducted in
September 2020 almost 6 months later.
The participants’ self-testing results were compared to those obtained from the researchers. The results of
agreement are presented in Table 9. Among 1544 participants, one test failed and one result from the researcher
was lost. A total of 1478 of 1542 participants interpreted the result in the same way as the corresponding research-
ers. The observed agreement rate is 95.85% [95% CI 94.85 – 96.85%] with the Kappa score of 0.75 [95% CI
0.69–0.81], which suggests substantial agreement in the results interpreted by participants and researchers.
Discussion
This paper presented the findings of UX analysis for a LFIA self-testing kit to identify COVID-19 antibodies
used by 1544 participants from Northern Ireland. The UX analysis assessed the scores obtained from different
age and education groups, the agreement between the results interpreted by participants and researchers, and
identified the potential issues of the testing kit. The results suggest a substantial agreement (Kappa score 0.75)
between members of the public and the researchers in the interpretation of the antibody testing kit results. The
agreement rate is consistent with another recent study8 based on LFIA self-testing at home.
The difficulties in interpreting results appear to be one of the common issues reported in the usability stud-
ies for LFIA testing4,5,7,8. In this study, there were 62 of 1543 (4.02%) participants who interpreted the results
as negative but the researcher queried the results as positive. The misinterpretation of the tests could be due to
many reasons including environmental issues (test results being viewed through a weather protecting polyester
bag under poor light), or ambiguous T-lines with low signal intensity which may occur with very low levels of
antibodies being present in the test result. The comments received by participants also suggest that the T-line
with low intensity may confuse the users to determine whether the result corresponded to a positive result.
In a related s tudy8 for the home based COVID-19 antibody self-testing, the clinician interpretations of the
results were based on inspecting a photograph of the test received from the participants as opposed to having
the physical test available. This was different to our study where the researchers interpreted the result based
on having the physical test available, which is arguably higher fidelity given that photographs are resolution
dependent, and that the lighting environments and exposure may affect the photo capture of faint lines in the
test result. For example, we noted that faint lines (typically scored a 1/10 using an approved score card from the
manufacturer) were visible to the naked eye but not visible on a photograph. Nevertheless, our study achieved
a similar agreement rate to the rate reported in the related s tudy8.
This study provided scope for future work to improve self-administered tests. One area for improvement
highlighted by this user experience study would be to avoid members of the public misinterpreting some posi-
tive results as a negative result. Improvements in the LFIA conjugation protocols or media type can enhance
the brightness of the lines at low antibody levels but this can be at the expense of false positives. Improving the
instructions can help, which can include more information regarding the variation of line intensities to help
the users make the correct decision or including simple improvements to the visual format of the instructions.
Alternatively, some studies have proposed the use of a machine learning based approach to automatically read
the result for LFIA testing via smartphone technology35,36. The smartphone ‘app’ can assist users and indeed help
reduce the uncertainty in their interpretation by comparing pixel intensities after detecting the T-line as the
region of interest, although the performance of the algorithm might be affected by poor lighting. More advanced
systems could incorporate deep learning approaches37–39 and the complementary metal-oxide semiconductor
(CMOS) reader to reading the r esults39.
One noticeable limitation of this study was that we did not use the industry standard usability measures, such
as two widely used and psychometrically validated measures of usability, System Usability Scale (SUS)40 and the
Usability, Satisfaction, Effectiveness scale (USE)41. This was due to the fact that we found some of SUS or USE
questions inappropriate for this study. For example, one SUS question states: “I think that I would like to use
this system frequently”, which is not applicable to the LFA testing for Covid antibody. Some USE questions for
Scientific Reports | (2021) 11:14026 | https://doi.org/10.1038/s41598-021-93262-0 10
Vol:.(1234567890)www.nature.com/scientificreports/
‘Usefulness’ are not suitable for this study, such as ‘It helps me be more effective’, ‘It helps me be more produc-
tive’, ‘It gives me more control over the activities in my life’, and ‘It makes the things I want to accomplish easier
to get done’.
We notice that there is a lack of well-defined measurement metrics for UX and usability related to LFIA
self-testing. Most related s tudies2,4,7,8 focused on assessment of accuracy in interpreting test results and tried to
identify the issues based on the feedback received from the questionnaire. Therefore, we applied self-defined
measurements for UX and usability because the purpose of this study was not only to assess the ease of use the
testing kit (usability), but also to identify the difficult areas or warnings from the user experiences. We believe
that the outcomes from the UX analysis provided the valuable information for the future studies. Furthermore,
there are other scales that are arguably related to UX that could be used, for example the NASA TLX scale42 can
be used to assess the mental workload, which will be considered in the future study.
In addition, although we were able to randomly select individuals from each age/gender group to best rep-
resent the NI population, due to the restraints of responses to recruitment, some groups were over-represented
(females) while other groups were under-represented (males). In terms of age distribution, as shown in Figure S.6,
13.18% of NI population (1.8 millions) are age 8-17 and 18.73% are age over 60 (according to NI 2011 C ensus43).
For this study, we have 18.6% (of 1544) from group of age over 60 which is similar to the figure from NI popula-
tion, however, we only have 1.3% participants in group 8-17 due to the difficulties in recruitment. Also more
volunteers with primary or secondary education will need to be included in order to strengthen the finding that
the test kit is user-friendly, independent of age and education.
One of other limitations includes the fact that the test was carried out in a university car park within a car.
Cars are not the ideal environment to self-administer tests, especially if the lighting is poor, however this was
difficult to control during the pandemic due to safety concerns and logistics of conducting such research during
strict lockdown controls. Another limitation is that the survey was comprised of a large set of questions where
subjects could have questionnaire fatigue, which can affect the veracity of some of the answers that are provided
towards the end of the survey. Moreover, the survey consisted of Likert rating style questions where each question
had a positive connotation. Hence, the highest rating of 5 is always denoted as a positive score, and the questions
could suffer from this type of bias towards positive ratings.
Nevertheless, members of the public provided very high ratings regarding the usability of the kit and the
ratings are independent of user age and education attainment. This suggests that the kit can be used as a user-
friendly device for widespread use in the population. The user comments also suggest that the utility of the video
was helpful for displaying the instructions and for providing an intuitive way to demonstrate how to use the kit,
also the importance of providing the tray for using this kit in a car environment. Future work is also needed to
improve the collection of the blood sample and the application sample to the test. Testing the UX of the kit may
be conducted from an accessibility point of view, such as amongst people with hearing or visual impairments or
indeed with intellectual disabilities.
Conclusion
We conducted a user experience study of a self-administered SARS-CoV-2 antibody test in cars based on a total
of 1544 members of the public in Northern Ireland. The statistical analysis found substantial agreement between
the results interpreted by participants and researchers. The participants also perceived the kit to be user-friendly
by providing high ratings in the post-test questionnaire. The user feedback identified that some areas need
improvement, such as collecting blood samples and applying the sample to the test which are two areas that the
participants found more difficult, as well as faint test lines which may cause misinterpretations of the result. In
conclusion, the results from the user experience analysis are encouraging, and the findings will help to improve
the design of SARS-CoV-2 antibody testing kits and inform protocols for future UX studies.
Received: 19 February 2021; Accepted: 7 June 2021
References
1. Sheridan, C. Coronavirus testing finally gathers speed. Nature Biotechnology News (2020-11-05).
2. Boxer, J., Weddell, S., Broomhead, D., Hogg, C. & Johnson, S. Home pregnancy tests in the hands of the intended user. J. Immunoass.
Immunochemistry 40, 642–652 (2019).
3. Valanis, B. G. & Perlman, C. S. Home pregnancy testing kits: prevalence of use, false-negative rates, and compliance with instruc-
tions. Am. J. Public Health 72, 1034–1036 (1982).
4. Peck, R. B. et al. What should the ideal HIV self-test look like? a usability study of test prototypes in unsupervised HIV self-testing
in kenya, malawi, and south africa. AIDS Behav. 18, 422–432 (2014).
5. Ndlovu, Z. et al. Diagnostic performance and usability of the visitect cd4 semi-quantitative test for advanced HIV disease screen-
ing. PLoS ONE 15, e0230453 (2020).
6. Rodriguez, N. M. et al. based rna extraction, in situ isothermal amplification, and lateral flow detection for low-cost, rapid diagnosis
of influenza a (H1N1) from clinical specimens. Anal. Chem. 87, 7872–7879 (2015).
7. Flower, B. et al. Clinical and laboratory evaluation of SARS-CoV-2 lateral flow assays for use in a national COVID-19 seroprevalence
survey. Thorax (2020).
8. Atchison, C. et al. Usability and acceptability of home-based self-testing for Severe Acute Respiratory Syndrome (SARS-CoV-2)
antibodies for population surveillance. Clin. Infect. Dis. 72, e384–e393 (2020).
9. Deeks, J. J. et al. Antibody tests for identification of current and past infection with SARS-CoV-2. Cochrane Database Syst. Rev. 6,
1-306 (2020).
10. Pollán, M. et al. Prevalence of SARS-CoV-2 in spain (ene-covid): a nationwide, population-based seroepidemiological study. The
Lancet 396, 535–544 (2020).
Scientific Reports | (2021) 11:14026 | https://doi.org/10.1038/s41598-021-93262-0 11
Vol.:(0123456789)www.nature.com/scientificreports/
11. Iyer, A. S. et al. Persistence and decay of human antibody responses to the receptor binding domain of SARS-CoV-2 spike protein
in COVID-19 patients. Sci. Immunol. 5, eabe0367, 1-13 (2020).
12. Isho, B. et al. Persistence of serum and saliva antibody responses to SARS-CoV-2 spike antigens in COVID-19 patients. Sci.
Immunol. 5, (2020).
13. Torjesen I. Covid-19: Home testing programme across England aims to help define way out of lockdown. BMJ. 369: m1799, (2020).
14. Abingdon Health. UK COVID-19 rapid antibody tests approved for professional use. Company News (2020-07-30).
15. Sonderegger, A., Schmutz, S. & Sauer, J. The influence of age in usability testing. Appl. Ergon. 52, 291–300 (2016).
16. Abingdon Health instruction video. Youtube https://youtu.be/WqT2z8jCEHs (2020).
17. Bevan, N. Iso 9241: Ergonomic requirements for office work with visual display terminals (vdts)-part 11: Guidance on usability.
Tc 159, 61 (1998).
18. Bevan, N. What is the difference between the purpose of usability and user experience evaluation methods. In Proceedings of the
Workshop UXEM, vol. 9, 1–4 (Citeseer, 2009).
19. Alben, L. Quality of experience: defining the criteria for effective interaction design. Interactions 3, 11–15 (1996).
20. Hassenzahl, M. & Wessler, R. Capturing design space from a user perspective: the repertory grid technique revisited. Int. J. Hum–
Comput. Interact. 12, 441–459 (2000).
21. Hassenzahl, M. & Tractinsky, N. User experience-a research agenda. Behav. Inf. Technol. 25, 91–97 (2006).
22. Weisstein, E. W. Bonferroni correction. MathWorld-A Wolfram Web Resource. https://mathworld.wolfram.com/ (2004)
23. Cohen, J. A coefficient of agreement for nominal scales. Educ. Psychol. Meas. 20, 37–46 (1960).
24. Fleiss, J. L., Levin, B. & Paik, M. C. Statistical Methods for Rates and Proportions (Wiley, 2013).
25. Viera, A. J. et al. Understanding interobserver agreement: the kappa statistic. Fam. Med. 37, 360–363 (2005).
26. Lee, V. J. et al. User acceptability and feasibility of self-testing with HIV rapid tests. JAIDS J. Acquir. mmune Defic. Syndromes 45,
449–453 (2007).
27. Figueroa, C. et al. Reliability of HIV rapid diagnostic tests for self-testing compared with testing by health-care workers: a systematic
review and meta-analysis. The lancet HIV 5, e277–e290 (2018).
28. Kurth, A. E. et al. Accuracy and acceptability of oral fluid HIV self-testing in a general adult population in Kenya. AIDS Behav.
20, 870–879 (2016).
29. Cardillo, G. Cohen’s Kappa: compute the Cohen’s kappa ratio on a square matrix. GitHub https://github.com/dnafinder/Cohen
(2007).
30. McHugh, M. L. Interrater reliability: the kappa statistic. Biochem. Med. Biochem. Med. 22, 276–282 (2012).
31. Harris, Z. S. Distributional structure. Word 10, 146–162 (1954).
32. Sriram, B., Fuhry, D., Demir, E., Ferhatosmanoglu, H. & Demirbas, M. Short text classification in twitter to improve information
filtering. In Proceedings of the 33rd International ACM SIGIR Conference on Research and Development in Information Retrieval,
841–842 (2010).
33. Sivic, J. & Zisserman, A. Efficient visual search of videos cast as text retrieval. IEEE Trans. Pattern Anal. Mach. Intell. 31, 591–606
(2008).
34. Blei, D. M., Ng, A. Y. & Jordan, M. I. Latent dirichlet allocation. J. Mach. Learn. Res. 3, 993–1022 (2003).
35. Eltzov, E. et al. Lateral flow immunoassays-from paper strip to smartphone technology. Electroanalysis 27, 2116–2130 (2015).
36. Quesada-González, D. & Merkoçi, A. Mobile phone-based biosensing: an emerging “diagnostic and communication’’ technology.
Biosens. Bioelectron. 92, 549–562 (2017).
37. Zeng, N., Wang, Z., Zhang, H., Liu, W. & Alsaadi, F. E. Deep belief networks for quantitative analysis of a gold immunochroma-
tographic strip. Cognit. Comput. 8, 684–692 (2016).
38. Carrio, A., Sampedro, C., Sanchez-Lopez, J. L., Pimienta, M. & Campoy, P. Automated low-cost smartphone-based lateral flow
saliva test reader for drugs-of-abuse detection. Sensors 15, 29569–29593 (2015).
39. Jing, M. et al. Enhance categorisation of multilevel high-sensitivity cardiovascular biomarkers from lateral flow immunoassay
images via neural networks and dynamic time warping. In 2020 IEEE International Conference on Image Processing (ICIP), 365–369
(IEEE, 2020).
40. Brooke, J. SUS: a “quick and dirty’usability. In Jordan, P. W., Thomas, B., McClelland, I. L. & Weerdmeester, B. (eds.) Usability
evaluation in industry, 189–194 (CRC press, 1996).
41. Lund, A. M. Measuring usability with the use questionnaire12. Usability Interface 8, 3–6 (2001).
42. Hart, S. G. & Staveland, L. E. Development of NASA-TLX (Task Load Index): results of empirical and theoretical research. In
Advances in Psychology, vol. 52, 139–183 (Elsevier, 1988).
43. NISRA. 2011 Census Population Tables. Northern Ireland Statistics and Research Agency (NISRA) https://www.nisra.gov.uk/publi
cations/2011-census-population-tables (2014).
Acknowledgements
We are extremely grateful to all the people of Northern Ireland who took part in this study during the pandemic.
We acknowledge Dr. Tony Byrne for use of the Safe Water laboratory and Professor Gareth Davison for labora-
tory space and equipment during the pandemic within a locked down University. We also acknowledge the
European Union’s INTERREG VA Programme (Grant ID:IVA5034, managed by the Special EU Programmes
Body (SEUPB)) funding associated with Eastern Corridor for Medical Engineering (ECME) in relation to data
analysis and UK-RTC provided the test kits and funding of expenses. Finally, we appreciate all the comments
from the reviewers which enabled us to improve the presentation and scientific contribution of this work.
Author contributions
T.M. and J.ML. designed, coordinated and supervised the project, participated in interpretation of results and
provided the critical comments for the manuscript; R.B. designed the research questions, supervised the data
analysis and participated in interpretation of results and drafting the manuscript; M.J. conducted the data analysis
including technical implementation and interpretation of results, drafted the manuscript with inputs from all
authors; A.N., R.P. participated in participants recruiting, collected the original post-study data; T.M., A.N., L.R.,
J.M., A.K. and R.P. obtained ethical approval, coordinated car park data collection and ensured adherence to all
research governance issues; W.B. designed and controlled the data base and digitalised all original post-study
data for analysis; All authors reviewed and provided comments for the manuscript, read and approved the final
version of the manuscript.
Scientific Reports | (2021) 11:14026 | https://doi.org/10.1038/s41598-021-93262-0 12
Vol:.(1234567890)www.nature.com/scientificreports/
Competing interest
At the time of this study T.M. and J.ML. acted as non-paid advisors to CIGA HealthCare, an industrial partner in
the UK Rapid Test Consortium. No personal financial reward or remuneration was received for this advisory role.
At the time of submission of this manuscript T.M. and J.ML. no longer held these advisory positions. All other
authors have no potential conflict of interest to report. The authors declare that they have no known competing
financial interests or personal relationships that could have appeared to influence the work reported in this paper.
Additional information
Supplementary Information The online version contains supplementary material available at https://doi.org/
10.1038/s41598-021-93262-0.
Correspondence and requests for materials should be addressed to J.M. or T.M.
Reprints and permissions information is available at www.nature.com/reprints.
Publisher’s note Springer Nature remains neutral with regard to jurisdictional claims in published maps and
institutional affiliations.
Open Access This article is licensed under a Creative Commons Attribution 4.0 International
License, which permits use, sharing, adaptation, distribution and reproduction in any medium or
format, as long as you give appropriate credit to the original author(s) and the source, provide a link to the
Creative Commons licence, and indicate if changes were made. The images or other third party material in this
article are included in the article’s Creative Commons licence, unless indicated otherwise in a credit line to the
material. If material is not included in the article’s Creative Commons licence and your intended use is not
permitted by statutory regulation or exceeds the permitted use, you will need to obtain permission directly from
the copyright holder. To view a copy of this licence, visit http://creativecommons.org/licenses/by/4.0/.
© The Author(s) 2021
Scientific Reports | (2021) 11:14026 | https://doi.org/10.1038/s41598-021-93262-0 13
Vol.:(0123456789)You can also read