Bank of Finland Research Discussion Papers 8 2019 Stagnant wages, sectoral misallocation and slowing productivity growth - Bank of Finland ...
←
→
Page content transcription
If your browser does not render page correctly, please read the page content below
Bank of Finland Research Discussion Papers
8 • 2019

Michaela Schmöller

Stagnant wages, sectoral misallocation and
slowing productivity growth

               Bank of Finland
               Research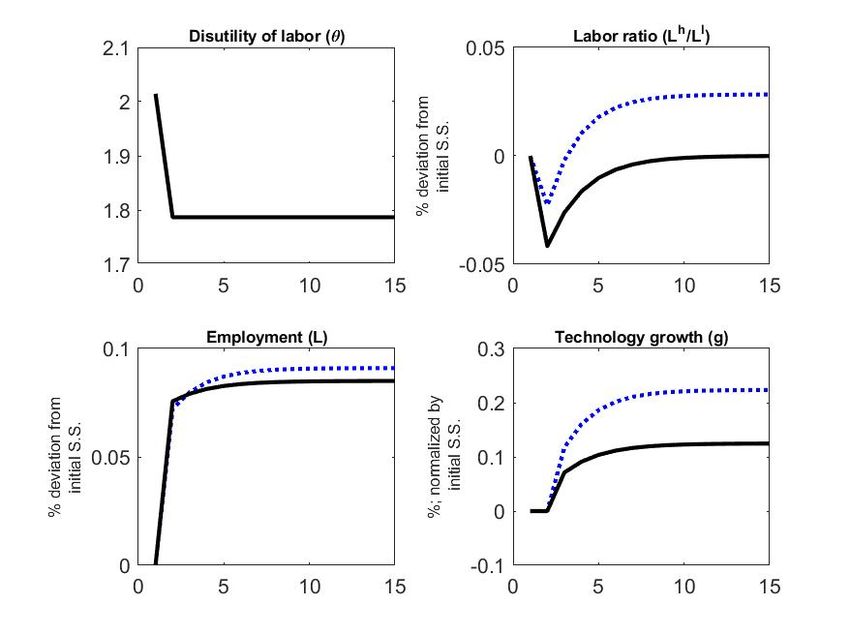
Bank of Finland Research Discussion Papers
Editor-in-Chief Esa Jokivuolle

Bank of Finland Research Discussion Paper 8/2019
6 May 2019

Michaela Schmöller
Stagnant wages, sectoral misallocation and slowing productivity growth

ISBN 978-952-323-273-0, online
ISSN 1456-6184, online

Bank of Finland
Research Unit

PO Box 160
FIN-00101 Helsinki

Phone: +358 9 1831

Email: research@bof.fi
Website: www.suomenpankki.fi/en/research/research-unit/

The opinions expressed in this paper are those of the authors and do not necessarily reflect the views
of the Bank of Finland.

Stagnant Wages, Sectoral Misallocation and
Slowing Productivity Growth
Michaela Schmöller
Bank of Finland
April 2019
Abstract
I propose a two-sector endogenous growth model with heterogeneous sectoral
productivity and sector-speci
c, nonlinear hiring costs to analyse the link between
sectoral resource allocation, low productivity growth and stagnant real wages. My
results suggest that an upward shift in the labor supply, triggered for instance by
a labor market reform, as among others implemented in Germany in 2003-2005,
is bene
cial in the long-run as it raises growth of technology, labor productivity
and real wages. I show, however, that in the immediate phase following the labor
supply shock, labor productivity and real wages stagnate as employment gains are
initially disproportionally allocated to low-productivity sectors, limiting the capacity
for technology growth and depressing real wages and productivity. I demonstrate
that due to the learning-by-doing growth externality in the high-productivity sector
the competitive equilibrium is ine
cient as
rms fail to internalize the eect of
their labor allocation on aggregate growth. Subsidies to high-productivity sector
production can alleviate welfare losses along the transition path.
JEL codes: E20, E24, E60, O40, O41
Keywords: Subdued Wage Growth, Productivity Slowdown, Misallocation, En-
dogenous Productivity Dynamics, Labor Market Policies
Monetary Policy and Research Department; michaela.schmoller[at]bof.fi
I am grateful to Pertti Haaparanta, Juha Kilponen and Antti Ripatti for highly valuable advice and
support. I would also like to thank Hanna Freystätter, Esa Jokivuolle, Mikael Juselius, Tomi Kortela,
Mikko Sariola, Martin Spitzer, Juuso Vanhala and seminar participants at various institutions for helpful
comments and feedback.
Disclaimer: The views expressed are those of the author and do not necessarily re
ect those of the Bank
of Finland.
11 Introduction
In recent years, many advanced economies have experienced a sustained slowdown in pro-
ductivity growth, which has generally set in already in the early 2000s and has gained par-
ticular attention in the years following the Great Recession. Additionally, the persistently
sluggish wage development in many advanced economies has represented a phenomenon
central to the policy discussion and has widely prevailed even in the context of falling
unemployment. Simultaneously, several of these economies experienced a sustained up-
ward shift in employment, triggered by means of two major channels. On the one side,
labor market policies aimed at raising aggregate employment were an important driving
force. The large-scale labor market reforms implemented in Germany from 2003 to 2005,
the so-called "Hartz" reforms, constitute a prominent example in this context. In other
countries, in turn, migration can be considered the main driver of the employment shift.
In this context, the experience of the United Kingdom, characterized by a pronounced
productivity slowdown, stagnant real wage growth, rising employment and simultaneous
signi
cant net migration, is particularly notable.1
This paper draws on the experience of a simultaneous stagnant wage development and
slowing productivity growth in the presence of pronounced employment expansions and
proposes an at this stage unexploited, misallocation-based mechanism which rationalizes
these observations in a tractable macroeconomic framework. Most studies on the eect
of the German labor market reforms focus on the direct labor market impact (see Fahr
and Sunde (2009) and Klinger and Rothe (2012) for reference). Theoretical studies on
the macroeconomic level are scarce and study the eect on unemployment and welfare
in a search-and-matching context (Krause and Uhlig (2012); Krebs and Scheel(2013))
or analyze the build-up of current account imbalances in this context (see for instance
Kollmann et al. (2015); Hochmuth, Moyen and Stähler (2018)). The eect of large-scale
employment shifts on the evolution of technology growth and aggregate productivity, by
contrast, has at this stage been overlooked by the existing literature. Against this back-
ground, this paper takes a novel perspective on the issue and addresses the impact of
an employment expansion from a macroeconomic, endogenous growth perspective and
analyses the eect on technology growth and hence the economy's long-run growth rate.
Moreover, to my knowledge, this is the
rst analysis, which studies the eect of these
employment shifts on the allocation of production factors and explores the role of misallo-
1 While the case of Germany represents a clear-cut example of a large-scale labor market reform
and stands thus in the focus of this analysis, several further countries have implemented similar labor
market reforms focused on raising the labor supply, with Sweden and Denmark as noteworthy examples.
Moreover, further euro area economies implemented labor market reforms following the Great Recession
and euro area debt crisis.
2cation in this setting. Taking this approach also permits to disentangle dynamics over the
short- to medium-term from long-run eects, as well as to theoretically demonstrate the
interaction between the employment shift, real wage growth and the evolution of produc-
tivity over various horizons. This paper further provides a welfare analysis and derives
optimal policies to accompany the employment shift in order to alleviate welfare losses
alongside the transition path.
As to the theoretical model speci
cation, the framework entails a tractable mechanism,
which demonstrates that both the phenomenon of stagnant wage and productivity growth
can be the result of a misallocation of production factors to low-productivity sectors fol-
lowing a positive shock to employment. For that purpose, I construct a two-sector en-
dogenous growth model with heterogeneous productivity across sectors, where technology
advances are concentrated in the high-productivity sector, which constitutes the growth
engine in the economy. More speci
cally, the model is subject to an endogenous total
factor productivity mechanism of the learning-by-doing type in which technology growth
is increasing in the labor allocated to the high-growth sector. Labor is generally homo-
geneous and mobile. However, nonlinear labor adjustment costs in the high-productivity
sector represent a constraint to the instantaneous
ow of labor to the high-productivity
sector. These adjustment costs only occur in the case of hiring, re
ecting the costs from
initial training, learning of complex production processes and the adjustment of human
capital to the production requirements in this sector.
I demonstrate that exogenous upward shifts in employment generally exert a positive eect
on aggregate economic performance over the long-run since they increase the rates of both
technology and productivity growth and also foster real wage growth. My analysis further
shows, however, that over the short- to medium-term labor productivity and real wages
stagnate. The underlying cause is that employment gains are at
rst disproportionately
realized in the low-productivity sector, causing a transitory misallocation of productive
resources, which temporarily depresses labor productivity and real wage growth. Over
time, however, the high-productivity sector realizes employment gains and the initial
extent of misallocation is reversed. I demonstrate that due to the presence of a growth
externality resulting from the learning-by-doing process in the high-productivity sector,
the competitive allocation is ine
cient. The cause of the ine
ciency is that
rms in the
high-productivity sector do not internalize the impact of their own hiring choices on the
aggregate growth performance. These ine
ciencies in the decentralized economy give a
role for policy intervention: Subsidizing production in the high-productivity sector is an
eective policy tool to reduce the initial extent of misallocation following the employment
3shock and thus an adequate policy measure to reduce welfare losses occurring along the
transition to the new equilibrium. This
nding emphasizes the importance of not only
the quantity but also the quality of employment in evaluating the recent slowdown in
productivity and real wage growth.
This paper relates to the literature on natural resource misallocation, commonly referred
to as "the Dutch disease" (Corden and Neary (1982)). These studies focus on the adverse
eect, which the discovery of natural resources can exert on economic performance and
welfare.2 A subset of these papers, such as Krugman (1987) and Matsuyama, (1992) model
growth in the form of learning-by-doing, as does this paper. In my framework, however, it
is the abundance of the production factor labor which triggers the misallocation towards
stagnant sectors. That given, this paper is also tightly connected to the cost disease in
the service sector, the so-called "Baumol disease", as the latter also addresses the role of
relative labor allocation across sectors, which are heterogeneous in productivity, on the
performance of the aggregate economy (see Baumol and Bowen (1966) and Baumol (1967)
for reference). The model I present features an episode in which the Baumol disease mech-
anism of the misallocation of labor to stagnant sectors is active. However, the channel
inducing the stagnation of labor productivity and wage growth in my framework diers
from typical Baumol disease models as a sudden expansion in employment constitutes the
trigger in my framework. Lastly, a closely related research area studies misallocation in
the context of the recent productivity slowdown. The misallocation in several euro area
countries upon monetary union and interest rate convergence and the resulting misallo-
cation of capital
ows to low-productivity sectors constitutes a major
eld addressed by
recent research (see Benigno and Fornaro (2014), Benigno, Converse and Fornaro (2015)
and Gopinath et al. (2017)). In contrast to these studies, this paper does not focus on
the role of low interest rates and large capital in
ows as a trigger of sectoral misallocation
but instead proposes a new channel for a misallocation-induced productivity slowdown.
More speci
cally, the central mechanism in my framework originates from the presence of
the endogeneity of the labor supply decision and misallocation in my frameworks results
from an abundance of the production factor labor.
The outline of this paper can be summarized as follows. Section 2 discusses stylized
facts on the issue of stagnant productivity and wage growth following employment shifts.
Section 3 demonstrates the model framework and hence the basis of this analysis. Sub-
sequently, I present the results for the evolution of real wages as well as technology and
labor productivity growth over both the short- to medium-term and in the long-run (sec-
tion 4). Section 5 points out the ine
ciencies in the competitive allocation by deriving
2 See Frankel (2011) and Van der Ploeg (2011) for a review of this strand of the literature.
4the dierences vis-à-vis the social planner equilibrium. Based on these
ndings, section
6 presents the corresponding implications and options for policy making in this context.
Lastly, section 7 concludes.
2 Stylized facts
This section presents stylized facts on productivity growth, the evolution of real wages and
employment shifts, with a special focus on the experience of Germany following its large-
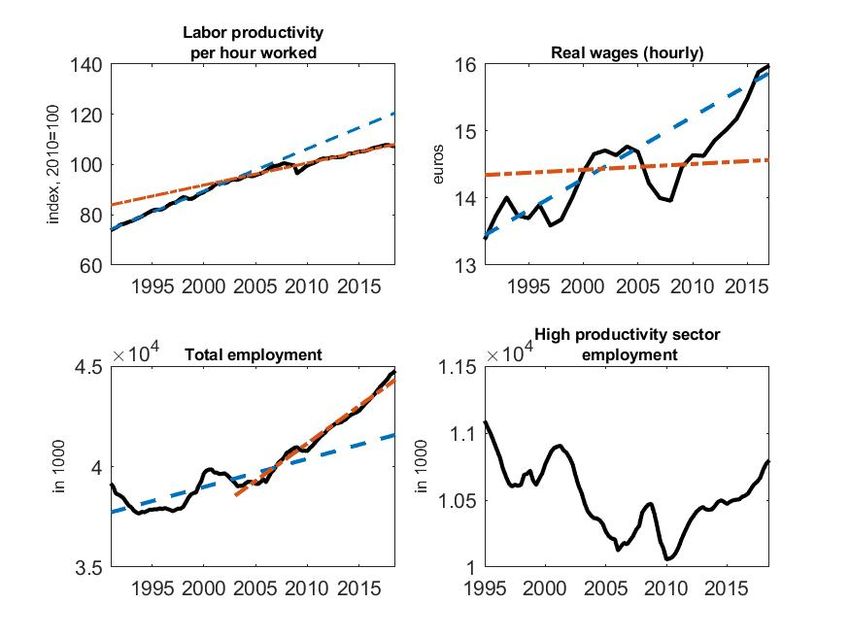
scale labor market reform. Figure 1 illustrates developments in Germany with regards
to productivity, wages and employment over roughly the past three decades. A central
observation in this context is that, after a phase of both relatively high labor productivity
and real wage growth in the beginning of the sample, from the early 2000s onward both
labor productivity and real wage growth began to stagnate for a sustained time period.
This substantial slowdown in both productivity and real wage development illustrates also
the
attening of the corresponding trend over the 2003 to 2012 period (orange line) vis-à-
vis the pre-reform trend (blue line). Importantly, this episode overlaps with a large-scale
labor market reform package, commonly referred to as the "Hartz" reforms, which was
implemented from 2003 to 2005, and constitutes the largest change in the German social
security system in the post-war period (for an overview of the main reform steps and labor
market eects see, for instance, Jacobi and Kluve (2007) and Schmöller (2013)). A cen-
tral aim of the Hartz reforms was to raise employment, induced above all by a substantial
decrease of workers' outside option through a marked reduction of both unemployment
bene
t payments and entitlement periods. In addition, bene
ts were rendered conditional
on proven active job search, severe penalties in case of non-compliance were introduced
and the acceptance of suitable job oers was made mandatory. A further important re-
form step constituted the introduction of new employment forms with shorter standard
weekly working hours to foster out
ows of unemployment and inactivity into employment.
These events translated into a large-scale shift in the evolution of employment in the
follow-up of the reforms in the mid 2000s (see Figure 1, lower-left panel): Upon a phase
of persistently high unemployment, employment increased rapidly and continuously over
the the post-reform period. The employment level in 2013 exceeded its 2003 counterpart
by roughly 9 per cent and has expanded further in the context of the economic expan-
sion in Germany. Interestingly though, these large-scale employment gains have not been
evenly distributed across sectors. Instead, employment increases were mostly realized in
sectors with relatively low productivity, while employment in high-productivity sectors
5Figure 1: Evolution of productivity, wages and employment in Germany
Upper-left panel: real labor productivity per hour worked, index (2010=100), quarterly
and seasonally-adjusted data, source: Eurostat; upper-right panel: real earnings per em-
ployee hour worked, net, constant prices, resident concept, in euros, source: German
Federal Statistical O
ce; lower-left panel: total employment, measured in 1000 workers,
age: 15-64, source: Eurostat; lower-right panel: employment in high-productivity sectors
(de
ned as industry (excluding construction), information and communication as well as
nancial and insurance services), measured in 1000 workers; blue and orange lines indi-
cate linear trends evaluated over the time period 1991q1 to 2002q4 and 2003q1 to 2012q4
respectively.
6stagnated following the labor market reform and only started to increase towards the end
of the sample period, as also illustrated in the lower-right panel of Figure 1. In sum, the
experience in Germany has been characterized by stagnant real wage growth, a slowdown
in productivity, as well as a substantial expansion of employment, which was dispropor-
tionally concentrated in low-productivity sectors. This paper draws on this experience and
proposes a model which reconciles these observations into a single, tractable theoretical
framework. In particular, I propose a mechanism, which demonstrates that a slowdown
in productivity and stagnant real wage growth despite substantial decreases in unemploy-
ment can constitute two sides of the same coin following an employment expansion as in
the initial phase following the employment shock, production factors are misallocated to
low-productivity sectors.
While the case of Germany constitutes a clear-cut example of a large-scale expansion of
employment triggered by a labor market reform and thus represents an important empir-
ical motivating episode of the theoretical mechanism proposed in this paper, the insights
of this analysis are not restricted to the case of Germany. Firstly, many countries have
implemented comparable labor market reforms. Denmark and Sweden constitute notable
examples. Moreover, several euro area economies implemented similar labor market poli-
cies following the recent crises in the euro area . While the focus of this analysis is the
labor market policy-induced employment shifts with economic dynamics in Germany dur-
ing the post-reform phase as a concrete example, a further potential channel can be found
in migration, with the UK economy as a potential suitable example in this context: Also
the UK experienced a pronounced expansion in employment, while simultaneously labor
productivity growth has markedly slowed and real wages have stagnated over a sustained
time period.
73 The model
We consider a perfect foresight, in
nite horizon, closed economy. Let time be discrete and
indicated by t. The model economy is inhabited by a continuum of mass 1 of identical
households, as well as a large number of identical
rms. Production takes place in two
sectors, which are heterogeneous with regards to productivity: The economy features a a
low-productivity sector as well as a high-productivity sector, which constitutes the growth
engine in the economy.
3.1 Households
The representative household derives utility from consumption Ct and leisure 1 Lt , where
t denotes the preference parameter of leisure as opposed to consumption. Consumption 3
Ct is a Cobb-Douglas aggregate of the good produced in sectors h and l respectively:
Ct = (Cth )! (Ctl )1 ! ; (1)
where ! states the weight of the good in the high productivity sector ( 0 < ! < 1).
Households choose consumption of both goods Cth and Ctl , labor input Lt , as well as bond
holdings Bt+1 to maximize lifetime utility
1
X
max
C h ;C l ;L ;B
t (log(Ct) + tlog (1 Lt )) ; (2)
t t t t+1 t=0
subject to the budget constraint
Bt+1
Cth + Ptl Ctl + = WtLt + Bt + t; (3)
Rt
where 0< < 1 denotes the subjective discount factor. Ptl stands for the relative price
of good l in terms of units of good h, the price of which is normalized to unity. Further,
Rt represents the real interest rate and Wt the real wage expressed in good h units. Bt+1
refers to the stock of one-period risk-free bonds, bought at the price R1t . We abstract
from corner solutions and focus on equilibria in which production occurs in both sectors.
Labor is perfectly mobile and wages equalize across sectors (Wth Wtl Wt ). Hence, = =
Wt Lt refers to the household's time t labor income. Firms are owned by the representative
3 Preferencesare logarithmic, additive and separable in consumption and leisure as, for example, in
King, Plosser and Rebelo (1989). The logarithmic structure of the preferences ensures the existence of a
balanced growth path.
8household, which earns the corresponding
rm pro
ts t .
The set of
rst order conditions can be derived as follows. The intratemporal condition
links the relative price Ptl to the marginal rate of substitution between good h and l
respectively:
Ptl =
1 ! Cth
: (4)
! Ctl
The Euler equation, denoted in terms of Cth units, determines the intertemporal allocation
of the consumption of the good produced in the high-productivity sector and can be
derived as
1 = Rt
1 : (5)
Ch t Cth+1
Moreover, the trade-o between consumption and leisure can be stated as follows:
t
1 Lt
= C!h Wt: (6)
t
3.2 Production: Low-productivity sector
Contrary to sector h (see section 3.3), no technological innovations are realized in the
low-productivity sector l. This assumption captures the notion of sector h representing
the growth engine in the economy, while at the same time keeping the model tractable.4
The non-tradable good is produced using labor by means of the production function
Ytl = Llt : (7)
Perfectly competitive
rms in sector l choose labor input Llt to maximize pro
ts
max
Ll
Ptl Ytl Wt Llt ; (8)
t
delivering the optimality condition
Ptl = Wt : (9)
4 For simplicity, I abstract from technological innovation in the low-productivity sector. However, the
key model implications would be qualitatively unaltered when allowing for productivity advances in both
sectors, while the learning-by-doing externality is more pronounced in the high-productivity sector.
93.3 Production: High-productivity sector
Firms in the high-productivity sector produce good h using labor input Lht and building
on the stock of knowledge At according to the production function
Yth = At Lht 1 ;
(10)
where 0< < 1 and At is non-rival and non-excludable.5 Sector h can be considered
the economy's growth engine as the evolution of knowledge At determines technological
progress, which constitutes the main driver of long-run growth in the economy. The costs
of production in sector h consist of wage costs Wt Lht as well as nonlinear hiring costs given
by
At
Lht 2 Lh Lht ; (11)
2 Lht 1 t 1 I
where 8
Lht = :1; Lht > 0
< if
I (12)
0; otherwise
and Lht = Lht Lht 1 applies. The basic process describing the hiring costs is quadratic
and standard as assumed in the literature on the adjustment cost of production factors.
As described in equation, the indicator function I Lht equals unity in case of hiring
(Lht > Lht 1 ) and zero otherwise, implying that labor adjustment costs are nonlinear and
only occur in the case of hiring. Due to this property and the absence of adjustment
costs in the low-productivity sector, this speci
cation also implies that labor can be
hired freely into sector l, while hiring in the high-productivity sector is subject to costs.
This property captures the notion that processes in the low-productivity sector l are
compared to the high-productivity sector rather simplistic, rendering introducing newly
hired workers in this sector to their tasks rapid and the training costs of new hires vis-
à-vis the high-productivity sector negligible. Hiring in sector h, in turn, is costly, given
the more complex production processes and correspondingly higher training costs of new
hires. Put dierently, the prevalence of hiring costs in the high-productivity sector can
also be interpreted as a tractable approximation of the presence of search and matching
frictions in the economy, thus re
ecting the relatively higher search costs in the high-
productivity sector. denotes a standard labor adjustment cost parameter. Hiring costs
are indexed to the overall total factor productivity level in this sector At , which ensures
5 This
type of production function can be considered standard in macroeconomics, see for instance Galí
(2008). Decreasing returns to scale can generally also be rationalized by a required managerial capital
H in high-productivity production, resulting from the complexity of the production structure and the
management of human and knowledge capital: Yth = At H Lht 1 . See, for instance, Lucas (1978) and
Guner et al. (2019) for reference in this context.
10that the adjustment costs do not diminish as opposed to the wage costs given that real
wages grow at the overall growth rate of the economy on the balanced growth path. In
this setting,
rms maximize pro
ts by choosing the optimal labor allocation Lht :
max A Lh 1 Wt Lht At
Lht 2 Lh Lht : (13)
Lht
t t 2 Lht t 1I
1
The corresponding optimality condition equals to
(1 ) At Lht
At
Lht I LH = W : (14)
t t
Lh t 1
Since in the steady state the labor allocation
in sector
h is constant, there are no adjust-
ment costs on the balanced growth path (I =0 Lth ). Hence, the optimality condition
in the new steady state corresponds to (1 ) LH = WAtt :
3.4 Evolution of technology growth
The model economy is subject to endogenous growth in the stock of knowledge in sector
h, implying the notion that sector h constitutes the growth engine in the economy. The
underlying process of knowledge accumulation is of the form of learning-by-doing in the
sense that technological progress is increasing in labor allocated to the high-productivity
sector Lht . More speci
cally, the stock of knowledge At evolves according to the process
At+1 = At 1 + Lhtdt ; (15)
where dt= LLhth denotes the distance of the current labor allocation to the respective sector
h employment on the balanced growth path Lh . Hence, tomorrow's technology stock At+1
depends positively on the current technology stock At and sector h labor Lht re
ecting the
fact that human capital is required for knowledge creation following Benigno and Fornaro
(2014) and Alberola and Benigno (2017). The parameter captures the e
ciency of sec-
tor h in knowledge accumulation ( > 0). Technology growth is moreover the higher, the
larger the distance dt to the labor allocation at the balanced growth path and hence the
productivity frontier. This property increases the realism of the growth process by de-
parting from a purely linear speci
cation. Instead, the process of knowledge accumulation
takes into account that any unit Lht can generate higher productivity advances when the
labor allocation to the high-productivity sector is below its steady state value and the
economy is catching up to its steady state. This assumption captures the notion that in
this environment, any unit of labor allocated to sector h increases the technology stock
more intensely than in an environment of relatively higher productivity. This features
11also the property of diminishing returns in the technological progress through R D, as &
is in line with the empirical endogenous growth literature (see Griliches, 1990), stating
that realizing technology advances becomes increasingly di
cult when labor allocated to
the innovative sector is already high. represents the weight of the distance to the pro-
ductivity frontier, where 0 < < 1 applies. From equation (15), the rate of technology
growth gt+1 can be derived as
At+1
gt+1 = = Lhtdt: (16)
At
At the balanced growth path, the economy's rate of technology growth corresponds to
g = Lh, which implies that the long-run growth rate of the economy is increasing in
the steady state labor allocation to the high-productivity sector, re
ecting the need of
productive resources in realizing technology advances.
Importantly, and as demonstrated in detail in section (5.2), the knowledge accumulation
process (15) generates a growth externality in the economy. Recall that the stock of knowl-
edge is non-rival and non-excludable, which implies in combination with the presence of
a large number of
rms in the high-productivity sector that
rms do not internalize the
impact of their own labor allocation on the evolution of the economy's stock of knowledge.
This property constitutes a growth externality since sector h
rms do not internalize the
social value of the labor allocated to the high-productivity sectors in raising technology
growth, aggregate productivity and output and thus the overall performance of the ag-
gregate economy.
3.5 Competitive equilibrium
The equilibrium conditions in the competitive equilibrium can be summarized as follows.
Good markets for both good h and l have to clear:
Cth = Yth ; (17)
Ctl = Ytl : (18)
As we consider a closed economy, bonds have to be in zero net supply:
Bt = 0: (19)
12Lastly, households' labor supply must be equal to the labor demand by
rms:
Lt = Lht + Llt : (20)
Hence, the perfect foresight equilibrium6 can be de
ned as a set of prices fPtl ; Wtg1t=0,
the allocation fYth; Ytl ; Lt; Lht; Llt; Cth; Ctl ; g1t=0 and productivity level fAt+1g1t=0 satisfying
equation (4)-(7), (9), (10), (15), (17), (18) and (20).
3.6 Calibration
This section presents the calibration of the model (Table 1). The model is calibrated
to annual frequency and the discount factor is calibrated accordingly ( = 0:975). I
calibrate the scale parameter in high-productivity production to 13 , as standard in the
literature (see, for instance, Galí (2008)). The Cobb-Douglas aggregation parameter !
is set to 0:32 to generate a steady state share of high-productivity to total employment
Lh of 0:24 - a value consistent with the share of high-productivity sector employment
L
in Germany since the reuni
cation.7 Disutility of labor equals to 2:0146 in the initial
state of the economy and to 1:7867 following the labor supply shock, generating overall
employment levels of initially L1 = 0:3072 and L2 = 13 in the post-shock phase.8 The
e
ciency of labor in the knowledge accumulation process is set to match an initial
growth rate g1 of 1:47% and is hence in line with the average growth rate of the German
economy over the post-reuni
cation period up until the implementation of the large-scale
labor market reforms in 2003. The hiring cost parameter is set to a rather low value.
To see that this holds true, consider the hiring costs in the case if high-productivity
rms
were immediately to fully increase employment in their sector to the new steady state
value Lh2 , then the hiring costs would correspond to roughly one per cent of the wage bill
in that sector. The parameter governs the relative weight of the distance of current
labor allocation Lht to its steady state value and is set to 0:4. Further, given the other
model parameters, the parameters and jointly control the speed of the transition to
the new steady state which corresponds to roughly 10 years in this setting.
6 The underlying assumption on the nature of the labor supply shock is that it constitutes a one-time,
unanticipated shock ("MIT shock").
7 I de
ne "high-productivity sectors" as industry (excluding construction), information and communi-
cation, as well as
nancial and insurance services.
8 This value corresponds to an employment expansion of roughly 9 per cent in the course of the ten
year transition to the new long-run equilibrium, which corresponds to the employment increase realized
in Germany in the time period 2003 to 2013.
13Parameter Description Value
Discount factor 01:975
Production function parameter 3
! Cobb-Douglas parameter
(high-productivity sector)
0:32
Adjustment cost parameter 2:75
1 Initial disutility of labor 2:0146
2 Post-shock disutility of labor 1:7867
E
ciency parameter in
knowledge accumulation
0:2
Weight of distance in
knowledge accumulation
0:4
Table 1: Calibrated parameters
4 Wage and productivity dynamics
This section presents the eects of the employment shift on key economic variables with a
special focus on the dynamics of real wages and productivity. Importantly, while the real-
ized employment gains are associated with long-term improvements of most key economic
variables (section 4.1), the rise in employment is in the initial phase of the transition to
the new equilibrium accompanied by a misallocation-induced slowdown of real wage and
labor productivity growth, as well as by welfare losses (section 4.2).
4.1 Long-run eects
This section presents the long-run eects of the employment shift. Table 2 compares the
long-run economic outcomes in the pre-shock steady state and in the steady state follow-
ing the employment increase. The rise in employment is triggered by a labor supply shock
in the form of a permanent fall in the disutility of labor 2:0146 to 1:7867.9 This
from
change induces a permanent increase in employment by 8:5 per cent to 0:33. Employment
gains are realized in both sectors and, importantly, the economy settles in a new steady
state in which the share of high-productivity employment to total employment is equally
high as in the pre-labor supply shock phase. The latter implies that the disproportionate
allocation of productive resources to the low-growth sector, as presented in the subsequent
section, constitutes only a transitory phenomenon and that the new long-run relative la-
bor allocation is identical to its pre-shock value. This property implies that the increase
in employment is not permanently associated with a higher degree of misalloction of labor
9 The labor supply shock is assumed to constitute a one-time, unanticipated shock ("MIT shock").
14to low-productivity sectors.
As highlighted in equation (15), the rate of technology growth depends positively on the
labor allocated to the high-productivity sector. As a result, the long-term increase in LT
translates into a higher rate of technology growth in the new long-run equilibrium. More
speci
cally, at the new balanced growth path the rate of technology growth corresponds
to 1:H59%Lvis-à-vis 1:47% prior to the employment shift. Since labor productivity, de
ned
Y +P Y L
as t Ltt t , grows at the rate of technology growth on the balanced growth path, also
labor productivity grows correspondingly at an increased rate of : 1 59%
in the new long-
run equilibrium. The long-run equilibrium interest rate R increases as a consequence of
the surge in the economy's steady state growth rate (1 + g = R ).
As to the wage development, on the new balanced growth path real wages grow at the
economy's new, increased equilibrium growth rate. Importantly though, and visible also
from equation (14), the level of productivity-adjusted real wage W t
At drops permanently.
This fall is caused by the standard channel of falling real wages following employment
increases and the corresponding decrease in the marginal product of labor in the presence
of diminishing returns in production.10
To summarize, the labor supply shift results in permanent increases in aggregate employ-
ment. Moreover, given increased employment in the high-productivity sector, resources
for technology growth increase, raising the overall rate of technology growth and thus
the economy's equilibrium growth rate. As at the new balanced growth path real wages
grow at the rate of technology growth, in the long-run the employment shift also exerts a
positive impact on real wage growth. TFP-adjusted real wages W t
At , however, fall perma-
nently below their pre-employment shift value as a result of increased employment in the
presence of diminishing returns in the high-productivity sector.
4.2 Misallocation along the transition path
The long-run gains from the employment increases are not realized immediately in full
but only gradually over time as the initial phase following the employment shift is char-
acterized by a misallocation of labor to the low-productivity sector l. Figure 2 illustrates
the transitional dynamics to the new steady state following the labor supply shock.
10 The various underlying mechanisms are discussed in greater detail in the subsequent section.
15Initial steady state Post-shock
2.02 1.79
L 0.31 0.33
LH 0.07 0.08
LL 0.23 0.25
LH 0.24 0.24
L
g 1.47 1.59
gLP 1.47 1.59
r 4.01 4.20
W 1.59 1.55
A
Table 2: Initial and post-shock steady state allocation
Growth rates and the real interest rate r are denoted in per cent; values are rounded to
three decimals.
As illustrated in the left uppermost panel, the employment increase is triggered by a per-
manent fall in the disutility of labor from 2:0146 to 1:7867 which can be interpreted as
a decrease in individuals' outside option of working. This shift causes an increase of the
labor supply and employment upon impact and employment further increases over the
subsequent periods until it reaches its new steady state value of 0:33 after 10 periods.11
Concerning the relative labor allocation across sectors, initial employment increases are
predominantly realized in the low-productivity sector due to the presence of hiring costs
in the high-productivity sector. As
rms in the low-productivity sector do not face costs
of hiring, sector l employment increases substantially upon impact, while the employment
gains in the high-productivity sector are initially small and increase only gradually to their
new steady state value over time. As high-productivity sector employment is prevented
from equally absorbing the employment increases, the ratio of high-productivity workers
in total employment falls substantially relative to the initial steady state ratio.
The employment gains in the high-productivity sector h foster knowledge accumulation
as a result of increased resources in the learning-by-doing process (15) and hence raises
the rate of technology growth gt immediately in the initial phase following the transition.
The growth rate of labor productivity, however, drops initially. This is the result of two
channels. Firstly, in the presence of diminishing returns in sector h production, employ-
ment increases are accompanied by a fall in average productivity. Secondly, and most
importantly, the positive impact of the increase of overall technology growth gt on labor
productivity is not proportional to the employment increase as a result of the misalloca-
tion of workers to the low-productivity sector.
11 The model is calibrated so that after 10 years the transition to the new long-run equilibrium is
concluded. With regards to the German economy, this implies that from the point of view of this model,
the transition to the new balanced growth path was completed by 2014.
16Over time, however, the drop in the share of high-productivity sector employment in total
employment begins to reverse due to gradual hiring in sector h as labor moves from the
low- to the high-productivity sector. These employment gains in the high-productivity
sector raise resources for knowledge accumulation in the economy, which translate into
further increases in the rate of technology growth gt . Improvements in technology growth
also increases the growth rate of labor productivity gtLP . On its new balanced growth
path, the transitory misallocation of productive resources is reversed and the ratio of
high-productivity labor in total employment returns to its pre-supply shock level.
The labor supply shift further exerts important eects on the development of real wages.
Following the employment expansion, real wages fall as a result of realized employment
gains, while high-productivity sector total factor productivity At increases due to employ-
ment gains in h, resulting in a fall of the ratio W t
At . In the subsequent periods, real wages
grow at a faster rate than technology growth, re
ected in a rise of W t Wt
At . Nonetheless, At
on the new balanced growth path falls permanently short of its pre-employment shock
value as a result of increased steady state employment under diminishing returns in high-
productivity production, as also illustrated by equation (14). This permanent decline
implies that the initial divergence of real wage and total factor productivity development
is not made up for in full along the transition path. Nevertheless, real wage growth in
the new long-run equilibrium exceeds its pre-shock counterpart as real wages grow at the
new balanced growth path at the increased rate of technology growth.
Lastly, the post-shock steady state real interest rate Rt is higher than before the em-
ployment expansion. We can observe that along the transition, the real interest rate
temporarily overshoots, which is the result of agents consumption smoothing motive: In
the initial phase following the shock, output grows more strongly than at its equilibrium
rate on the new balanced growth path as a result of the realized increases in both tech-
nology growth and the rise in employment. As agents seek to smooth consumption, the
real interest rate rises temporarily above its equilibrium level before it adjusts to its new
equilibrium level.
This model provides a qualitative analysis of decelerating real wage and productivity
growth following a substantial employment shift and hence does not aim to quantita-
tively match the observable dynamics in Germany following its labor market reforms.
Importantly though, the model-implied dynamics display qualitatively a close
t to the
17Figure 2: Transitional dynamics following a labor supply shock
18post-reform dynamics in Germany. This holds particularly true for the dynamics of key
economic variables this model was constructed to feature, as presented in the stylized
facts in section 2. More concretely, the model is capable of matching a pronounced em-
ployment increase, which is initially predominantly realized in low-productivity sectors,
while this feature reverses over time, as we can observe empirically observed. Moreover,
the slowdown in labor productivity growth implied in the model is also clearly discernible
in the data.12 Lastly, real wages are both in the model and in the data stagnant for an
extended period of time after the reform but start to increase in later stages following the
employment shock.
To summarize, the economy realizes considerable employment gains following the labor
supply shock. The eect on real wages and productivity depends crucially on the consid-
ered horizon, as the transition phase is characterized by a sectoral misallocation of labor
to the low-productivity sector with the corresponding negative eects on labor produc-
tivity and hence the evolution of real wages. Over the long-run, by contrast, the economy
realizes a higher rate of technology growth and thus productivity growth and hence a
higher aggregate growth rate on the new balanced growth path. The ratio W t
At falls per-
manently short of its pre-shock level as a result of the reduced average marginal product
of labor given the realized employment increases, putting a wedge between total factor
productivity and wages. Nonetheless, higher technology growth also translates into higher
real wage growth in the new long-run equilibrium, which implies that the bene
ts from
the labor market shift are also passed on to workers in the form of higher real wage growth.
5 Ine
ciency of the competitive equilibrium
The results presented in the previous section indicated that
rms do not internalize the
eect of their employment choices on the evolution of the stock of knowledge and ulti-
mately on the long-run growth rate in the economy. Given the presence of this growth
externality, the competitive allocation is not e
cient. I demonstrate the ine
ciency of
the competitive equilibrium in what follows by deriving the social planner problem, its
optimality conditions, as well as the resulting implications for the optimal resource allo-
12 While both in the model and in the data a sustained slowdown in labor productivity is observable in
the follow-up of the reforms, the model foresees a rebound in productivity growth, which is at this point
not yet discernible in the data. This is owed to the well-established fact that a host of factors weigh on
productivity growth in advanced economies, which add additional downward pressure on the evolution
of productivity, ranging from the impact of an ageing society to diminished innovation capacity owed to
the third industrial revolution having entered a phase of diminishing returns (see for instance Schmöller
(2018) for an overview of potential drivers of the productivity slowdown).
19cation relative to the competitive equilibrium. Crucially, I
nd that relative to the social
planner's choice, employment in the high-productivity sector is ine
ciently low in the
decentralized economy, as the social planner takes into account the eect of the relative
labor allocation on the aggregate growth performance of the economy, giving rise to the
notion of resource misallocation in the competitive equilibrium.
5.1 Social planner problem
In contrast to the competitive equilibrium, the social planner takes directly into account
the eect of its decisions on the evolution of the technology stock, aggregate produc-
tivity and the economy's long-run growth potential. Hence, while
rms in the compet-
itive equilibrium do not internalize the impact of their labor allocation choice on tech-
nology growth, the social planner directly internalizes the growth externality resulting
from learning-by-doing in the high-productivity sector. In particular, the social planner's
decisions factor in the additional aggregate income which can be generated by raising
the production in the high-productivity sector. The social planner chooses the variables
fCth; Ctl ; Lht; Llt; Lt; At+1g to maximize households' expected utility subject to the resource
constraints in the economy. More speci
cally, the social planner's problem can be stated
as follows 1
X
max
Cth ;Ctl ;Lt ;Lht ;Llt ;At+1 t=0
t (log(Ct) + tlog (1 Lt ))
subject to the resource constraints
Cth = ( At Lht )1 At
Lht 2 Lh Lht ;
2 Lht 1 t 1I
Ctl = Llt ;
Lt = Llt + Lht ;
as well as the process of knowledge accumulation
At+1 = At 1 + LHt dt :
h l
Let us denote the Lagrange multipliers as C , C , L and A in the order of the stated
constraints and the optimality conditions can be obtained as
!
Cth
= Ct h ; (21)
201 !
= Ct l ; (22)
Ctl
t
1 Lt = t ;
L (23)
At Ct
h
(1 ) Lht
Lht I Lh + A A (1 ) dt = Lt ; (24)
t t t
Lht 1
Ct = Lt ;
l
(25)
" #
At = h
Ct+1 (
Lht+1 )1 Lht+1 2 LhI Lh +
At+1 1 + Lht+1dt+1 : (26)
2 Lht t t+1
Let us now turn to the impact of an employment shift in the social planner equilibrium.
Figure 3 demonstrates the eect of a labor supply shock on the key economic variables
in the social planner allocation as opposed to the competitive equilibrium and we can
observe the following central dierences. Firstly, the social planner allocates substantially
more labor to the high-productivity sector throughout the transition to the new balanced
growth path. Importantly, the initial drop in employment in the high-productivity sector
versus the low-productivity sector is by far less pronounced in the social planner equilib-
rium. Moreover, the transition time to the new steady state is markedly reduced as the
social planner seeks to alleviate the misallocation of productive resources alongside the
transition path. Lastly, the social planner also raises the total share of labor allocated to
the high versus low-productivity sector at the new balanced growth path as well as total
employment in the economy. These observations re
ect the social planner's awareness of
the impact of its employment choices on the rate of technology growth, aggregate produc-
tivity and ultimately the economy's long run growth potential. This is strongly re
ected
in the evolution of technology growth: By choosing a higher aggregate employment level
and hence allocating overall more productive resources to production, as well as by allo-
cating an increased share of total employment to the economy's growth engine, the social
planner realizes substantially higher rates of technology growth and thus long-run growth
vis-à-vis the competitive equilibrium. This property emphasizes also the fact that the
initial disproportional employment gains in the low-growth sector are ine
cient and can
hence constitute a form of resource misallocation.
21Figure 3: Transitional dynamics
Black solid lines: dynamics in the decentralized economy; blue dotted lines: dynamics in
Lh
the social planner economy; aggregate employment Lt and the employment ratio Ltl are
t
denoted in terms of percentage deviations from the initial, i.e. pre-supply shock steady
state allocation; the rate of technology growth gt is normalized by the growth rate at the
initial balanced growth path gCE
1 and g 1 respectively and the transition graph hence
SP
depicts the percentage point increase in the technology growth rate relative to the initial
balanced growth path gt g 1 .
225.2 The role of the growth externality
This section demonstrates analytically the mechanisms driving the wedge between the
allocation in the social planner's problem and the decentralized economy and shows that
the presence of a growth externality resulting from the process of knowledge accumulation
(15) is key in generating the ine
ciency in the competitive equilibrium. To understand the
role of the growth externality in this context, combine equations (24) and (25) to obtain
a condition determining the relative allocation of labor across sectors in the economy
At (1 ) Lht
LHt I Lh + A At (1 dt ) = Ct l
: (27)
t Ch
Lh t 1
t
| t {z }
Ct h
growth externality
In the absence of a growth externality ( = 0), the labor allocation to the high-growth
sector does not exert any eect on technology growth and the social planner equilibrium
and the competitive equilibrium coincide. To see that this holds true, consider the case
= 0. Then, just as in the competitive equilibrium, the growth externality would not
play a role in the social planner allocation and the previously stated condition would
correspond to
At (1 ) Lht
LHt I Lh = Ct l :
Lht 1
t
C h t
To see how this links to the allocation in the competitive equilibrium, recall that in the
decentralized
h economy Wt = Ptl applies
i and combined with equation (14) one can obtain
LHt I Lh = P l . As the relative price P l in the competitive
At (1 ) Lht Lht 1 t t t
Ct l
equilibrium can be understood as the ratio of shadow prices Ptl = Ct h
, it follows
CE
Ct l Ct l
straightforwardly that
Ct h
> Ct h
for > 0. This holds true as the social
SP CE
planner takes into account in its decision making the eect of the labor allocation to the
high-productivity sector on technology growth which arises from the growth externality.
As from equations (21) and (22) follows that the relative consumption andhence labor
Ct l
allocation in sector h as opposed to sector l is increasing in the ratio
Ct h
, the social
planner allocates a relatively higher share of labor to the high-productivity sector as a
result of its eect on the economy's growth performance:13
h h
Lt Lt
> :
Llt SP Llt CE
13 Technically this holds true as At A
t (1 ) d
t > 0.
23While this implies a relatively higher share of employment in the high-productivity sector
versus the low-productivity in the steady state, this result has also important implications
for the transition to the balanced growth path as the social planner eliminates the dis-
tortively low relative labor allocation to the high-productivity sector. This
ndings also
shows that the initial disproportionally low allocation to sector h constitutes a misallo-
cation of productive resources in the economy. Note also that, generally, the eect of the
growth externality on resource allocation in the social planner problem is the stronger,
the higher the Lagrange multiplier A
t which denotes, as stated in equation (26), the value
the social planner attributes to raising productivity in the economy.
Lh
In addition to raising the ratio of high-productivity to low-productivity employment Ltl
t
and given the endogeneity of the labor supply, the social planner raises sector h employ-
ment also by increasing total employment Lt :
(Lt)SP > (Lt)CE :
Appendix (A.1) provides a formal proof for higher overall employment in the social plan-
ner equilibrium. Lastly, while the misallocation along the transition path is the main focus
of this analysis, note that these
ndings also imply an ine
ciently low labor allocation to
the high-productivity sector on the balanced growth path in the decentralized economy,
which implies an ine
cient degree of technology growth in the steady state. This is in
line with a feature frequently prevalent in standard endogenous growth models, namely
an ine
ciently low overall level of technology-enhancing investment in the competitive
equilibrium (Romer, 1990).
6 Policy implications
The previous sections have demonstrated the eects of the employment shift on key eco-
nomic variables. We now turn to the implications of these
ndings for macroeconomic
policy with a special focus on potential complementary policy options to alleviate the re-
sulting ine
ciencies given the misallocation along the transition path. Section 6.1 shows
how the social planner allocation can be decentralized in the competitive equilibrium and
by that demonstrates the main properties characterizing optimal policy intervention in
this context. Section 6.2 presents policy strategies, which are in line with the previously
derived options for decentralizing the competitive equilibrium.
246.1 Decentralizing the social planner allocation
This section addresses how the social planner allocation can be decentralized in the com-
petitive equilibrium. A potential policy option to impose the social planner's choice in
the competitive equilibrium is subsidizing production in the high-productivity sector h,
which is demonstrated in what follows.14 Firstly, recall that the optimality condition in
the social planner equilibrium which internalizes the eect of the labor allocation on the
overall rate of technology growth in the economy equals to
At (1 ) Lht
Lht I Lh + A At (1 ) dt = Ct l
:
t Ch
Lht 1
t
t Ct h
Note further that in the competitive equilibrium with subsidies to production in the high-
productivity sector
t -
nanced by lump sum taxes Tt on households,
rms maximize
pro
ts ht as described as follows:
max = (1 + )
h
t At Lht 1
Wt Lht At
LHt 2 LH Lht ;
Lh
t 2 LHt 1 t 1 I
t
which delivers the optimality condition in the presence of subsidies:15
(1 +
t) (1 ) At Lht
At
LHt I Lh = P l :
Lh t t
t 1
C l
Since Ct h
t
=
Ptl applies, we can derive the condition for the optimal subsidy by equating
the left-hand side of the respective optimality conditions in the social planner allocation
(27) and competitive equilibrium under subsidies respectively as:
At
Ct h
(1 ) (dt )
t = :
(1 ) Lht
Hence, the optimal subsidy displays the following properties. Firstly, in the absence of
the growth externality ( = 0), the optimal subsidy is zero as the allocations in the de-
centralized and social planner equilibrium allocation coincide. Crucially, the stronger the
externality in the knowledge accumulation process, i.e. the higher - the e
ciency pa-
rameter of sector h labor allocation in generating technology advances - the higher the
14 The subsequent analysis shows that subsidies to high-productivity production constitute one feasible
policy option of decentralizing the social planner allocation in the competitive equilibrium. Potential
policy options are, however, not limited to this concrete policy choice. Policies aimed at osetting the
labor adjustment costs in the high-growth sector, for instance, could also achieve the aim of fostering the
adjustment to the new high-employment high-growth long-run equilibrium.
15 The optimality condition in the low-productivity sector P = W is also imposed in this step.
t t
25optimal subsidy to high-productivity production. The underlying reason is that the aggre-
gate resources the social planner can generate by allocating labor to the high-productivity
sector are the larger, the stronger the externality as any additional unit of labor allocated
to sector h will more strongly impact on the speed of knowledge accumulation and hence
both aggregate growth and income. Importantly, the subsidy is also increasing in the
distance to the productivity frontier dt . Consequently, on the transition path to the new
balanced growth path, the subsidy will be higher vis-à-vis its steady state level as the
social planner intends to increase the speed of convergence to the new high employment-
high productivity growth equilibrium. It is worth noting that, nevertheless, the subsidy
is non-zero also at the balanced growth path, indicating once more the ine
ciently low
labor allocation to the economy's growing sector h in the decentralized economy. This
eect is the stronger the higher is the relative weight on high-productivity labor Lht in
knowledge generation versus the distance to the frontier, i.e. the lower .
We can now derive the tax corresponding to the optimal subsidy. As stated before,
the subsidy is
nanced via lump sum taxation on households implying that household's
decisions are left unaltered in equilibrium. The corresponding lump sum tax on households
Lht 1
can be derived as Tt =
tyth and thus as Tt =
tAt which equals to:
At (1 ) h
Tt = dt At Lt :
Ct h 1
Lastly, the household budget constraint in the competitive equilibrium with subsidies to
t +
production in the high- productivity sector corresponds to C h P l C l Bt+1t t +
WL Rt = t t +
Bt + t Tt .
6.2 Options for policy
Based on the theoretical analysis, we can conclude that shocks which raise the labor
supply and hence employment will at
rst be accompanied by a transitional episode in
which economic variables adjust towards the new steady state. This transitory phase,
however, is characterized by a misallocation of production factors to the low-productivity
sector and a deceleration of labor productivity and real wage growth. As demonstrated in
the previous section, one feasible policy option to decentralize the social planner equilib-
rium in the competitive equilibrium is to subsidize production in the high-growth sector.
Consequently, sector h production subsidies constitute apt policy tools in alleviating the
ine
ciencies along the transition path. Hence, in practice, in the case of a positive la-
26You can also read