Optimization of lipid accumulation in - Pleurastrum insigne for biodiesel production
←
→
Page content transcription
If your browser does not render page correctly, please read the page content below
Research Journal of Biotechnology                                                                               Vol. 16 (10) October (2021)
                                                                                                                              Res. J. Biotech

                Optimization of lipid accumulation in
            Pleurastrum insigne for biodiesel production
                                  Chhandama Van Lal Michael and Satyan Belur Kumudini*
      Department of Biotechnology, School of Science, JAIN (Deemed-to-be University), 18/3, 9th Main Road, 3rd Block, Jayanagar, Bengaluru,
                                                          Karnataka 560011, INDIA
                                     *kumudini.satyan@jainuniversity.ac.in; kumudini.satyan.ju@gmail.com

Abstract                                                                    autotrophic, heterotrophic, or both, producing lipids like
Microalgae emerged as a competent feedstock for                             triacylglycerides (TAG) which account for 20-50 % of their
biodiesel production because of high growth rate and                        dry cell weight10. Transesterification converts these lipids
lipid content. This work focuses on isolation of novel                      into fatty acids methyl esters, FAMEs, which can be used as
                                                                            biodiesel18. Other lipids in microalgae include structural
microalgal strain from different sources of water for
                                                                            lipids like polyunsaturated fatty acids (PUFAs) and polar
the production of biodiesel. The isolated microalgae,                       lipids like phospholipids and sterols13. In addition to lipids,
Pleurastrum insigne possessed high lipid content (~28                       microalgae contain a significant amount of proteins and
% dcw), further optimized to 57.06 % dcw using a                            carbohydrates used in other production industries46.
statistical design (CCD) under Response Surface
Methodology. Lipid production was optimized by                              Biodiesel production from microalgae has proved to be
nutrient (nitrogen and phosphorus) and pH stress.                           incredibly significant and viable in the laboratory and field-
                                                                            testing phases24. Microalgae can optimize their lipid
The different type of fatty acids present in the optimized                  production by altering its metabolism in response to stress
lipid was also profiled using GCMS. Biodiesel yield                         conditions enhancing the economic feasibility of
                                                                            microalgae-derived biodiesel2. Therefore, to produce
was found to be 82.14 % of the total lipid and the fuel
                                                                            sustainable and economically viable biodiesel from
properties tested have met IS, ASTM and EN biodiesel                        microalgae, a proper study on the different lipid optimizing
standards.                                                                  factors is necessary. Nutrient deprivation has been one of the
                                                                            most common and efficient techniques used for inducing
Keywords: Pleurastrum insigne, Microalgae, Biodiesel,                       lipid optimization48.
Lipid Optimization, Response Surface Methodology.
                                                                            Lipid production was optimized by depriving nitrogen and
Introduction                                                                phosphorus supply to Chlamydomonas reinhardtii47.
The use of fossil fuels (coal, petroleum, oil and natural                   Alteration in the pH of the growth medium also induced lipid
gases) in petrochemical and transportation industries has                   optimization in Chlorella sorokiniana34.
increased drastically over the past few decades resulting in
global energy crisis and elevated release of harmful gases in               Nitrogen, phosphorus and potassium, which are the primary
the environment19. South Asian countries like India,                        nutrients for microalgal growth, are abundant in industrial,
Pakistan, Nepal, Bangladesh and Sri Lanka highly depend                     agricultural and domestic wastewaters indicating them as a
on fossil fuels for their energy requirement42. South-East                  potential source of microalgal growth30. The tropical
Asian countries like the Philippines, Thailand, Indonesia,                  climatic conditions of India have made the country a suitable
Malaysia and Vietnam accounted for the highest growth in                    location for the growth of different microalgal species. Algal
the release of CO2 in the world between the year 1990 -                     cultivation in > 2-3 % of India’s total land use could result
201036. More than 33 % of the entire energy supply has been                 in making the country self-sufficient in biodiesel production
used by the transportation industry making it one of the most               and the calorific value was at par with that of coal4.
energy-demanding sectors in the European Union. 73 % of
the total fuel combustion in the transportation industry was                A study of lipid production and biodiesel production from a
attributed to road transport14.                                             new and novel microalgal species which can contribute to
                                                                            the advances in the field of microalgal derived biodiesel is
Hence, steps were taken to incorporate renewable sources of                 needed. In the present study, pure cultures of microalgae
energy into the transportation industry due to its high energy              isolated from wastewaters collected from different sources
demands and greenhouse gas emission1. Microalgae have                       and locations of India, were studied for their lipid content.
received great attention as raw material for biodiesel
production due to their high oil content and growth rate,                   The isolate producing the highest total lipid content, was
ability to grow in lands unsuitable for agriculture and fix                 further optimized using single factor optimization. To
CO246. Microalgae represent the only non-conventional                       overcome the lacuna imposed by the classical single factor
source of biofuel which could replace the conventional usage                optimization and to understand the interactions of the
of diesel10. Microalgae are primarily aquatic, either                       different factors, response surface methodology (RSM) was
prokaryotic or eukaryotic and are tolerant to a wide range of               applied. RSM is an effective statistical approach to shortlist
pH, light, temperature and salinity23. They may be

                                                                      144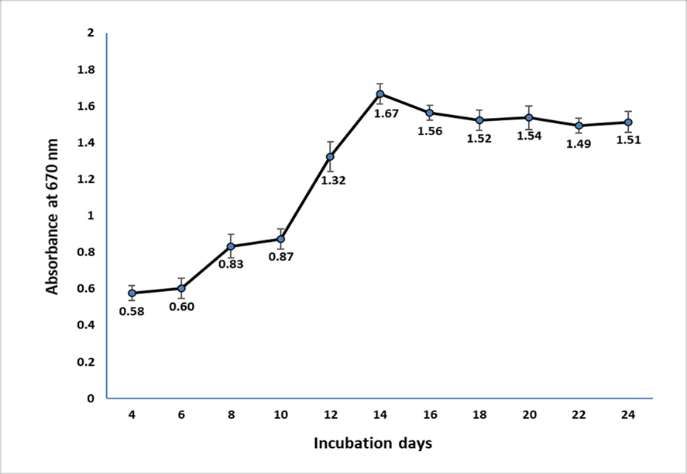
Research Journal of Biotechnology                                                                       Vol. 16 (10) October (2021)
                                                                                                                      Res. J. Biotech
significant factors from multiple factors and optimize culture           Material and Methods
conditions44.                                                            Sample collection: Water samples collected from various
                                                                         sources such as a pond, domestic, agricultural, industrial and
RSM includes i) creation of a series of experiments for                  laboratory wastewaters from different parts of India (Table
reliable estimation of the response, ii) development of a                1) were placed in separate sterile plastic vials containing
mathematical model of the second order response surface,                 Fogg’s medium15. They were carefully transported to the
iii) evaluation of the best set of experimental factors yielding         laboratory without any leakage and stored at 4°C. The
a maximum or minimum value of response and iv) finally                   geographical coordinates of the sampling sites, colour, odour
representation of the direct and interactive effects of the              and pH of the water were noted. Wearing protective gloves,
factors using two- and three-dimensional plots6,35. Central              masks, glasses and maintaining aseptic vials with the
composite design (CCD) under RSM is one of the most                      medium were mandatory safety precautions during sample
frequently used response design experiments. CCD                         collection.
comprises of a fractional design with centre points,
supplemented with a group of axial points estimating the                 Isolation of microalgae: One millilitre of the 10-5 diluted
curve3. The lipid optimized through RSM was transesterified              water samples was inoculated into the solidified Fogg’s
to biodiesel.                                                            medium and incubated for 7-10 days under room
                                                                         temperature (26 ± 2 °C) and 1000 - 2000 lux illumination for
The different properties of biodiesel were tested to check if            12 h/ day. Single colonies were picked and sub-cultured to
they meet the biodiesel standards given by Indian Standards              obtain a pure isolate and observed microscopically (100x;
(IS 1448), American Society for Testing and Materials                    Labomed Vision 2000) for a unialgal culture free from
(ASTM D6751) and European Standards/Norms (EN                            contamination. Growth was checked every 48 h by
14214); international standard agencies provided different               measuring the optical density at λ670nm using Shimadzu UV-
strict permissible limits for different biodiesel properties             1800 spectrophotometer37. The pure isolates maintained in
ensuring a quality biodiesel production.                                 Fogg’s medium were used for further studies.

                                                          Table 1
                     The isolates of microalgae from different sources of water with their lipid content
           Isolate      Location       Geographical              Source            Temperature        pH       Total lipid
                                        coordinates                                   (°C)                    content (%)
                       Kundapura,       13.6316° N,          Agricultural
              1                                                                          27           7.0      6.17±0.04
                        Karnataka       74.6900° E             water
                         Aizawl,        23.7271° N,          Agricultural
              2                                                                          26           7.5      9.20±0.77
                        Mizoram         92.7176° E             water
                         Tanjore,       10.7870° N,          Agricultural
              3                                                                          34           6.0      9.09±0.65
                       Tamil Nadu       79.1378° E             water
                        Guwahati,       26.1445° N,          Agricultural
              4                                                                          32           6.0      7.51±0.74
                          Assam         91.7362° E             water
                       Bengaluru,       12.9716° N,          Laboratory
              5                                                                          28           6.5     14.78±1.92
                        Karnataka       77.5946° E           wastewater
                        Mysuru,          12.2958° N,        Stagnant pond
              6                                                                          26           7.0     11.31±0.04
                       Karnataka         76.6394° E             water
                      Bengaluru,         12.9716° N,        Cubbon Park
              7                                                                          30           5.5      5.33±1.24
                      Karnataka          77.5946° E         Sewage Water
                       Mumbai,           19.0760° N,
              8                                             Sewage Water                 31           6.0     28.05±1.77
                      Maharashtra        72.8777° E
                                         15.2993° N,          Garden
              9       Margao, Goa                                                        28           7.5      8.73±0.96
                                         74.1240° E          wastewater
                       Bengaluru,        12.9716° N,         Domestic
             10                                                                          26           7.0     11.88±0.72
                        Karnataka        77.5946° E          wastewater
                         Vellore,        12.9165° N,
             11                                             Sewage water                 36           6.5      7.00±1.03
                       Tamil Nadu        79.1325° E
                                         28.7041° N,         Domestic
             12        New Delhi                                                         32           6.0     11.00±1.62
                                         77.1025° E          wastewater
                        Coorg,           12.3375° N,
             13                                            Fish tank water               25           7.0      7.13±0.56
                       Karnataka         75.8069° E

                                                                   145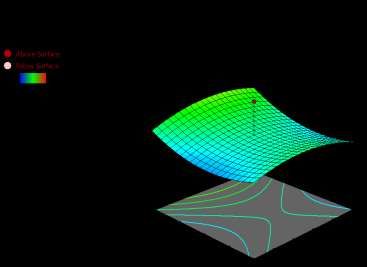
Research Journal of Biotechnology                                                                    Vol. 16 (10) October (2021)
                                                                                                                   Res. J. Biotech
Estimation of total lipid content: Biomass was obtained by             260/280 ratio of DNA sample. 50 - 100 ng of DNA was
transferring the isolates from the stock to a freshly prepared         subjected to PCR using ITS forward (5’-GGAAGTAAAAG
Fogg’s medium and incubated for 12-14 days under                       TCGTAACAAGG-3’) and reverse (5’-TCCTCCGCTT
illumination (12 h per day; 1000 - 2000 lux). The culture was          ATTGATATGC-3’) primers26. DNA sequencing was done
centrifuged (10,000 rpm for 15 min), dried (60° C for 24 h)            at Chromous Biotech Pvt. Ltd., Bengaluru. Raw data in the
and powdered using a mortar and pestle8. Dry cell weight               FASTA format was fed into the software BLASTn from the
(dcw) was determined and the total lipid content (%) was               National Centre for Biotechnology Information (NCBI),
estimated31. Lipid was extracted by Folch method16 using               USA and the sequence with the highest similarity index was
chloroform: methanol (2:1; v/v) as the extracting solvent.             chosen. The sequence was then submitted to the NCBI
The percentage of the total lipid content of each isolate was          library for acquiring the accession number.
calculated by:
                                                                       Single-factor lipid optimization: Single-factor lipid
Total lipid content (%) =                                              optimization was carried out for the shortlisted isolate by
Weight of the extracted lipid / dcw ×100                  (1)          varying the concentration of each nutrient in the medium49.
                                                                       The total lipid contents extracted from 14-day-old cultures
DNA extraction, amplification, sequencing and                          under varied nutrient concentrations and pH (Table 2) under
identification: DNA of the short-listed isolate was                    room temperature (26 ± 2 °C) and illumination (12 h per day;
qualitatively analysed, quantitatively estimated, amplified            1000 - 2000 lux) were analysed. Three factors that induced
and measured using 1 % agarose gel electrophoresis and                 highest lipid production were chosen for further studies.

                                                          Table 2
             Single-factor lipid optimization of P. insigne grown in varying nutrients concentration and pH

                               Nutrients                    Amount                 Total lipid content (%)
                                                              0.00                            -
                                                              0.10                       52.12 ± 0.91
                             KNO3 (g/ml)
                                                              0.20                       42.07 ± 0.40
                                                              0.30                       30.08 ± 0.40
                                                              0.00                            -
                                                              0.01                       47.69 ± 0.29
                            K2HPO4 (g/ml)
                                                              0.02                       42.67 ± 0.09
                                                              0.03                       35.28 ± 0.36
                                                              0.00                       31.63 ± 0.29
                                                              0.01                       31.32 ± 0.27
                             MgSO4 (g/ml)
                                                              0.02                       30.87 ± 0.56
                                                              0.03                       30.54 ± 0.01
                                                             0.000                       31.91 ± 0.22
                                                             0.005                       31.36 ± 0.41
                             CaCl2 (g/ml)
                                                             0.010                       31.61 ± 0.38
                                                             0.015                       27.80 ± 0.46
                                                              0.00                       33.55 ± 0.38
                                                              0.05                       32.11 ± 0.12
                         Micronutrient (ml/ml)
                                                              0.10                       30.96 ± 0.32
                                                              0.15                       30.26 ± 0.42
                                                              0.00                       40.72 ± 0.24
                                                              0.25                       37.90 ± 0.26
                            EDTA (ml/ml)
                                                              0.50                       32.06 ± 0.34
                                                              0.75                       30.47 ± 0.10
                                                               4                         32.03 ± 0.34
                                                               5                         29.27 ± 0.20
                                   pH                          6                         29.59 ± 0.28
                                                               8                         46.41 ± 0.07
                                                               9                         44.01 ± 0.39
                                Control                                                  28.35 ± 1.77

                                                                 146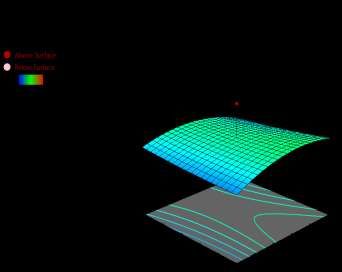
Research Journal of Biotechnology                                                                         Vol. 16 (10) October (2021)
                                                                                                                        Res. J. Biotech
Response Surface Methodology (RSM): The three highest                     min. Glycerol in the bottom was collected and the upper
lipid inducing factors were considered as independent                     layer containing biodiesel was washed with warm water (45
variables and their interaction was analysed using RSM. The               °C) and left for 30 min in a hot air oven for 30 mins for the
specific concentration of the independent variables                       moisture to evaporate29. The percentage of yield was
producing the highest lipid content was their central value.              calculated as:
Two levels (-1 and +1) relative to the central value were
considered. CCD generated 20 sets of experiments with                     Biodiesel yield (%) =
different combinations of the central value and the two levels            Weight of biodiesel produced / Weight of the lipid ×100 (3)
of the independent variables. The total lipid content used as
a response was estimated for each of the different                        Biodiesel properties were tested to check if they met IS
combinations generated in the CCD.                                        1448, ASTM D6751 and EN 14214 specifications. The flash
                                                                          point of the fuel was measured using Abel flash point tester.
Coefficient determination and ANOVA were applied to                       Kinematic viscosity at 25° was measured using Cannon-
evaluate the efficiency of fitting the model. The results of the          Fenske Viscometer 200. Density, acid value, saponification
experiment fitted the second-order polynomial equation:                   number and oxidation stability were analysed as per standard
                                                                          protocol (IS 1448).
Y = ß0 + ß1A + ß2B + ß3C + ß11A2 + ß22B2 + ß33C2 + ß12AB + ß13AC
+ ß23BC                                                       (2)         Statistical analyses: The results of this work were
                                                                          statistically analysed using One-way Analysis of Variance
where Y is the total lipid content (dependent variable). A, B             (ANOVA) in IBM SPSS Statistics 20 for Windows. All
and C are the independent variables that code for KNO3,                   experiments were performed in triplicate. Duncan’s multiple
K2HPO4 and pH respectively. ß0 is the regression                          range test (DMRT) was used to test the difference in the
coefficient at the centre point and ß1, ß2 and ß3 are the linear          means and a p-value of 0.05 or less was considered as a
coefficients. ß11, ß22 and ß33 are the quadratic coefficients             significant value.
and ß12, ß13 and ß23 are the second-order interaction
coefficients. The regression model was generated and                      Results and Discussion
analysed by assessing the values of regression coefficients,              Isolation and lipid estimation: Microalgae represent a
ANOVA, p- and F-values.                                                   diverse group of organisms that can survive in various
                                                                          environments and are a potential feedstock for biodiesel,
Design expert 12 software generated the experimental setup                bio-oil, bio-syngas and bio-hydrogen production23. The total
to produce a regression model predicting the optimum                      lipid content of microalgae varies from 20-50 % dcw which
combinations for the effects of linear, quadratic and                     can be transesterified to biodiesel10. In this study, the lipid
interaction of the response. The experimental model was                   production in microalgae was successfully optimized to
validated by repeating the experiments thrice. The total lipid            improve its economic viability in biodiesel production
content of the organism was calculated under standard                     industry. The isolates from different sources of water and
conditions wherein the predicted response and under                       their total lipid content (%) are given in table 1. Samples
optimized conditions were compared3.                                      used in the study differed in their color, odor, pH and
                                                                          temperature. Thirteen isolates of microalgae from different
Lipid Analysis: The extracted lipid was analysed using Gas                sites were morphologically studied.
Chromatograph (Scientific Trace 1310) and Triple Quad
Mass Spectrometer (Thermo Scientific TSQ 8000) to profile                 Observations showed that they were green in color, circular
the optimized lipid. It was analysed using the DB 5MS                     in shape with prominent chloroplast dispersed as single cells
column (30m, 0.25 mm ID and 0.25 µm film thickness). The                  whereas few existed as chains and clusters. Different species
temperature of the oven was initiated at 40 °C for two                    of microalgae have been studied for biodiesel production and
minutes which was gradually increased to 240 °C at a ramp                 some of the most commonly studied microalgae with their
rate of 5 °C per min and then to 300 °C at a ramp rate of 20              total lipid content including Dunaliella primolecta (23 %
°C per min and kept at hold for two mins. The temperature                 dcw), Nitzschia sp. (45-47 % dcw), Isochrysis sp. (25-33 %
of the injector was at 250 °C. Nitrogen was used as a carrier             dcw), Chlorella sorokiniana (22–24 % dcw), D. salina (6–
gas at a 1.0 ml/min constant flow rate with a split ratio of              25 % dcw) and Scenedesmus obliquus (30–50 % dcw)10,39.
30:143.
                                                                          In this study, it was observed that isolate 8 from sewage
Biodiesel production and characterization of biodiesel                    water in Mumbai, Maharashtra (19.0760° N, 72.8777° E),
properties: Biodiesel was produced from the extracted lipid               has the highest total lipid content ~ 28 % dcw which is at par
by transesterification using H2SO4 (20 %) as a catalyst. The              with other microalgal species studied for biodiesel
methanol: lipid ratio was maintained at 30: 1 (volume:                    production.
weight). The reaction temperature was set at 60 °C for 2
hours in a water bath shaker at 40 rpm. The mixture was then              Molecular identification: The extracted DNA was
transferred to a separating funnel and allowed to settle for 30           subjected to PCR using ITS primer. The nucleotide sequence

                                                                    147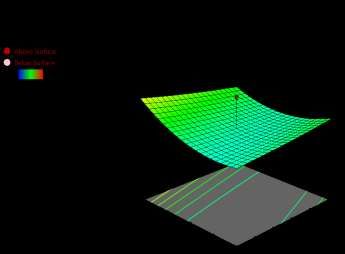
Research Journal of Biotechnology                                                                    Vol. 16 (10) October (2021)
                                                                                                                   Res. J. Biotech
obtained from PCR was ~700 bp which after BLASTn                      28.35 % dcw (control). Single-factor optimization revealed
showed 93 % similarity with Pleurastrum insigne. The                  that lipid production varied with nutrient concentrations and
accession number (MG940908) was generated for the                     pH (Table 2). Observations showed that reducing the
organism by submitting the sequence to NCBI. The cells are            nutrient concentration and altering the pH of the medium
solitary/ clustered forming compact colonies that may be in           resulted in reduced growth but elevated total lipid content.
pairs, triads, or tetrads. P. insigne belongs to phylum               Amongst the various nutrients and pH tested, results showed
Chlorophyta, class Chlorophyceae and order Incertae sedis.            that the total lipid content of the organism in KNO3 (0.1 g
P. insigne was reported to be a Chlorella-like species50.             ml-1), K2HPO4 (0.01 g ml-1) and pH 8.0 was the highest
                                                                      which were 51.12, 47.69 and 46. 41 % dcw respectively.
Growth analysis: The growth of P. insigne was estimated               Enough cell growth for lipid estimation was not obtained in
after every 48 h for 24 days. The growth of the organism              the absence of KNO3 and K2HPO4 similar to previous
exhibited lag phase, log phase and stationary phase. There is         reports11,38. Therefore KNO3, K2HPO4 and pH 8.0 were
no significant growth during the lag phase; log phase started         chosen as the independent variables for further optimization.
from the 8th day of incubation and the highest growth was
observed by day 14 of incubation, after which no increase             CCD generated 20 runs containing the different levels of
indicated stationary phase (Fig. 1). Microalgae stored lipids         combinations of nitrate (KNO3), phosphate (K2HPO4) and
and carbohydrates before entering the stationary phase                pH 8.0 that would maximize lipid production in P. insigne
which can be used as energy source for further metabolic              (Table 3). A considerable variation was observed in the total
activities33. Synechococcus elongates was also harvested on           lipid content of the organism based on the different
the 16th day of incubation27. Chlorella sp. showed                    concentration of the three factors. The highest lipid
progressive growth till the 14th day of incubation before             production (56.56 % dcw) was observed in run number 12
entering stationary phase5.                                           which has nutrient combination of 0.1 g ml-1 KNO3, 0.01g
                                                                      ml-1 K2HPO4 and pH 9.68. The significance of the results
Lipid optimization: The total lipid content P. insigne grown          was confirmed by the results of Analysis of Variance
in Fogg’s medium without modification was observed to be              (ANOVA) as shown in table 4.

                                 Figure 1: Growth curve of P. insigne in Fogg’s medium

                                                                148
Research Journal of Biotechnology Vol. 16 (10) October (2021)
Res. J. Biotech
Table 3
Experimental and predicted responses generated by Central Composite Design using Design Expert 12
Run Factor A: Nitrate Factor B: Factor C: Response: Total lipid content
KNO3 (g/ml) Phosphate pH (%)
K2HPO4 (g/ml) Observed Predicted
1 0.1 0.01 8 27.86 31.05
2 0.05 0.015 9 30.18 31.54
3 0.1 0.01 8 27.31 31.05
4 0.1 0.01 8 27.27 31.05
5 0.1 0.01 8 27.86 31.05
6 0.05 0.015 7 31.24 33.69
7 0.15 0.005 9 45.17 46.46
8 0.15 0.015 9 32.92 33.49
9 0.05 0.005 7 20.47 23.64
10 0.15 0.005 7 24.90 27.28
11 0.1 0.01 8 28.07 31.05
12 0.1 0.01 9.68 56.56 55.26
13 0.15 0.015 7 27.01 28.78
14 0.1 0.0184 8 33.34 31.47
15 0.016 0.01 8 17.94 14.41
16 0.1 0.01 6.3 44.95 40.94
17 0.1 0.01 8 27.07 31.05
18 0.05 0.005 9 33.98 35.95
19 0.184 0.01 8 20.89 19.11
20 0.1 0.00159 8 37.36 33.92
Table 4
Statistical analysis of the results of Central Composite Design developed using Design Expert 12
Source Sum of df Mean F-value p-value
Squares Square
Model 1438.26 91 159.81 4.04 0.0201 significant
A-Nitrate 26.69 1 26.69 0.6747 0.4306
B-Phosphate 7.22 1 7.22 0.1826 0.6782
C-pH 247.65 1 247.65 6.26 0.0313
AB 36.59 1 36.59 0.9251 0.3588
AC 23.56 1 23.56 0.5957 0.4581
BC 104.62 1 104.62 2.64 0.1349
A² 368.16 1 368.16 9.31 0.0122
B² 4.84 1 4.84 0.1223 0.7338
C² 523.31 1 523.31 13.23 0.0046
Residual 395.55 10 39.56
Lack of Fit 81.53 5 16.31 0.2596 0.9174 not significant
Pure Error 314.03 5 62.81
Cor Total 1833.82 19
R2 = 0.7843; Radj2 = 0.5902; Rpred2 = 0.4178; Adeq Percision=9.1862; coefficient of variation (CV) = 19.58
Focusing on the model that maximizes the adjusted R² and design. The predicted R² of 0.4178 is in reasonable
the predicted R², a quadratic model was selected over linear agreement with the adjusted R² of 0.5902 for the response.
and cubic models. Selection of quadratic model was also A variation less than 0.2 between adjusted R2 and predicted
based on the p-value of the lack of fit and the f-value of the R2 is adequate. In this study adequate precision value of
lack of fit. The p-value of the model (≤ 0.05) implicated that 9.186 signifies an adequate signal meaning that this model
the model is statistically significant. The Lack of Fit f-value can be used to navigate the design space45.
of 0.26 implies that it is not significant, meaning that the
residual error is less than the pure error. Non-significant lack The results have indicated that second-order polynomial
of fit implies that the model fits well in the experimental equation can also describe the response where coded factors
149Research Journal of Biotechnology Vol. 16 (10) October (2021)
Res. J. Biotech
were used to make predictions about the response for given equation is useful for identifying the relative impact of the
levels of each factor. By default, the high levels of the factors factors by comparing the factor coefficients.
are coded as +1 and the low levels are coded as -1. The coded
(a)
(b)
(c)
Figure 2: Three-dimensional response surface graph for lipid content showing the interaction effects of
(A) nitrate and phosphate (B) nitrate and pH (C) phosphate and pH
150Research Journal of Biotechnology Vol. 16 (10) October (2021)
Res. J. Biotech
Lipid Production= 31.06 + 1.40 - 0.7272 + 4.26 - 5.05 + under optimized condition (57.06 % dcw) as shown in fig. 3
05795 + 6.03 - 2.14 + 1.72 - 3.62 which proves the validity of the model. This study
successfully proved the optimization of lipid production in
The three-dimensional response surface plot in fig. 2 shows microalgae by induction of environmental stress (nutrient
the interactions between factor A (nitrate), factor B and pH).
(phosphate) and factor C (pH). Fig. 2A shows the interaction
between factor A and factor B, keeping factor C constant. The past few years have experienced elevated research on
The best lipid production was obtained at 0.11 g ml-1 of this to test the economic viability of microalgae in biodiesel
factor A while different concentrations of factor B produced production18. This study has shown that lipid accumulation
no significant change in the lipid production. Fig. 2B in microalgae highly depends on the concentration of the
indicates the interaction between factor A and factor C nutrients in the growth medium. The total lipid content of
keeping factor B constant. The lipid production was highest Selenastrum sp. was optimized under nitrogen starvation
at pH 9.0 and 0.11 g ml-1 of factor A. Fig. 2C shows the from 16.12 to 48.6 % dcw using RSM9. The total lipid
interaction between factor B and factor C keeping factor A content of Chlorella zofingiensis was found to be higher in a
constant. The best lipid production was at pH 9.0 and 0.015 media with reduced nitrogen and phosphate17. An
g ml-1 of factor B. investigation has also shown that the total lipid content of
Isochrysis galbana increased from 17.2 to 30.6 % dcw under
A validation of the experimental model was conducted by nitrogen starvation49.
performing three repeated experiments. The optimum
conditions for high lipid production obtained from the model In this study, the total lipid content was significantly
were 0.11 g ml-1 KNO3, 0.015 g ml-1 K2HPO4 and pH 9.0. optimized from 28.35 to 57.06 % dcw under a combination
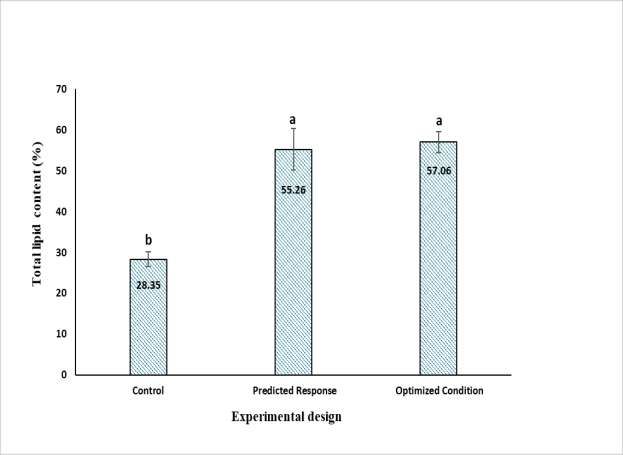
The final optimized lipid content (57.06 % dcw) was of nutrient and pH stress conditions. When microalgae are
compared with the predicted response and the total lipid grown under nutrient deprivation, they are more sensitive to
content under standard condition (control). It was observed environmental conditions and one of the environmental
that there was no significant difference between the factors that influences lipid production in microalgae is the
predicted response (55.26 % dcw) and the total lipid content pH of the medium6,9.
Figure 3: The total lipid content of P. insigne at standard and optimized conditions and
statistically predicted response. Different letters indicate the significant difference between the total lipid content
of each condition with p ≤ 0.05
151Research Journal of Biotechnology Vol. 16 (10) October (2021)
Res. J. Biotech
Fatty acid profile: GCMS generated six peaks a good yield when compared to other studies which yielded
corresponding to different fatty acids from the extracted lipid 78.45 % and 89.65 %22,29. The different biodiesel properties
between retention-time of 15.04 to 39.09 mins, as shown in tested were flash point, kinematic viscosity at 25 °C, density,
table 5. Fatty acids are one of the main constituents of acid value, saponification number and iodine value (Table
microalgal biomass which can be used for production of 6). The flash point was estimated as 98 °C. Flash point
biodiesel. Microalgae produced both saturated and indicates the extent of removal of methanol, hence it
unsaturated fatty acids with 16 and 18 carbon atoms, but determines the purity of the FAME and volatility of the
some species may produce fatty acids of 24 carbon atoms. biodiesel20. The kinematic viscosity at 25 °C was observed
The fatty acid content highly depends on the culture as 3.64 mm2 s-1.
condition where in stress conditions like nutrient limitations
increased the concentration of long chain and highly In diesel engine, kinematic viscosity shows the fuel
saturated-fatty acid7 which was evident from this study. Fatty atomization that influence the fuel combustion. Highly
acids observed in this study include capric acid (C10:0), viscous fuel leads to poor atomization and poor fuel
palmitic acid (C16:0), palmitoleic acid (C16:1), stearic acid combustion32. The density of biodiesel was estimated as 873
(C18:0), oleic acid (C18:1) and gadoleic acid (C20:1). kg m-3. The density of the fuel should be within an
acceptable range for optimal air-to-fuel ratios for complete
A study has shown that nutrient starvation elevated the combustion21. The acid value was estimated as 0.30 mg
production of saturated fatty acids like palmitic acid25 and KOH g-1. Acid value indicates the corrosiveness of the fuel
this study has shown that the percentage of palmitic was the and should be ≤ 0.50 (mg KOH g-1). The saponification
highest among the different fatty acids. The most common value of biodiesel was observed as 237.36 (mg g-1).
fatty acids that can be transesterified include palmitic, Saponification value indicates the purity and checks
stearic, oleic and linoleic acids41. A high percentage of C16 adulteration of the fuel28. Iodine values indicate the level of
and C18 fatty acids is required for a good fuel property40 and unsaturation of oil and value lesser than 120 was
presence of palmitic acid is an important indicator of the recommended for a quality biodiesel and the iodine value of
quality of biodiesel12. High concentration of C16-C18, the biodiesel (35.34 g 100g-1) was in the accepted range.
especially C16 in our study has revealed that P. insigne has From this study, it was observed that all the properties tested
desired fatty acid content comparable with other organisms have met the specifications of IS, ASTM and EN which
studied for biodiesel production. denoted that P. insigne can be successfully used as a
feedstock for the production of quality biodiesel.
Biodiesel yield and properties: The percentage of biodiesel
yield was estimated as 82.41 % which was considered to be
Table 5
The different types of fatty acids generated by GCMS
S.N. Apex Area %Area Height %Height Identification
RT
1 15.04 1871494.61 15.1 771899.994 17.89 Capric Acid (C10:0)
2 26.4 6294791.25 50.78 2157715.045 50.01 Palmitic acid (C16:0)
3 31.3 187261.005 1.51 77394.892 1.79 Palmitoleic acid (C16:1)
4 32.76 591642.063 4.77 213065.372 4.94 Stearic acid (C18:0)
5 35.5 1060024.37 8.55 344656.977 7.99 Oleic acid (C18:1)
6 39.09 2390763.99 19.29 750154.317 17.39 Gadoleic acid (C20:1)
Table 6
The different biodiesel properties compared with international standards
Properties Result IS ASTM EN
(1448) (D6751) (14214)
Flash Point (°C) 98 ≥ 101 ≥ 93 ≥ 101
Kinematic viscosity at 3.64 3.5-5.0 1.9-6.0 3.5-5.0
25°C (mm2/s)
Density (kg/m3) 873 860–900 - 860–900
Acid value (mg KOH/g) 0.30 ≤ 0.50 ≤ 0.50 ≤ 0.50
Saponification number 237.34 - - -
(mg/g)
Iodine value (g/100g) 35.34 ≤ 120 - ≤ 120
152Research Journal of Biotechnology Vol. 16 (10) October (2021)
Res. J. Biotech
Conclusion different concentrations of Fe and CO2, J Eng Sci Technol, 10, 19-
This work represents a successful case of optimizing the 30 (2015)
lipid production from 28.35-57.06 % dcw in P. insigne.
9. Chakravarty S. and Mallick N., Optimization of lipid
Investigations of previous research have shown that no accumulation in an aboriginal green microalga Selenastrum sp.
detailed study on lipid production, optimization and GA66 for biodiesel production, Biomass Bioenerg, 126, 1-13
biodiesel production has been done on P. insigne. Increasing (2019)
lipid production in microalgae is one of the most effective
approaches to enhance the economic feasibility of biodiesel 10. Chisti Y., Biodiesel from microalgae, Biotechnol Adv., 25(3),
derived from microalgae. 294-306 (2007)
A study on the fatty acid profile of the lipid exhibited 11. Chu F.F., Chu P.N, Cai P.J., Li W.W., Lam P.K.S. and Zeng
desirable fatty acids for quality biodiesel production. R.J., Phosphorus plays an important role in enhancing biodiesel
productivity of Chlorella vulgaris under nitrogen deficiency,
Transesterification has resulted in the production of
Bioresour Technol, 134, 341–346 (2013)
biodiesel from the optimized lipid with 82.41 % yield. The
different biodiesel properties tested met IS, ASTM and EN 12. Demirbas A., Studies on cottonseed oil biodiesel prepared in
specifications confirming that P. insigne is a viable non-catalytic SCF conditions, Bioresour Technol, 99, 1125–1130
candidate for biodiesel production. (2008)
Acknowledgement 13. Dineshkumar R., Narendran R. and Sampathkumar P.,
The authors would like to acknowledge the Department of Cultivation and harvesting of micro-algae for bio-fuel Production
– A review, Indian J Mar Sci, 46(09), 1731-1742 (2017)
Biotechnology, School of Sciences, JAIN (deemed-to-be
University), Bangalore, Karnataka, India for providing 14. Fernández-Dacosta C., Shen L., Schakel W., Ramirez A. and
infrastructural support to conduct the research. Kramer G.J., Potential and challenges of low-carbon energy
options: Comparative assessment of alternative fuels for the
References transport sector, Appl Energy, 236, 590–606 (2019)
1. Abdullah B., Muhammad S.A.F.S., Shokravi Z., Ismail S.,
Kassim K.A., Mahmood A.N. and Azize M.M.A., Fourth 15. Fogg G.E., Algal culture and phytoplankton ecology, Madison,
generation biofuel: A review on risks and mitigation strategies, University Wisconsin Press (1965)
Renew Sust Energ Rev, 107, 37–50 (2019)
16. Folch J., Lees M. and Stanley G.H.S., A simple method for the
2. Aratboni H.A., Rafiei N.R., Garcia-Granados R., Alemzadeh A. isolation and purification of total lipids from animal tissues, J Biol
and Morones-Ramírez J.R., Biomass and lipid induction strategies Chem, 226(1), 497-509 (1957)
in microalgae for biofuel production and other applications,
Microb Cell Fact, 18, 1-17 (2019) 17. Ganapathi S., Shetty V. and Mokashi K., Enhanced lipid
productivity approaches in microalgae as an alternate Q1 for fossil
3. Ashrini B.S. and Varalakshmi K.N., Statistical optimization of fuels - A review, J Energ Inst, 2015, 1-5 (2015)
media components by Taguchi Design and Response Surface
Methodology for enhanced production of anticancer metabolite by 18. Goh B.H.H., Ong H.C., Cheah M.Y., Chen W.H., Yuc K.L. and
Penicillium sp. JUFP2, Research J Pharm and Tech, 12(2), 463- Mahlia T.M.I., Sustainability of direct biodiesel synthesis from
471 (2019) microalgae biomass: A critical review, Renew Sust Energ Rev, 107,
59–74 (2019)
4. Bajhaiya A.K. et al, Algal biodiesel: the next generation biofuel
for India, Asian J Exp Biol Sci, 1(4), 728- 739 (2010) 19. Harfoot M.B.J., Tittensor D.P., Knight S., Arnell A.P., Blyth
S., Brooks S., Butchart S.H.M., Hutton J., Jones M.I. and Kapos
5. Bhuyar P., Yusoff M.M., Rahim M.H.A., Sundararaju S., V., Present and future biodiversity risks from fossil fuel
Maniam G.P. and Govindan N., Effect of plant hormones on the exploitation, Conserv Lett, 11, 1-13 (2018)
production of biomass and lipid extraction for biodiesel production
from microalgae Chlorella sp., J Microbiol, Biotechnol Food Sci., 20. Hoekman S.K., Broch A., Robbins C., Ceniceros E. and
9(4), 671-674 (2020) Natarajan M., Review of biodiesel composition, properties and
specifications, Renew Sust Energ Rev, 16, 143–169 (2012)
6. Binnal P. and Babu P.N., Statistical optimization of parameters
affecting lipid productivity of microalga Chlorella protothecoides 21. Ismail S.A.A. and Ali R.F.M., Physico-chemical properties of
cultivated in photobioreactor under nitrogen starvation, S Afr J biodiesel manufactured from waste frying oil using domestic
Chem, 23, 26-37 (2017) adsorbents, Sci Technol Adv Mater, 16(3), 1-9 (2015)
7. Breuer G., Evers W.A., De Vree J.H., Kleinegris D.M., Martens 22. Karmakar R., Rajor A. and Kundu K., Biodiesel Production
D.E., Wijffels R.H. and Lamers P.P., Analysis of fatty acid content from Unused Mixed Culture of Algae, in: Gosh S.K., Eds., Waste
and composition in microalgae, J Vis Exp, http://dx.doi.org/ Valorisation and Recycling, Singapore, Springer, 273-279 (2019)
10.3791/50628, 80 (2013)
23. Khan M.I., Shin J.H. and Kim J.D., The promising future of
8. Carpio R., De Leon R. and Goss M.R.M., Growth, lipid content microalgae: Current status, challenges and optimization of a
and lipid profile of the green alga, Chlorella vulgaris Beij., under
153Research Journal of Biotechnology Vol. 16 (10) October (2021)
Res. J. Biotech
sustainable and renewable industry for biofuels, feed and other economics of global climate stabilization, The Philippines, Asian
products, Microb Cell Fact, 17, 1-13 (2018) Development Bank (2015)
24. Kumar V., Nanda M., Joshi H.C., Singh A., Sharma S. and 37. Rizwan M., Mujtab G., Rashid N. and Lee K., Enhancing lipid
Verma M., Production of biodiesel and bioethanol using algal production of Dunaliella tertiolecta by manipulating the
biomass harvested from fresh water river, Renew Energy, 116, 606- interactive effect of salinity and nitrogen, Chem Biochem Eng Q,
612 (2018) 31(3), 199–207 (2017)
25. Lamers P.P., Janssen M., De Vos R.C.H., Bino R.J. and 38. Roopnarain A., Sym S.D. and Gray V.M., Time of culture
Wijffels R.H., Carotenoid and fatty acid metabolism in nitrogen- harvest affects lipid productivity of nitrogen-starved Isochrysis
starved Dunaliella salina, a unicellular green microalga, J galbana U4 (Isochrysidales, Haptophyta), Aquaculture, 438, 12–
Biotechnol, 162(1), 21-21 (2012) 16 (2015)
26. Liu J., Li Y. and Gerken H., Single-tube colony PCR for DNA 39. Sajjadi B., Chen W.Y., Raman A.A.A. and Ibrahim S.,
amplification and transformant screening of oleaginous Microalgae lipid and biomass for biofuel production: a
microalgae, J Appl Phycol, 26(4), 1719-1726 (2013) comprehensive review on lipid enhancement strategies and their
effects on fatty acid composition, Renew Sust Energ Rev, 97, 200–
27. Mashayekhi M., Sarrafzadeh M., Tavakoli O., Soltani N. and 232 (2018)
Faramarzi M., Potential for biodiesel production and carbon
capturing from Synechococcus elongatus: An isolation and 40. Selvarajan R., Felföldi T., Tauber T., Sanniyasi E., Sibanda T.
evaluation study, Biocatal Agric Biotechnol, 9, 230-235 (2017) and Tekere M., Screening and evaluation of some green algal
strains (Chlorophyceae) isolated from freshwater and soda lakes
28. Mohan S.V., Rohit M.V., Subash G.V., Chandra R., Devi M.P., for Biofuel Production, Energies, 8, 7502-7521 (2015)
Butti S.K. and Rajesh K., Algal oils as biodiesel, in: Pandey A.,
Chang J.S., Soccol C.R., Lee D.J. and Chisti Y., Eds., Biomass, 41. Sharmin T., Hasan C.M.M., Aftabuddin S., Rahman M.A. and
Biofuels and Biochemicals: Biofuels from Algae, Second Edition, Khan M., Growth, fatty acid and lipid composition of marine
Netherlands, Elsevier, 287-323 (2019) microalgae Skeletonema costatum available in Bangladesh coast:
Consideration as biodiesel feedstock, J Mar Sci, 2016, 1-8 (2016)
29. Murthy G.P. and Kumar R., Optimized production of biodiesel
by fresh water algae oils derived from Chlorella wild stuff and 42. Shukla A.K., Sudhakar K. and Baredar P., Renewable energy
performance characteristics of engine system by employing resources in South Asian countries: Challenges, policy and
integration of chemical sciences and engineering technologies, Int recommendations. Resource-Efficient Technologies, 3, 342–346
J Chem Technol, 26, 381-395 (2019) (2017)
30. Paddock M.B., Fernández-Bayo J.D. and VanderGheynst J.S., 43. Singh P., Guldhe A., Kumari S., Rawat I. and Bux F.,
The effect of the microalgae-bacteria microbiome on wastewater Combined metals and EDTA control: An integrated and scalable
treatment and biomass production, Appl Microbiol Biotechnol, lipid enhancement strategy to alleviate biomass constraints in
104, 893-905 (2020) microalgae under nitrogen limited conditions, Energy Convers
Manag, 114,100–109 (2016)
31. Pandey M.K., Dasgupta C.N., Mishra S., Srivastava M., Gupta
V.K., Suseela M.R. and Ramteke P.W., Bioprospecting microalgae 44. Thirugnanasambandham K., Shine K., Aziz H.A. and Gimenes
from natural algal bloom for sustainable biomass and biodiesel M.L., Biodiesel synthesis from waste oil using novel microwave
production, Appl Microbiol Biotechnol, 103, 5447–5458 (2019) technique: Response surface modelling and optimization, Energ
Source Part A, 39(7), 636-642 (2017)
32. Phankosol S. and Krisnangkura K., Estimation kinematic
viscosity of biodiesel produced by ethanolysis, Eng Trans, 18(2), 45. Thirugnanasambandham K. and Sivakumar V., Investigation
103-106 (2015) on biodiesel production from cotton seed oil using microwave
irradiated transesterification process. Environ Prog Sust Energy,
33. Pinto T., Gouveia L., Ortigueira J., Saratale G.D. and Moura 32(4), 1-7 (2015)
P., Enhancement of fermentative hydrogen production from
Spirogyra sp. by increased carbohydrate accumulation and 46. Yadav M., Chavan S.B., Singh R., Bux F. and Sharma Y.C.,
selection of the biomass pretreatment under a biorefinery model, J Experimental study on emissions of algal biodiesel and its blends
Biosci Bioeng, 126(2), 226-234 (2018) on a diesel engine, J Taiwan Inst Chem Eng, 96, 160-168 (2019)
34. Qiu R., Gao S., Lopez P.A. and Ogden K.L., Effects of pH on 47. Yang L., Chen J., Qin S., Zeng M., Jiang Y., Hu L., Xiao P.,
cell growth, lipid production and CO2 addition of microalgae Hao W., Hu Z. and Lei A., Growth and lipid accumulation by
Chlorella sorokiniana, Algal Res, 28, 192–199 (2017) different nutrients in the microalga Chlamydomonas reinhardtii,
Biotechnol Biofuels, 11, 1-12 (2018)
35. Raissi S. and Farsani R.E., Statistical process optimization
through Multi-Response Surface Methodology, Int J Math Comput 48. Yodsuwan N., Sawayama S. and Sirisansaneeyakul S., Effect
Sci, 3(3), 197-201 (2009) of nitrogen concentration on growth, lipid production and fatty acid
profiles of the marine diatom Phaeodactylum tricornutum, Agric
36. Raitzer D.A., Bosello F., Tavoni M., Orecchia C., Marangoni Nat Resour, 51(3), 190-197 (2017)
G., Jindra G.N. and Samson J.N.G., Southeast Asia and the
154Research Journal of Biotechnology Vol. 16 (10) October (2021)
Res. J. Biotech
49. Zarrinmehr M.J., Farhadian O., Heyrati F.P., Keramat J., 50. Zou S., Fei C., Song J., Bao Y., He M. and Wang C.,
Koutra E., Kornaros M. and Daneshvar E., Effect of nitrogen Combining and comparing coalescent distance and character-based
concentration on the growth rate and biochemical composition of approaches for barcoding microalgaes: a test with chlorella-like
the microalga, Isochrysis galbana, Egypt J Aquat Res, 46(2), 153- species (Chlorophyta), PLoS One, 11(4), 1-24 (2016).
158 (2019)
(Received 27th November 2020, accepted 30th January 2021)
155You can also read