The Tube over Time: Characterizing Popularity Growth of YouTube Videos
←
→
Page content transcription
If your browser does not render page correctly, please read the page content below
The Tube over Time: Characterizing
                               Popularity Growth of YouTube Videos

                              Flavio Figueiredo Fabrício Benevenuto Jussara M. Almeida
                                          {flaviov, fabricio, jussara}@dcc.ufmg.br
                                                    Universidade Federal de Minas Gerais (UFMG)
                                                               Belo Horizonte - Brazil

ABSTRACT                                                                             Keywords
Understanding content popularity growth is of great impor-                           YouTube, video popularity, popularity growth, referrer
tance to Internet service providers, content creators and on-
line marketers. In this work, we characterize the growth
patterns of video popularity on the currently most popular
                                                                                     1.     INTRODUCTION
video sharing application, namely YouTube. Using newly                                  Understanding content popularity growth on the Internet
provided data by the application, we analyze how the pop-                            is of great relevance to a broad range of services, from tech-
ularity of individual videos evolves since the video’s upload                        nological, economical and social perspectives. Such under-
time. Moreover, addressing a key aspect that has been                                standing can drive the design of cost-effective caching and
mostly overlooked by previous work, we characterize the                              content distribution mechanisms as well as uncover poten-
types of the referrers that most often attracted users to                            tial bottlenecks in system components such as search en-
each video, aiming at shedding some light into the mech-                             gines [6]. Moreover, predicting popularity is also important
anisms (e.g., searching or external linking) that often drive                        not only for supporting online and viral marketing strategies
users towards a video, and thus contribute to popularity                             as well as effective information services (e.g., content recom-
growth. Our analyses are performed separately for three                              mendation and searching services) [12] but also because it
video datasets, namely, videos that appear in the YouTube                            may uncover new (online and offline) business opportunities.
top lists, videos removed from the system due to copy-                               From a sociological point of view, a deep study of popular-
right violation, and videos selected according to random                             ity evolution may also reveal properties and rules governing
queries submitted to YouTube’s search engine. Our results                            collective user behavior [10].
show that popularity growth patterns depend on the video                                Online Social Networks (OSNs) are currently a major
dataset. In particular, copyright protected videos tend to                           segment of the Internet. Considering video sharing OSNs,
get most of their views much earlier in their lifetimes, of-                         YouTube1 is the one with the largest number of registered
ten exhibiting a popularity growth characterized by a viral                          users [1], who upload and share their videos at a stagger-
epidemic-like propagation process. In contrast, videos in the                        ing rate. Indeed, it has been reported that the amount of
top lists tend to experience sudden significant bursts of pop-                       content uploaded to YouTube in 60 days is equivalent to
ularity. We also show that not only search but also other                            the content that would have been broadcasted for 60 years,
YouTube internal mechanisms play important roles to at-                              without interruption, by NBC, CBS and ABC altogether [2].
tract users to videos in all three datasets.                                         Moreover, YouTube has reportedly served over 100 million
                                                                                     users only on January 2009 [1], with a video upload rate
                                                                                     equivalent to 10 hours per minute 2 . At such unprecedented
Categories and Subject Descriptors                                                   user and content growth rates, understanding video popular-
C.4 [Computer Systems Organization]: Performance                                     ity on YouTube becomes a challenge of utmost importance,
of Systems—Measurement techniques; H.3.5 [Information                                as the myriad of different contents make user behavior and
Storage and Retrieval]: Online Information Services—                                 attention span highly variable and unpredictable [6].
Web-based services                                                                      As argued by Willinger et al. [20], most previous anal-
                                                                                     yses of OSNs have treated such systems as static. Most of
                                                                                     them focus on analyzing structural properties of single snap-
General Terms                                                                        shots of relationship networks (e.g., friendship network) that
Human Factors, Measurement                                                           emerge in such systems [3, 5, 15]. However, since OSNs are
                                                                                     inherently dynamic, these studies fail to address key prop-
                                                                                     erties of the underlying system dynamics. Regarding one
                                                                                     such property, namely popularity, a few studies have ana-
Permission to make digital or hard copies of all or part of this work for            lyzed YouTube with respect to video popularity characteris-
personal or classroom use is granted without fee provided that copies are            tics [6, 9, 10] and prediction [14, 19]. However, most of them,
not made or distributed for profit or commercial advantage and that copies           despite covering a rich set of popularity properties and their
bear this notice and the full citation on the first page. To copy otherwise, to
republish, to post on servers or to redistribute to lists, requires prior specific
                                                                                     implications for system design, focused on only a single or
permission and/or a fee.                                                             1
WSDM’11, February 9–12, 2011, Hong Kong, China.                                          http://www.youtube.com
                                                                                     2
Copyright 2011 ACM 978-1-4503-0493-1/11/02 ...$10.00.                                    http://www.youtube.com/t/fact_sheet
at most on a few snapshots of the system, and thus do not Gill et al. [11] characterized the YouTube traffic collected
deeply analyze the long-term popularity growth patterns for at the University of Calgary campus network, comparing
individual videos [6, 11]. To the best of our knowledge, the its properties with those previously reported for Web and
only long-range studies of popularity evolutionary patterns streaming media workloads. In particular, they analyzed
at the granularity of individual videos focus mainly on de- daily and weekly patterns as well as several video character-
signing popularity prediction models [10, 19], lacking a dis- istics such as duration, bit rate, age, ratings, and category.
cussion on possible sources of video popularity, that is, on Zink et al. [21] also characterized the traffic collected from a
mechanisms that attract users to the videos. university campus. Based on trace-driven simulations, they
In this paper, we analyze popularity growth patterns of showed that client-based local caching, P2P-based distribu-
YouTube videos with two main goals. First, we intend to tion, and proxy caching can reduce network traffic signifi-
analyze how the popularity of individual videos evolves over cantly, allowing faster access to videos.
time, covering the whole period since the video was uploaded In common, these studies provide important insights into
to the system. Second, shedding some light into an aspect content popularity and traffic caused by video sharing ser-
of popularity that has been mostly overlooked, we aim to vices. However, they only focused on either a single and
investigate how users reach each given video (e.g., by search- static snapshot of the videos and of the traffic generated to
ing on YouTube or following a link in another website), as them [11, 21] or on at most a few snapshots [6]. Thus, they
a means to understand which mechanisms contribute to a did not analyze the long-term popularity growth of videos.
video’s popularity. Thus, our work is complementary to all A few recent efforts have looked at the time component
previous analyses of YouTube video popularity. of video popularity [10, 19]. Crane and Sornette proposed
Towards our goals, we crawled YouTube, collecting a new epidemic models to understand how a popularity burst can
set of statistics available in the system, which provide, for be explained in terms of a combination of endogenous user
each video: (a) its popularity (according to different metrics) interactions and external events [10]. They distinguished
as a function of time, and (b) a set of referrers, that is, links four different evolution patterns, which are further discussed
used by users to access the video, along with the number of in Section 4.3. Szabo and Huberman presented a method for
views for which each referrer is responsible. Given the great predicting popularity of YouTube and Digg3 content from
diversity of content on YouTube and the multitude of fac- early measurements of user accesses [19]. More recently,
tors that may impact video popularity, we collected data for Lerman and Hogg [14] developed stochastic user behavior
three different datasets, namely, (a) popular videos that ap- models to predict popularity based on early user reactions to
pear on the world-wide top lists maintained by YouTube; (b) new content. They improved on predictions based on simple
videos that were removed from the system due to copyright extrapolations from early votes by incorporating aspects of
violation; and, (c) videos sampled according to a random the web site design, validating their approach on Digg.
procedure (i.e., random queries). For each collected dataset, Another interesting work on popularity evolution in so-
and for different video classes defined according to their ages cial media was performed by Ratkiewicz et al. [17]. By an-
in the system, we characterized popularity growth patterns, alyzing traffic logs and data from Google Trends4 , the au-
correlating popularity with different types of referrers which thors investigated how external events, captured by search
caught user attention. volume on Google Trends and local browsing (i.e., univer-
We believe the present work provides valuable insights for sity/community traffic), affect the popularity of Wikipedia
Internet service and content providers, who can improve the articles. Although this work, and the aforementioned ef-
effectiveness of several services, including caching, content forts, provide some insights into the long term evolution of
delivery networks, searching and content recommendation, content popularity, there is still little knowledge about what
by leveraging in these systems not only information on the kinds of different external events (e.g., being featured on
amount of views a video receives, but also external sources of the front page) and system mechanisms (e.g., search) con-
influence on popularity. They can also help content creators tribute the most to popularity growth. Thus, our analyses
and online marketers to better understand what makes a and findings, performed separately for YouTube videos with
video popular, driving their future actions. different characteristics, greatly build on previous efforts,
The rest of this paper is organized as follows. Section 2 shedding more light into the complex task of understanding
briefly discusses related work. Our data collection method- content popularity on OSNs.
ology is described in Section 3, whereas our main results are
presented in Sections 4 and 5. Section 6 concludes the paper
and offers some directions for future work.
3. MEASUREMENT METHODOLOGY
Since we intend to study video popularity growth on
YouTube, we need to collect (a) video popularity as a func-
2. RELATED WORK tion of time, and (b) video referrers, i.e., the links that users
There have been a few studies that address content popu- used to access the videos. In this section, we first introduce
larity on OSNs, and, particularly, on video sharing systems. a new set of YouTube statistics that provide both types of
Cha et al. [6] presented an in-depth study of two video shar- information. We then describe our data collection method-
ing systems. They analyzed popularity distribution, popu- ology as well as the limitations of the collected data.
larity evolution and content characteristics of YouTube and
of a popular Korean video sharing service, and investigated 3.1 YouTube Statistics
mechanisms to improve video distribution, such as caching Recently, YouTube has launched a statistics feature that
and Peer-to-Peer (P2P) distribution schemes. Additionally, provides a unique opportunity to study video popularity.
they presented the first evidence of the existence of dupli-
3
cates in user generated content, discussing potential prob- http://www.digg.com
4
lems they may cause to the system. http://trends.google.comGiven the diversity of video types on YouTube and the
various factors that may influence video popularity, we an-
alyze three different video sets:
Top: YouTube maintains several top lists (e.g., most viewed
and most commented videos) as a means to help users find-
ing popular content and new trends. Each top list contains
one hundred videos. YouTube provides per country and
world-wide top lists, and allows users to browse them in
different time scales, i.e., top of the day, week, month, and
top of all time. We created our Top dataset by collecting all
the world-wide top lists available on YouTube, gathering a
total of 27,212 unique videos.
YouTomb: A second group of interesting videos to be stud-
ied is the copyright protected videos. YouTube users may
inadvertently or even maliciously introduce in the system
unauthorized copies of videos that are protected by the copy-
right owner’s exclusive rights. To our knowledge, there is no
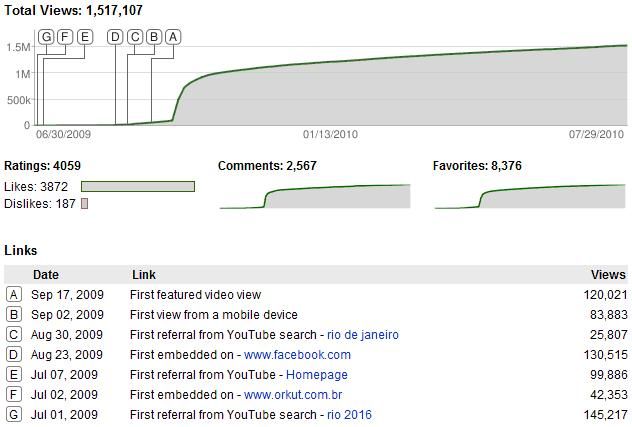
Figure 1: Example of YouTube statistics. previous study on how people find and disseminate these
videos. Recently, an MIT project, called YouTomb, started
to monitor a large amount of YouTube videos. They reg-
Figure 1 shows an example of such statistics for the video ister in a public database the identifiers of all monitored
theme of the 2016 Olympic Games. There are two sets of videos that are removed from YouTube, along with the rea-
valuable information: (1) the cumulative distributions of son for which they were removed. We used the YouTomb
popularity as a function of time for three popularity met- database in order to obtain videos that had been removed
rics, namely, number of views, number of comments, and from YouTube due to copyright violation. Surprisingly, we
number of users that marked the video as favorite; and, (2) found that we were still able to collect the popularity statis-
a list of important referrers that led users to the video con- tics of such videos. Using the video identifiers provided
taining, for each referrer, the number of views for which it is by the YouTomb database, we collected a total of 120,862
responsible and the date it was first used to reach the video. videos that had been removed from YouTube due to copy-
Figure 1 shows that the cumulative growth of the num- right violation.
ber of views experienced by the video presents three clear Random topics: As basis for comparison, we also want
distinct phases. Initially, the video stays dormant and to study popularity growth of a random sample of YouTube
unattractive to most YouTube users. The first registered videos. Ideally, we would like to have at our disposal the
referrer is related to the search for the query rio 2016 (re- complete set of YouTube videos in order to select a random
ferrer G). Moreover, before being indexed and available on sample of them. Unfortunately, YouTube does not provide
search results for the query rio de janeiro (referrer C), the a means to systematically collect all the videos and neither
video first appeared in online social network sites such as a random sample of them. Instead, we designed a sampling
Orkut5 and Facebook6 (referrers D and F). Finally, still in procedure that is based on random topics. First we selected
a dormant phase, the video was featured on the first page 30,000 entities (i.e., words and proper names) from the Yago
of YouTube (referrer A), becoming quickly very popular. lexical ontology [18]. We then used the YouTube search API
Shortly afterwards, popularity growth rate changed once to retrieve the first result on each selected entity. In total,
again, remaining very slow through the rest of the curve. we collected 24,484 unique videos using this strategy.
We here analyze YouTube video popularity by exploiting For each dataset, our crawler was executed in a single
the set of statistics shown in Figure 1. Next, we describe our day on April 2010. Throughout this paper, we refer to our
collection methodology as well as the set of collected videos datasets as Top, YouTomb and Random9 .
used in our analyses.
3.3 Collected Datasets
3.2 Data Collection Methodology We processed our collected datasets to remove: (1) videos
The graph shown in Figure 1 was plotted by YouTube with missing or inconsistent information; and, (2) very re-
using the Google charts API7 . For each popularity metric cent videos (i.e., uploaded on the same day of our crawling).
(number of views, number of comments and number of fa- Table 1 provides a summary of each cleaned video datasets,
vorites), YouTube requests the Google charts API, provid- presenting the total and average numbers of views as well
ing on the requested URL one hundred pairs of (x,y) values as the average video age. Video age, measured in number of
used to plot the graphs. For each collected video, we gath- days, is defined as the difference between the crawling date
ered these (x,y) values by collecting the URL requested by (or the removal date, for videos in the YouTomb dataset)
YouTube. In addition to the popularity growth curves, we and the upload date. We note that, YouTomb videos are on
also collected all the referrers listed by YouTube 8 . average older than videos in the Top and Random datasets.
Moreover, Top videos are, as expected, more popular, on
5
http://www.orkut.com average, than videos in the other two datasets, whereas
6
http://www.facebook.com
7 9
http://code.google.com/apis/chart/ Even though we use the term Random, we are not claim-
8
Visit http://vod.dcc.ufmg.br/traces/youtime/ for in- ing to have a truly random sample of YouTube videos, but
formation on data availability. rather a sample of videos on random topics.Prob. (Fraction of days since upload ≤ f)
Prob. (Fraction of days since upload ≤ f)
Prob. (Fraction of days since upload ≤ f)
1.0 1.0 1.0
0.8 0.8 0.8
0.6 0.6 0.6
0.4 0.4 0.4
≥ 10% of total views
0.2 0.2 0.2
≥ 50% of total views
≥ 90% of total views
0.0 0.0 0.0
0.0 0.2 0.4 0.6 0.8 1.0 0.0 0.2 0.4 0.6 0.8 1.0 0.0 0.2 0.4 0.6 0.8 1.0
Fraction of days since upload - f Fraction of days since upload - f Fraction of days since upload - f
(a) Top (b) YouTomb (c) Random
Figure 2: Cumulative distributions of time until video achieves at least 10%, 50% and 90% of its total views
(time normalized by video’s lifetime).
Table 1: Crawled datasets. Table 2: Number of videos across age (a) ranges.
Video Datasets Top YouTomb Random Top YouTomb Random
# Videos 17,127 73,257 18,095 a ≤ 7 days 4,609 112 136
Avg # of views/videos 843,001 279,486 126,056 7 days < a ≤ 1 month 4,344 14,553 7,649
Average age (# days) 136 627 493 1 month < a ≤ 1 year 6,093 249 515
a > 1 year 2,081 58,343 9,795
YouTomb videos tend also to attract more views than videos We note that, as shown in Table 2, the ages of the videos in
in the Random dataset (on average). each dataset vary significantly. Most videos in the YouTomb
Although this data gives us a unique opportunity to ex- and Random datasets are either around a few weeks (under
amine video popularity growth, it has some limitations. 1 month) old or over 1 year old. In contrast, most Top videos
Each popularity growth curve is registered with at most 100 have shorter ages (under 1 year old). Given such variability,
points, regardless of the age of the video. In order to be we have performed our popularity analyses separately for
able to estimate video popularity on a daily basis, we per- each age range, in each dataset. However, due to space
formed linear interpolation between the 100 points provided constraints, we focus on results computed over all videos in
for each video. Another limitation is that YouTube does each dataset, pointing out significant differences across age
not provide information on every link which led users to the ranges when appropriate.
videos, providing only information on the top ten referrers.
In total, 64%, 75%, and 65% of views of the videos in the 4.1 How Early Does a Video Get Popular?
Top, YouTomb, and Random datasets, respectively, do not We address this question by plotting, in Figure 2, the
have the referrer registered. cumulative distributions of the amount of time it takes for
a video to receive at least 10%, at least 50% and at least
90% of their total views, measured at the time our data was
4. POPULARITY GROWTH PATTERNS collected. Time is shown normalized by the age of the video,
In this section, we analyze the popularity growth patterns which is here referred to as the video’s lifetime.
across our three video datasets, namely Top, YouTomb and Figure 2 shows that, for half of the videos (y-axis) in the
Random. This analysis is based on two aspects, namely, (1) Top, YouTomb and Random datasets, it takes at most 65%,
the time interval until a video reaches most of its current 21% and 87%, respectively, of their total lifetimes (x-axis)
popularity (measured according to one of the three metrics), until they receive at least 90% of their total views. If we
and (2) the bursts of popularity experienced by a video in consider at least 50% of their total views, the fractions are
short periods of times (e.g., days or weeks). Inspired by 26%, 5% and 43%, respectively, following a similar trend.
results in [9,10], we also categorize videos according to their The same holds for the mark of 10% of the views.
temporal popularity evolution dynamics. Conversely, around 31% of Top videos take at least 20%
We focus our analyses on the number of views as the main of their lifetimes to reach at least 10% of their final pop-
popularity metric because: (1) previous analyses of YouTube ularity. Similarly, around 18% of the Random videos also
have found a large correlation between total number of com- experience a similar dormant period before starting to re-
ments (or favorites) and total view count [8], and (2) we have ceive most of their views. In contrast, the equivalent fraction
computed the correlations for both pairs of metrics, taken at among YouTomb videos is much shorter, around 10%.
each point in time (instead of only for the final snapshot, as Thus, comparing the results across datasets, YouTomb
previously done), finding positive correlations, ranging from videos tend to get most of its views earlier in their lifetimes,
0.18 to 0.24, for all datasets. followed by videos in Top and Random. As videos in theProb. (Fraction of views ≤ f) 1.0 1.0 1.0
Prob. (Fraction of views ≤ f)
Prob. (Fraction of views ≤ f)
0.8 0.8 0.8
0.6 0.6 0.6
0.4 0.4 0.4
rd rd
3 peak day 3 peak day 3rd peak day
0.2 0.2 0.2
2nd peak day 2nd peak day 2nd peak day
Peak day Peak day Peak day
0.0 0.0 0.0
0.0 0.2 0.4 0.6 0.8 1.0 0.0 0.2 0.4 0.6 0.8 1.0 0.0 0.2 0.4 0.6 0.8 1.0
Fraction of views on peak day - f Fraction of views on peak day - f Fraction of views on peak day - f
(a) Top (b) YouTomb (c) Random
Figure 3: Cumulative distributions of the fraction of total views on the first, second and third peak day.
1.0 1.0 1.0
Prob. (Fraction of views ≤ f)
Prob. (Fraction of views ≤ f)
Prob. (Fraction of views ≤ f)
0.8 0.8 0.8
0.6 0.6 0.6
0.4 0.4 0.4
3rd peak week 3rd peak week 3rd peak week
0.2 0.2 0.2
2nd peak week 2nd peak week 2nd peak week
Peak week Peak week Peak week
0.0 0.0 0.0
0.0 0.2 0.4 0.6 0.8 1.0 0.0 0.2 0.4 0.6 0.8 1.0 0.0 0.2 0.4 0.6 0.8 1.0
Fraction of views on peak week - f Fraction of views on peak week - f Fraction of views on peak week - f
(a) Top (b) YouTomb (c) Random
Figure 4: Cumulative distributions of the fraction of total views on the first, second and third peak week.
around 79% of them have at least 1 year of age. This bias
Table 3: Time until a video achieves at least 90% may influence the results. However, we also note that 54%
of its total views, across age (a) ranges (time nor- of the videos in the Random dataset also fall into the same
malized by video’s lifetime, mean µ, and standard age range. Yet, in comparison with YouTomb videos, videos
deviation σ). in the Random dataset get most of their views much later
Top YouTomb Random during their lifetimes.
µ σ µ σ µ σ Thus, to reduce any bias caused by age differences, we re-
peat our analyses separately for videos in each age range.
a ≤ 7 days .64 .10 .61 .14 .61 .17 Due to space constraints, we show, in Table 3, only re-
7 days < a ≤ 1 month .55 .19 .48 .23 .66 .20 sults for the time until a video achieves at least 90% of its
1 month < a ≤ 1 year .50 .27 .18 .21 .79 .17 views. We show averages and standard deviations for each
a > 1 year .77 .23 .31 .23 .85 .11 age range and dataset. The same aforementioned trend oc-
curs for videos in most age ranges: YouTomb videos reach
at least 90% of their views much earlier in their lifetimes
Top videos, followed, somewhat behind, by Random videos.
top lists tend to be more popular, the difference between The only exception occurs for the youngest videos, for which
the results for Top and Random datasets are somewhat pre- there is no much difference across the datasets.
dictable. Possible reasons as to why YouTomb videos tend
to receive most of their views even earlier are: (1) as many
of these videos consist of popular TV shows and music trail- 4.2 Do Videos Experience Popularity Bursts?
ers, a natural interest on this content closer to when it is We now investigate the bursts of popularity experienced
uploaded is expected, and (2) being aware that such videos by the videos. We start by analyzing the cumulative dis-
contain copyright protected content, users may seek them tributions of the fraction of views each video receives on its
quicker after upload, before the violation is detected and first, second and third most popular (i.e., peak) days, shown
they are removed from YouTube. in Figure 3.
We note that since lifetime is a normalized metric, these Figure 3-a) shows that Top videos experience a very dis-
results may be impacted by the distributions of video ages tinct (first) peak day: 50% of them receive between 33%
(Table 2). In particular, recall that such distribution and practically 100% of their views on a single (peak) day.
is skewed towards older videos in the YouTomb dataset: In comparison, the fraction of videos receive between 17%Table 4: Fractions of Memoryless and Unknown videos.
Time Top YouTomb Random
Granularity Total Memoryless Unknown Total Memoryless Unknown Total Memoryless Unknown
Daily 33% 20% 13% 98% 97% 1% 78% 77% 1%
Weekly 60% 0% 60% 14% 13% 1% 4% 0% 4%
and 50% of their views on the second peak day, and be- received on the most popular (i.e., peak) day. They found
tween 5% and 34% of their views on their third peak day. that the aforementioned evolution patterns and the number
Thus, Top videos clearly experience a burst of popularity on of views on the peak day are strongly correlated. Thus, more
a single peak day. This is in sharp contrast with videos in formally, the category of a video can be determined by:
the YouTomb and Random datasets (Figures 3-b and c), for
which the fractions of views on the three peak days tend to
be more similar. In fact, in both datasets, the three curves Viral −→ viewspeak ≤ t (1)
are very close to each other and skewed towards smaller Quality −→ t < viewspeak ≤ (1 − t) (2)
fractions of views. While these results might imply different Junk −→ viewspeak > (1 − t) (3)
popularity growth patterns, with most videos in Random
and YouTomb exhibiting multiple (smaller) daily peaks, we where t is the fraction of views on the peak day. Based on
should also note that the interpolation performed over the empirical evaluation, the authors used t=20%
collected data (see Section 3.3) might introduce distortions We here apply the ideas presented in [9, 10] to categorize
in this analysis, particularly considering the large fraction the videos of our three datasets into the 4 classes: Memory-
of very old videos in these two datasets. less, Viral, Quality and Junk. As in the previous section, to
To cope with these possible distortions, we also analyze cope with possible spurious effects of the data interpolation
the distributions of the fraction of views on the first, second performed, we analyze the evolutionary patterns both at
and third peak weeks, shown in Figure 4. Interestingly, we daily and weekly time granularities. The analysis presented
now observe that all three types of videos tend to experience here extends the discussion of the previous section: whereas
some burst of popularity on a single week. Nevertheless, in Section 4.2 we analyzed popularity based on three differ-
the general trend is similar to the one observed for daily ent points in time, we here characterize its complete time
peaks: the peak week tends to be more significant for Top series.
videos. For instance, 60% of Top videos receive at least To identify videos falling into the Memoryless category,
50% of their views on their (first) peak week. In contrast, we used the Chi-Square test to determine whether the time
only 40% of YouTomb videos receive at least as many views series describing the popularity growth of each video (con-
on a single week. The peak week is even less significant sidering both time granularities) follows a Poisson process.
for videos in the Random dataset, although, in comparison Unfortunately, for several (recently uploaded) videos, the
with daily peaks (Figure 3-c), it is more clearly distinguished corresponding time series had very few points, subjecting
from the other two peaks. Similar conclusions, for weekly the characterization to too much noise. We experimented
and daily popularity peaks, hold for videos falling in different with several thresholds for the minimum number of data
age ranges. points, selecting a threshold equal to 4, as larger values had
little impact on the number of videos characterized as Mem-
4.3 Temporal Dynamics oryless.
Table 4 shows, for each dataset and time granularity, the
As discussed in Section 2, Crane and Sornette [9, 10]
fraction of videos characterized as Memoryless, the frac-
proposed epidemic models to understand how popularity
tion of videos for which the number of points fell below the
growth patterns can be explained in terms of user inter-
threshold, thus being characterized as Unknown, as well as
actions within the system and external events. They distin-
the total fraction of videos in both groups. As expected, the
guish four different evolution patterns. For the vast majority
fractions vary significantly depending on the time granular-
of videos, popularity dynamics are quite stable, either expe-
ity used10 . Note the large fraction of Top videos character-
riencing little activity or being well described by a simple
ized as Unknown for the weekly based analysis, which is due
stochastic process (e.g., a Poisson process). We here re-
to the large number of videos with age below 4 weeks.
fer to such videos as Memoryless. In contrast, some videos
Recall that, in Section 4.2, we concluded that videos in
experience bursts of activity (i.e., popularity), and can be
both Random and YouTomb datasets tend to have mul-
further categorized into: (1) Viral videos, which experience
tiple (smaller) daily popularity peaks, whereas most Top
precursory word-of-mouth growth resulting from epidemic-
videos exhibit a single more significant peak at both daily
like propagation through OSNs; (2) Quality videos, which
and weekly granularities. The results in Table 4, covering
experience a very sudden burst of popularity (due to some
the whole time series, are supported by and extend those
external event, such as being featured on the first page of
findings. Taken at the granularity of days, the vast major-
YouTube); and, (3) Junk videos, which experience a burst
ity of videos in YouTomb (97%) and Random (77%) experi-
of popularity for some reason (e.g., spam, chance, etc), but
ence a popularity growth that follows a Memoryless (Pois-
do not spread through the social network.
The authors also proposed a simpler intuition to cate- 10
We experimented with other time granularities ranging
gorize videos that experience bursts of popularity, which from 1 to 30 days, finding similar results for all granular-
consists of grouping videos based on the fraction of views ities above 5 days.1.0 1.0 1.0
Viral Viral Viral
Quality Quality Quality
0.8 0.8 0.8
Junk Junk Junk
Fraction of Videos
Fraction of Videos
Fraction of Videos
0.6 0.6 0.6
0.4 0.4 0.4
0.2 0.2 0.2
0.0 0.0 0.0
5 10 15 20 25 30 35 40 45 50 5 10 15 20 25 30 35 40 45 50 5 10 15 20 25 30 35 40 45 50
Class Threshold - t (%) Class Threshold - t (%) Class Threshold - t (%)
(a) Top (Daily) (b) YouTomb (Weekly) (c) Random (Weekly)
Figure 5: Fractions of Quality, Viral and Junk videos.
son) process, with no distinct underlying growth pattern. smaller, even for larger thresholds, in the Random dataset,
As discussed in [10], the popularity evolution of such videos possibly due to the much less significant popularity peaks
is largely driven by fluctuations and not bursts of activity. experienced by these videos (Section 4.2).
Note that no video in Random was characterized as Mem- We finish this section by noting that the large fraction
oryless at the granularity of weeks, meaning that, in spite of videos that could not be characterized (i.e., Unknown)
of the somewhat smaller gap between the curves shown in because of their small age in the system motivates the design
Figure 4-c), the complete time series does exhibit a distinct of new models for popularity growth. Such models may
growth process. exploit, for instance, the results presented in Section 4.1 to
Next, we use Equations (1), (2) and (3) to characterize the estimate how long video popularity stays dormant. In the
remaining videos into Quality, Viral and Junk, respectively. next section we extend our analysis, focused so far only on
We experimented with various values for class threshold t. temporal data, to investigate how users reach the videos.
Figure 5 shows the fractions of videos in each category for
various values of t. We report results for Top videos accord-
ing to their daily time series, and for videos in the YouTomb 5. REFERRER ANALYSIS
and Random datasets according to their weekly time series. A number of studies have analyzed the dynamics of word-
We here focus on such results because, for the other scenar- of-mouth-like information propagation through friends in so-
ios, the Memoryless and Unknown categories dominate in cial networks [4, 7, 13]. However, on YouTube, as well as on
all three datasets (Table 4). Nevertheless, we note that, for several other OSNs, word-of-mouth is not the only mecha-
any given dataset, similar qualitative results are obtained nism through which information is disseminated. We next
for the omitted time granularity. We also note that we did address this issue by examining the main referrers that lead
implement the full model and clustering analysis proposed users to videos.
in [10], obtaining similar qualitative results (also omitted).
As shown in Figure 5, most (non-Memoryless) videos in 5.1 Referrer’s Importance
the Random and YouTomb datasets fall into the Viral cat-
As a first step, we identified 14 types of referrers that ap-
egory for thresholds that are not very restrictive (t>15%).
pear in our datasets, grouping them into the following cate-
For instance, for t=20%, the fractions of Viral videos in the
gories: External, Featured, Search, Internal, Mobile, Social,
Random and YouTomb datasets are 77% and 44%, respec-
and Viral. The External category represents websites (often
tively. The time series of such videos show a slight increase
other OSNs and blogs) that have links to YouTube videos.
in the number of views up to a peak day, representing an
The Featured category contains referrers that come from ad-
endogenous (word-of-mouth) growth. After the peak, the
vertises about the video in other YouTube pages or featured
videos propagate virally through the OSN.
videos on top lists and on the front page. On the Search cat-
In contrast, the Top dataset, analyzed at the granularity
egory, we group all the referrers from search engines, which
of days, is dominated by Quality videos, except for thresh-
comprise only Google services. Internal referrers correspond
olds that are very restrictive for this category (t≥35%).
to other YouTube mechanisms, such as the “Related Video”
Indeed, for t=20%, 54% of the Top videos are character-
feature, which displays a list of 20 videos that are considered
ized as Quality. Such videos experience a sudden burst of
related (according to a YouTube proprietary algorithm) to
popularity but remain attractive for some time afterwards.
the watched video. Mobile corresponds to all video accesses
For most threshold values, Quality is also the second most
that come from mobile devices. Social referrers consist of ac-
frequent category in both Random and YouTomb datasets,
cesses coming from the page of the video owner (the channel
whereas Viral is the second most frequent category among
page) or from users who subscribed to the owner or to some
Top videos. We note that a small but non-negligible fraction
specific topic. Finally, YouTube groups referrers from emails
of videos in each dataset are characterized as Junk, partic-
and other sources into a single category, named Viral11 .
ularly for larger threshold values. Such videos, in spite of
the sudden popularity burst, do not remain popular for very 11
long. We note that the fraction of Junk videos is much This type of referrer is not associated with the Viral pop-
ularity growth model presented in Section 4.3.Top YouTomb Random
Category Referrer Type
tview fview ftime tview fview ftime tview fview ftime
First embedded view
EXTERNAL First embedded on 0.57 0.11 0.35 0.81 0.16 0.41 0.07 0.08 0.22
First referrer from
First view from ad
FEATURED 0.72 0.14 0.03 0.10 0.02 0.00 0.11 0.14 0.00
First featured video view
First referrer from YouTube
INTERNAL 1.50 0.29 0.67 1.85 0.36 0.65 0.14 0.18 0.34
First referrer from Related Video
MOBILE First view from a mobile device 0.26 0.05 0.51 0.02 0.00 0.02 0.03 0.03 0.05
First referrer from Google
SEARCH First referrer from YouTube search 1.05 0.20 0.36 1.80 0.35 0.52 0.29 0.37 0.41
First referrer from Google Video
First referrer from a subscriber
SOCIAL 0.36 0.07 0.35 0.01 0.00 0.01 0.01 0.00 0.12
First view on a channel page
VIRAL Other / Viral 0.81 0.16 0.79 0.59 0.12 0.62 0.16 0.20 0.55
9
Table 5: Referrer categories and statistics (tview : number of views (x 10 ); fview : the fraction of views; ftime :
fraction of times a referrer from the given category was the first referrer of a video).
1.0 1.0 1.0
91th Percentile 91th Percentile 91th Percentile
Mean Mean Mean
0.8 9th Percentile 0.8 9th Percentile 0.8 9th Percentile
Fraction of Views
Fraction of Views
Fraction of Views
0.6 0.6 0.6
0.4 0.4 0.4
0.2 0.2 0.2
0.0 0.0 0.0
EXT. FEAT. INT. MOB.SEAR. SOC. VIRAL EXT. FEAT. INT. MOB.SEAR. SOC. VIRAL EXT. FEAT. INT. MOB.SEAR. SOC. VIRAL
Referrer Category Referrer Category Referrer Category
(a) Top (b) YouTomb (c) Random
Figure 6: Distribution of the fraction of views for which each referrer category is responsible.
Table 5 displays the list of the 14 types of referrers and 7 systematically exposed to users as videos from top lists are.
referrer categories, showing the number and fraction of views We also note the importance of the Viral referrer category
for which each category is responsible. These fractions as in all three datasets, particularly Random.
well as the following analyses are based on the video accesses We further analyze the importance of each referrer cate-
from the top ten referrers that we have access to (see Section gory, by computing the distributions of the number of views
3.3). Note that, as shown in Table 5, these ten referrers are for which each referrer category is responsible, considering
responsible for millions of views. only videos that received accesses from the given category.
Table 5 shows that search and internal YouTube mecha- Figures 6(a-c) show box plots containing first, second and
nisms are key mechanisms through which users reach content third quartiles, along with the 9th and 91th percentiles, and
on YouTube. Interestingly, in a very recent work, Oliveira the mean, for each referrer category and each video dataset
12
et al. [16] presented the following hypothesis: video search . Unlike Table 5, which provides aggregated measures for
is the main method for reaching content on video sharing each dataset, these plots allow us to assess the importance
websites. They verified this through online questionnaires of each referrer category for individual videos.
using a large number of volunteers. Whereas our results con- For example, Table 5 shows that Social referrers do not ap-
firm their hypothesis for videos in the Random dataset, they pear to be important for YouTomb dataset as a whole. Nev-
show YouTube internal features such as “Related Videos” ertheless, considering only copyright protected videos with
play an even more important role to content dissemination at least one Social referrer, Figure 6-b) shows that more
for Top videos. For YouTomb videos, both categories attract than 22% of the views come from subscription links for 25%
roughly the same number of views. We note that YouTube of such videos (3rd distribution quartile). This indicates
search is responsible for the vast majority of the Search refer- that users may subscribe to other users that post copyright
rers, as less than 1% of the Search accesses come from other protected content. The Featured category is a similar case.
Google search mechanisms. Comparing the importance of 12
Search referrers across datasets, we note that search is more For any given referrer category, at least 1000 videos re-
important to Random and YouTomb videos, as they are not ceived views for which it is responsible. Thus, these distri-
butions are computed over at least as many videos.Time Until First Referral (% lifetime)
Time Until First Referral (% lifetime)
Time Until First Referral (% lifetime)
1.0 1.0 1.0
91th Percentile 91th Percentile 91th Percentile
Mean Mean Mean
0.8 9th Percentile 0.8 9th Percentile 0.8 9th Percentile
0.6 0.6 0.6
0.4 0.4 0.4
0.2 0.2 0.2
0.0 0.0 0.0
EXT. FEAT. INT. MOB.SEAR. SOC. VIRAL EXT. FEAT. INT. MOB.SEAR. SOC. VIRAL EXT. FEAT. INT. MOB.SEAR. SOC. VIRAL
Referrer Category Referrer Category Referrer Category
(a) Top (b) YouTomb (c) Random
Figure 7: Distributions of time spent until the first access from a referrer category (time is normalized by
video’s lifetime).
Moreover, we note that the Social, Featured and Viral cat- Figures 7(a-c) show the distributions of the difference be-
egories are responsible for more than 30%, 33% and 34%, tween the time of the first referrer access and the time the
respectively, of the views for 25% of the Top videos with video was uploaded, measured as a fraction of the video’s
referrers from each category (Figure 6-a). Finally, accord- lifetime. For the Top and YouTomb datasets, referrers (of
ing to Figure 6-c), the Featured category plays a dominant any category) tend to happen very early: for 75% of the Top
role as source of views to videos in the Random dataset: and YouTomb videos, most referrer categories have their
25% of the videos that received at least on Featured referrer first appearances during the first quarter of the video’s life-
received at least 30% of their views from such referrers. time. In fact, only 9% of the Top videos have their first
We note that it is hard to tell whether one referrer might referrer access (of any category) after 40% of their lifetimes.
influence the number of views from other referrers. For ex- The exception is the Featured category on YouTomb: those
ample, a Top video may experience a popularity growth from referrers tend to take somewhat longer to appear for the
Social and Viral referrers after being featured in the top list. first time. For instance, for 25% of the YouTomb videos,
Conversely, it may first receive a large number of views from they appear only after 70% of the video’s lifetime. This
Social and Viral referrers, which ultimately leads it to be fea- was somewhat expected as YouTube would most likely not
tured in the top list. Similarly, Viral accesses may greatly feature videos that are suspicious to be copyright protected.
contribute for a video to enter a top list; alternatively, videos For Random videos, in general, Search, Internal, External,
in a top list may spread much more quickly disseminated via and Social referrers tend to appear earlier than referrers from
emails. In the following, we study this issue by analyzing the other categories. Thus, users are more likely to initially
how early in a video’s lifetime each type of referrer is used. find such videos through social links, search, other YouTube
internal mechanisms or some external website, instead of
receiving them via e-mail or viewing them on mobile devices.
5.2 Referrer’s First Appearance
We start by analyzing the referrers that first lead users to
a video. The ftime columns in Table 5 show the fractions
of videos that had the first referrer falling into each given 6. CONCLUSIONS AND FUTURE WORK
category. We note that, since YouTube provides only the We characterized the growth patterns of video popular-
day each referrer was first used and several referrers may ity on the currently most popular video sharing application,
appear on a single day, there might be ties, i.e., multiple YouTube. Using newly provided data by the application,
categories may be listed as containing the first referrer of a we analyzed how the popularity of individual videos evolve
video. Thus, the sum of the ftime column can exceed 100%. since the video was uploaded, as well as the different types
The first referrer for 79%, 67%, and 51% of the Top videos of referrers that most often lead users to the videos.
are from the Viral, Internal, and Mobile categories, respec- Comparing the three analyzed datasets, copyright pro-
tively. For the YouTomb dataset, Internal, Viral, and Search tected (YouTomb) videos tend to get most of their views
are the top three categories, containing the first referrers for much earlier in their lifetimes, followed by Top videos and,
65%, 62% and 52% of the videos, respectively. For the Ran- somewhat behind, videos in the Random dataset. We also
dom dataset, the first referrer of 55%, 41%, and 34% of the found that Top videos tend to experience significant bursts
videos are from the Viral, Search, and Internal categories, of popularity, receiving a large fraction of their views on a
respectively. Thus, in general, viral spreading and inter- single peak day (or week). As a matter of fact, most (charac-
nal YouTube mechanisms appear as primary forms through terized) Top videos have popularity growth patterns falling
which users reach the content for the first time, in all three into the Quality category, that is, they experience a sudden
datasets. Interestingly, mobile devices are also a relevant burst of popularity remaining attractive for a while. In con-
front door to Top videos, whereas for YouTomb and Ran- trast, videos in the YouTomb and Random datasets tend
dom videos, the YouTube search engine accounts for a large to experience multiple smaller popularity peaks. Indeed, if
fraction of the first referrers. popularity growth is analyzed on a weekly basis, most videosin both datasets fall into the Viral category, with a popular- characteristics of large-scale user generated content
ity growth following an endogenous word-of-mouth process. systems. IEEE/ACM Transactions on Network
We also identified and quantified the main referrers that (TON), 17(5):1357–1370, 2009.
led users to videos in each dataset. Particularly, we showed [7] M. Cha, A. Mislove, and K. Gummadi. A
that search and internal YouTube mechanisms, such as lists measurement-driven analysis of information
of related videos, are key mechanisms to attract users to propagation in the Flickr social network. In
the videos. Whereas search referrers account for the largest Proceedings of the World Wide Web Conference
fraction of views to videos in the Random dataset, internal (WWW), 2009.
YouTube mechanisms play an even more important role to [8] G. Chatzopoulou, C. Sheng, and M. Faloutsos. A first
content dissemination for Top and YouTomb datasets. step towards understanding popularity on youtube. In
Our analyses uncover various interesting findings, leading Proceedings of the IEEE Conference on Computer
to several possible directions for future work. One such di- Communications (INFOCOM), 2010.
rection is to leverage our findings to build mechanisms for [9] R. Crane and D. Sornette. Quality, and junk videos on
predicting content popularity. Predicting which newly up- YouTube: Separating content from noise in an
loaded content will become popular can help companies to information-rich environment. In Proceedings of the
maximize revenue through advertise placement tools, and AAAI Spring Symposium, 2008.
can also help consumers filtering the ever-growing amount [10] R. Crane and D. Sornette. Robust dynamic classes
of available content. In a system like YouTube, popularity revealed by measuring the response function of a
prediction is a huge challenge as it results from the combina- social system. Proceedings of the National Academy of
tion of a multitude of factors including complex interactions Sciences (PNAS), 105(41):15649–15653, 2008.
among users, aspects related to content quality and external
[11] P. Gill, M. Arlitt, Z. Li, and A. Mahanti. YouTube
events. Such factors are, at least partially, captured by the
traffic characterization: A view from the edge. In
referrers that are used to reach the content. Indeed, these
Proceedings of the ACM Internet Measurement
referrers provide evidence of how the video is being dissemi-
Conference (IMC), 2007.
nated. Thus, referrer information, along with the popularity
growth patterns characterized here, might serve as valuable [12] M. Gonçalves, J. Almeida, L. Santos, A. Laender, and
data sources for predicting content popularity. V. Almeida. On popularity in the blogosphere. IEEE
Another possible direction is to investigate how refer- Internet Computing, 14:30–37, 2010.
rer and popularity growth patterns can be exploited to [13] D. Kempe, J. Kleinberg, and É. Tardos. Maximizing
improve the effectiveness of content recommendation and the spread of influence through a social network. In
search tools. This is particularly interesting given that we Proceedings of the ACM SIGKDD Conference on
found that search and internal YouTube mechanisms are the Knowledge Discovery and Data Mining (KDD), 2003.
two most important sources of “hits” for video traffic. [14] K. Lerman and T. Hogg. Using a model of social
dynamics to predict popularity of news. In Proceedings
of the World Wide Web Conference (WWW), 2010.
ACKNOWLEDGEMENTS
[15] J. Leskovec, K. J. Lang, A. Dasgupta, and M. W.
This research is partially funded by the Brazilian Na- Mahoney. Statistical properties of community
tional Institute of Science and Technology for Web Research structure in large social and information networks. In
(MCT/CNPq/INCT Web Grant Number 573871/2008-6), Proceedings of the World Wide Web Conference, 2008.
and by the authors’ individual grants from CNPq, CAPES [16] R. Oliveira, M. Cherubini, and N. Oliver. Looking at
and Fapemig. We also thank Elizeu Santos Neto for initial near-duplicate videos from a human-centric
discussions, and members of the YouTomb discussion list. perspective. ACM Transactions on Multimedia
Computing, Communications and Applications
7. REFERENCES (TOMCCAP), 6(3):1–22, 2010.
[1] comscore:americans viewed 12 billion videos online in [17] J. Ratkiewicz, A. Flammini, and F. Menczer. Traffic
may 2008. http://goo.gl/2bKmP. Accessed Nov/2010. in social media I: paths through information networks.
[2] New york times. uploading the avantgarde. In Proc. of the Int’l Symposium on Social Intelligence
http://goo.gl/S72M8. Accessed in Nov/2010. and Networking, 2010.
[3] Y.-Y. Ahn, S. Han, H. Kwak, S. Moon, and H. Jeong. [18] F. Suchanek, G. Kasneci, and G. Weikum. Yago: A
Analysis of topological characteristics of huge online core of semantic knowledge. In Proceedings of the
social networking services. In Proceedings of the World World Wide Web Conference (WWW), 2007.
Wide Web Conference (WWW), 2007. [19] G. Szabo and B. Huberman. Predicting the popularity
[4] A. Anagnostopoulos, R. Kumar, and M. Mahdian. of online content. Communications of the ACM,
Influence and correlation in social networks. In 53(8):80–88, 2010.
Proceedings of the ACM SIGKDD Conference on [20] W. Willinger, R. Rejaie, M. Torkjazi, M. Valafar, and
Knowledge Discovery and Data Mining (KDD), 2008. M. Maggioni. Research on online social networks:
[5] F. Benevenuto, T. Rodrigues, V. Almeida, J. Almeida, Time to face the real challenges. SIGMETRICS
and K. Ross. Video interactions in online video social Performance Evaluation Review, 37(3):49–54, 2009.
networks. ACM Transactions on Multimedia [21] M. Zink, K. Suh, Y. Gu, and J. Kurose. Watch global,
Computing, Communications and Applications cache local: YouTube network traces at a campus
(TOMCCAP), 5(4):1–25, 2009. network - measurements and implications. In
[6] M. Cha, H. Kwak, P. Rodriguez, Y-Y. Ahn, and Proceedings of the IEEE Multimedia Computing and
S. Moon. Analyzing the video popularity Networking (MMCN), 2008.You can also read