FY18 RESULTS PRESENTATION - 23 August 2018 - CMW - FY18 Results - Macmahon Holdings Limited
←
→
Page content transcription
If your browser does not render page correctly, please read the page content below
FY18
RESULTS
PRESENTATION
23 August 2018

                 CMW – FY18 Results   1
Important Information & Disclaimer
This    presentation     including    its    appendices      appropriate for their particular jurisdiction.                 Cromwell Ipswich City Heart Trust ARSN 154 498 923
(Presentation) is dated 23 August 2018 and has been                                                                         (ICH), Cromwell Phoenix Core Listed Property Fund
                                                             Cromwell Property Group does not guarantee any
prepared by Cromwell Property Group, which                                                                                  ARSN 604 286 071 (PCF), Cromwell Phoenix
                                                             particular rate of return or the performance of
comprises Cromwell Corporation Limited (ACN 001                                                                             Opportunities Fund ARSN 602 776 536 (POF),
                                                             Cromwell Property Group nor do they guarantee the
056 980) and the Cromwell Diversified Property Trust                                                                        Cromwell Phoenix Property Securities Fund ARSN
                                                             repayment of capital from Cromwell Property Group or
(ARSN 102 982 598) (the responsible entity of which                                                                         129 580 267 (PSF), Cromwell Property Trust 12 ARSN
                                                             any particular tax treatment. Past performance is not a
is Cromwell Property Securities Limited (ACN 079 147                                                                        166 216 995 (C12) and Cromwell Riverpark Trust
                                                             reliable indicator of future performance. Any “forward-
809; AFSL 238052)). Shares in Cromwell Corporation                                                                          ARSN 135 002 336 (CRT) (the funds). In making an
                                                             looking” statements are based on assumptions and
Limited are stapled to units in the Cromwell Diversified                                                                    investment decision in relation to one or more of the
                                                             contingencies which are subject to change without
Property Trust. The stapled securities are listed on the                                                                    funds, it is important that you read the product
                                                             notice. Any forward-looking statements are provided
ASX (ASX Code: CMW).                                                                                                        disclosure statement for the fund. The PDS for each
                                                             as a general guide only and should not be relied upon
                                                                                                                            fund is issued by CFM and is available from
This Presentation contains summary information about         as an indication or guarantee of future performance.
                                                                                                                            www.cromwell.com.au or by calling Cromwell on 1300
Cromwell Property Group as at 30 June 2018.
                                                             The information in this Presentation has been obtained         268 078. POF, ICH, C12 and CRT are not open for
Statutory financial information has been reviewed by
                                                             from or based on sources believed by Cromwell                  investment. Applications for units in APF, DPF, PCF
Cromwell Property Group’s auditors.             Operating
                                                             Property Group to be reliable. To the maximum extent           and PSF can only be made on the application form
financial information has not been subjected to audit
                                                             permitted by law, Cromwell Property Group, their               accompanying the relevant PDS.
review. All financial information is in Australian dollars
                                                             officers, employees, agents and advisors do not make
and all statistics are as at 30 June 2018 unless                                                                            This Presentation does not constitute an offer to sell,
                                                             any warranty, expressed or implied, as to the
otherwise stated. All statistics include 50% share of                                                                       or the solicitation of an offer to buy, any securities or
                                                             currency, accuracy, reliability or completeness of the
Northpoint Tower.                                                                                                           any other financial products in the United States or
                                                             information in this Presentation and disclaim all
                                                                                                                            any other jurisdiction. Cromwell Property Group
The information in this Presentation is subject to           responsibility and liability for the information (including,
                                                                                                                            stapled securities have not been, and will not be,
change without notice and does not purport to be             without limitation, liability for negligence).
                                                                                                                            registered under the US Securities Act of 1933, as
complete or comprehensive. It should be read in
                                                             To the extent that any general financial product advice        amended (Securities Act) or the securities laws of any
conjunction with Cromwell Property Group’s other
                                                             in respect of Cromwell Property Group stapled                  state or other jurisdiction of the United States and may
periodic and continuous disclosure announcements
                                                             securities is provided in this Presentation, it is             not be offered or sold in the United States or to, or for
available at www.asx.com.au.
                                                             provided by Cromwell Property Securities Limited.              the account or benefit of, a person in the United States
The information in this Presentation does not take into      Cromwell Property Securities Limited and its related           unless they have been registered under the Securities
account your individual objectives, financial situation      bodies corporate, and their associates, will not receive       Act, or are offered or sold in a transaction exempt
or needs. Before making an investment decision,              any remuneration or benefits in connection with that           from, or not subject to the registration requirements of
investors should consider, with or without a financial or    advice.                                                        the Securities Act and any other applicable securities
taxation adviser, all relevant information (including the                                                                   laws.
                                                             Cromwell Funds Management Limited ACN 114 782
information in this Presentation) having regard to their
                                                             777 AFSL 333214 (CFM) is the responsible entity of,
own objectives, financial situation and needs.
                                                             and the issuer of units in the Cromwell Australian
Investors should also seek such financial, legal or tax                                                                     © 2018. Cromwell Property Group. All rights reserved.
                                                             Property Fund ARSN 153 092 516 (APF), Cromwell
advice as they deem necessary or consider
                                                             Direct Property Fund ARSN 165 011 905 (DPF),

                                        CMW – FY18 Results                                                                                                                              2
SECTION 1

Overview & Key Highlights

Cromwell Property Group Overview
Cromwell is a real estate investor and manager operating on three continents with a global investor base
Cromwell offers securityholders an attractive combination of stable long term cash flows, demonstrated asset
enhancement capabilities and transactional profits, and low risk exposure to Asian capital flows and European
economic growth
Cromwell maintains a strong and secure balance sheet and long-dated Australian property portfolio which enable it
to recycle assets and reinvest into its property investment and funds management businesses
Property Investment Funds Management
Maintain Repurpose, Manage property Continually looking Focus on core, Provide investors Provide investors
defensive core reposition or internally to for value based core plus and with a range of with a liquid
portfolio transform active understand risk and investment value add product options investment and
characteristics of asset portfolio to opportunity more opportunities opportunities via either open stable, secure and
strong tenant improve asset clearly than others sustained
ended funds or
covenant, quality and realise Select wholesale distributions per
closed, unlisted
long WALE and additional value partnerships security
trusts
fixed rental
increment Ability to execute
Focus on delivering
mandates across
an attractive yield
all investment
Realise with low volatility
Transition styles
to Core Profits
CMW – FY18 Results 4
FY18 Key Milestones
30 September Soward Way, ACT (FY18 valuation of $260 million) reaches practical completion
4 October Sold 9.83% stake in Investa Office Fund (ASX: IOF), profit of $25 million, IRR of 18%
29 November Health and Forestry House sold for $66 million, IRR 20%
30 November Successful listing of the €1.4 billion Cromwell European REIT (CEREIT) on the SGX-ST
11 December $170 million strategic placement to SingHaiyi Group Ltd and Haiyi Holdings Pte. Ltd
8 February Securities Purchase Plan closed at $35 million
8 March ARA acquires a 19.5% stake from Redefine Properties for $405 million
19 March Northpoint Tower reaches practical completion (Early Light acquires 50% for $300 million)*
29 March Settlement of €230 million 2.5% guaranteed convertible bonds due 2025
6 April Musk Avenue Kelvin Grove sells for $84 million
14 May Announced strategic logistics partnership with Linkcity (Bouygues) in Central Europe
6 June Oyster, KKR go unconditional on Auckland’s NZ$209 million Central Park Corporate Centre
29 June Appointed to €108.5 million portfolio of 27 properties in Helsinki by Goldman Sachs
29 June Australian debt refinanced, debt tenor extended to 5.2 years
*Subsequently settled 1 August 2018
CMW – FY18 Results 5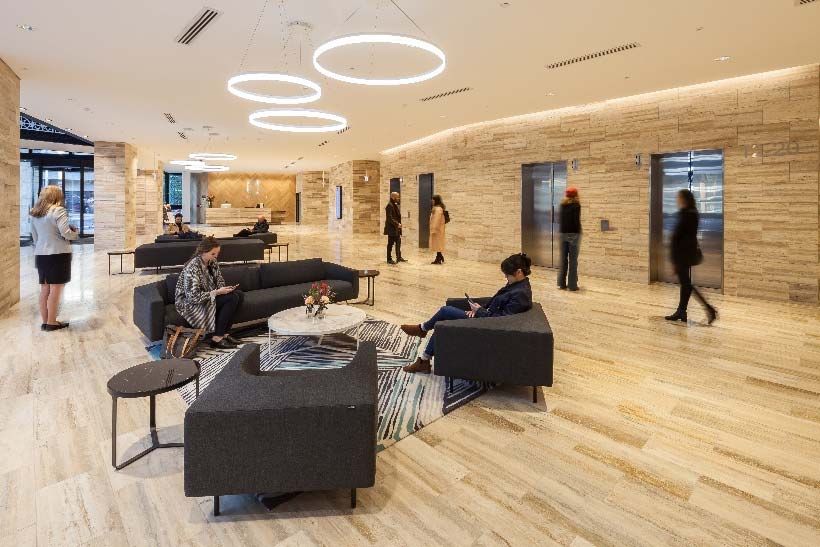
Increased Investment Focus To Drive Future Growth
Cromwell is positioning itself to deliver future
Cromwell Annualised Performance Returns to 30 June 2018
operating profit growth by utilising existing
liquidity and ongoing asset recycling initiatives 30.0%
Success of CEREIT, growth in Funds
Management, support from new capital partners 25.0%
and opportunities identified, provide confidence
to invest further in the growth of the Platform
20.0%
Strategy to invest to leverage returns from
additional management revenues (“Invest to
Manage”) and create value 15.0%
Balance Sheet liquidity and asset recycling will
fund initiatives to build enterprise value, add to
10.0%
medium term earnings and generate higher TSR
Some distributable cash will be reinvested back
into the business for further growth 5.0%
0.0%
1 year 3 year 5 year 10 year 15 year
Cromwell Total Return 27.7% 11.8% 11.3% 13.8% 26.8%
All Ordinaries Accumulation Index 13.7% 9.5% 10.3% 6.2% 9.6%
S&P / ASX 300 A-REIT Accumulation Index 13.2% 10.0% 12.2% 6.1% 5.8%
CMW – FY18 Results 6
Increased Investment Focus To Drive Future Growth
The ‘Invest To Manage’ strategy involves connecting FY18 saw successful execution of this strategy with
different capital sources to a range of different pipeline the warehousing of three Dutch assets for the
opportunities successful IPO of CEREIT
The strategy will use capital profits and other capital The opportunities are likely to crystallise at different
sources to fund the seeding and warehousing of assets, times depending on a range of factors (market
and co-investment in funds to accelerate AUM growth conditions, opportunity, capital availability)
CAPITAL OPPORTUNITIES
PRIVATE EQUITY CORPORATE TRANSACTIONS
Building on existing relationships for 1 Where Cromwell can identify
deployment into Europe, Australia and unlock value
or New Zealand
VALUE DRIVEN ASSET OPPORTUNITIES
BALANCE SHEET
Connecting e.g. Northpoint
Capital to THEMATICS
Identifying thematic product led initiatives
RETAIL
Opportunity e.g. Aged care (LDK) or logistics
(Bouygues) sectors
INVESTOR LED ACQUISITIONS
INSTITUTIONAL Acquisition of specific assets/portfolios with
capital partners e.g. ARA, Early Light
PUBLIC MARKETS CEREIT AND OTHER LISTED MANAGEMENT
VEHICLES
CMW – FY18 Results 7
Recycling And Reinvestment Delivers Results
FY18 EPS exceeds guidance benefitting from continued
recycling and reinvestment strategy FY18 EPS exceeds guidance
Capital raising completed; strong, secure balance sheet with
low gearing, substantial cash and long debt tenor NTA per unit up 7.9% to $0.96
Portfolio has long WALE, favourable lease expiry profile,
low incentives and maintenance capex requirements AUM up 14% to $11.5 billion
All operational indicators are showing positive momentum
Additional immediate value add opportunities identified WALE of 7.2 years
include Victoria Avenue, Chatswood and repositioning of
Tuggeranong Office Park to Aged Care with LDK Healthcare Gearing reduced to 37%
CEREIT successfully established in Singapore, IPO
forecasts exceeded to date, low gearing, ready for growth
Debt tenor extended to 5.2 years
Funds management contribution to operating profit
surpasses previous target of 20%, new strategy adopted
€1.4 billion CEREIT IPO
Investment in platform, people and technology continues to
position business for the next stage of growth
Distributable earnings up 7.1%
CMW – FY18 Results 8
SECTION 2
Financial and Capital
Management Update
Financial Update – FY18 Headline Results
FY18 COMMENTARY FY18 Performance Versus Prior Year
Statutory profit was $204.1 million down from FY17 FY18 FY17 Change
($277.5 million)
Statutory profit ($M) 1 $204.1 $277.5 (26.5%)
Operating profit was $156.8 million up 3.0% on the
prior year (FY17 $152.2 million) Statutory profit
10.89 15.78 (31%)
(cents per security)
Operating profit per security was 8.36 cps, ahead of
guidance of 8.25 cps, but down 3.4% on prior year Operating profit ($M)1 $156.8 $152.2 3.0%
Funds distributed were up 7.1% to $157.1 million
Operating profit
(FY17 $146.7 million) 8.36 8.65 (3.4%)
(cents per security)
Distributions were 8.34 cps, equivalent to the prior
year, but inclusive of a 6.7% increase in weighted Distributions ($M) 2 $157.1 $146.7 7.1%
average number of shares on issue
Distributions
8.34 8.34 0.0%
(cents per security)
Payout ratio 100.2% 96.4% 3.9%
1) See Appendices for further details of segment results, operating profit and reconciliation to statutory profit
2) Includes an amount of $392,000 for both Cromwell and the Trust in excess of the pro-rata entitlement for the quarterly distribution paid to those securityholders who acquired securities in February 2018 as
part of the Security Purchase Plan
CMW – FY18 Results 10Financial Update – FY18 Segment Results1
FY18 COMMENTARY FY18 Segment Performance Versus Prior Year
Property Investment profit was $115.0 million, an 8% FY18 FY17
decrease on the prior year mainly due to asset sales ($M) ($M) Change
and Tuggeranong vacancy Property Investment 115.0 124.7 (7.8%)
Asset services profit increased due to project
Asset Services 2.2 (0.2) (1,200%)
management fees for Northpoint Tower
Internal Funds Management primarily represents Funds Management Internal 19.4 2.6 646.2%
CEREIT transactional and other income
Funds Management Retail 3.8 8.2 (53.7%)
Retail Funds Management profit was $3.8 million;
prior year included $4.1 million from the Cromwell Funds Management Wholesale 16.4 16.9 (3%)
Riverpark Trust extension
Wholesale Funds Management profit was $16.4
million down slightly (3%) from the prior year
Operating profit 156.8 152.2 3.0%
Operating profit (cents per security) 8.36 8.65 (3.4%)
1) See Appendices for further details of segment results, operating profit and reconciliation to statutory profit
CMW – FY18 Results 11Financial Update – Balance Sheet Strengthens
FY18 FY17
Balance Sheet Strengthens (Actual $m) (Actual $m)
Cash and cash equivalents 204.6 86.9
Cash and Cash Equivalents has increased by a sizeable
Investment property 2,451.1 2,357.8
136% to $204.6 million from $86.9 million in the prior year
Investment property held for sale 0.9 69.5
CEREIT recorded as an equity accounted investment Equity accounted investments 702.4 101.5
Goodwill from Europe acquisition was written down in the first Receivables 44.0 37.4
half to reflect the transformation of the business Intangibles 2.3 72.3
Investments at fair value 33.0 315.8
Net Tangible Assets (NTA) per unit up $0.07 to $0.96 (FY17 1,2
Other assets 28.0 369.7
$0.89)
Total assets 3,466.3 3,410.9
Strategic Placement, SPP Offer and ARA investment
Borrowings (1,412.0) (1,274.2)
$170 million strategic placement to SingHaiyi Group Ltd and
Derivative financial instruments (37.7) (3.2)
Haiyi Holdings Pte. Ltd. entities completed in December 2017
Distribution payable (41.4) (36.7)
Follow-up Securities Purchase Plan gave retail Payables (52.3) (46.4)
securityholders similar terms, closed at $35 million in Other liabilities 1,2
(21.4) (410.5)
February 2018 Total liabilities (1,564.8) (1,771.0)
Total capital raised $205 million (excl. PRP/DRP). Total Net assets 1,901.5 1,639.9
securities on issue as at 30 June 2018 is 1,985.3 million
(FY17 1,762.4 million) Securities on issue (m) 1,985.3 1,762.4
2
NTA per security $0.96 $0.89
FY18 earnings beat guidance despite an increase in total
1) Includes disposal group assets and liabilities for FY17
additional weighted average securities on issue of 6.7% 2) Including interest rate swaps
CMW – FY18 Results 12Capital Management – Position Improves Further
FY18 Capital Management Initiatives
The sale of the Investa Office Fund (ASX:IOF)
stake in October 2017 saw the repayment of
the $123 million margin loan
FY18 asset sales totalled over $154 million
Surplus proceeds from the asset sales plus
IOF sale were applied to revolvers and cash
deposits
Part of the $205 million in total new capital
raised (excl. PRP/DRP) has been applied to
revolvers
Settled €230 million, seven year, guaranteed
convertible bonds due 2025, repurchasing
€95.2 million of the existing convertible bonds Group gearing1 is now 37% (43% look-through)
due February 2020 which is at the bottom of the target range for this
Bonds were used to repay financial point in the cycle and offers support for future
indebtedness and for general pipeline investment opportunities
corporate purposes
1) Gearing calculated as (total borrowings less cash)/(total tangible assets less cash). Look through gearing adjusts for the 50% interest in Northpoint Tower and 35% of CEREIT
CMW – FY18 Results 13Capital Management – Position Improves Further
Strengthening Debt Profile Debt Expiry Profile
June 2018 refinance now sees nine lenders + CB issues with
greater diversity across global and domestic lenders
Weighted average debt expiry increased to 5.2 years with
majority expiring in 2023
87% of book effectively hedged, with average interest rate for
FY18 down to 3.3%
Looking to diversify further in Private Placement markets with
initial due diligence in Australia, Europe and US
Interest Rate Hedging
Executed $690 million of interest rate derivatives; weighted HEDGE SUMMARY Hedge Avg Fixed / Years
Average Hedge Term of 3.4 years Amount ($M) Strike Rate Remaining
Caps
The blend of interest rate caps and swaps ensures a sustainable Caps expiring FY20 45.0 1.9190% 1.0 yrs
cost base allowing the business to benefit if base rates fall Caps expiring FY21 45.0 2.0893% 2.0 yrs
Caps expiring FY22 270.0 2.2460% 3.0 yrs
Forward exposures are actively managed, within ranges, against TOTAL CAPS 360.0 2.1855% 2.6 yrs
an annually agreed target to ensure the best possible protection Swaps
Swaps expiring FY20 45.0 1.9158% 1.0 yrs
FX hedging strategy is to raise local liabilities in the currency of Swaps expiring FY21 45.0 2.1033% 2.0 yrs
the underlying assets and use cross currency swaps for any Swaps expiring FY22 240.0 2.2453% 3.0 yrs
shortfall TOTAL SWAPS 330.0 2.1810% 2.6 yrs
Other
1) Includes 50% of Northpoint Debt and 35% of CEREIT 2020 Convertible Bond 86.4 2.0000% 1.6 yrs
2025 Convertible Bond 340.4 2.5000% 6.8 yrs
Cross Currency Swap 119.9 0.8400% 0.2 yrs
TOTAL HEDGING 1,236.7 3.4 yrs
CMW – FY18 Results 14SECTION 3 Property Investment Segment
Property Portfolio Snapshot (as at 30 June 2018)
     Focus on secondary assets in CBD, CBD fringe and established suburban markets with potential to outperform

                                                                           Core Portfolio                Core+ Portfolio         Active Portfolio
                                                                           Long WALE, full occupancy     Medium term WALE with   Vacant, near vacant and / or
                                                                           low incentives / capex        leasing upside          being actively repositioned

                                                                           QANTAS GLOBAL HQ            207 KENT STREET           TUGGERANONG OFFICE PARK
                                                                           Mascot, NSW                 Sydney, NSW               Greenway, ACT

                                                                                                       475 VICTORIA AVENUE       TUGGERANONG CAR PARK
                                                                       2   MCKELL BUILDING
                                                                           Sydney, NSW                 Chatswood, NSW            Greenway, ACT

                                                                           STATION STREET              REGENT CINEMA CENTRE      ORACLE BUILDING
                                                                           Penrith, NSW                Albury, NSW               Lyneham, ACT
                                                                   9                                                             LOVETT TOWER
                                                  2                        CROWN STREET                19 NATIONAL CIRCUIT
                                                               8           Wollongong, NSW             Barton, ACT
                                                                                                                                 Woden, ACT

                                                           2               FARRER PLACE                TGA COMPLEX
                                                                                                                                 BORROWDALE HOUSE
                                                                           Queanbeyan, NSW                                       Woden, ACT
                                                                                                       Symonston, ACT
                                                                           BULL STREET
                                                                           Newcastle, NSW              HQ NORTH TOWER            WAKEFIELD STREET
 Key Portfolio Metrics                                                                                 Fortitude Valley, QLD     Adelaide, SA
                                                                           700 COLLINS STREET
 No. properties on balance sheet                                   231     Docklands, VIC
                                                                                                       200 MARY STREET           STURTON ROAD2
                                                                                                       Brisbane, QLD             Edinburgh Park, SA
 Value                                                         A$2.5bn     VILLAGE CINEMAS
                                                                           Geelong, VIC
 WACR                                                           6.13%

 Occupancy by NLA                                               94.5%      SOWARD WAY
                                                                           Greenway, ACT
 WALE                                                           7.4 yrs

1)    Note: Northpoint is equity accounted and excluded.
2)    Part sold. Remaining area contracted for sale.

                                              CMW – FY18 Results                                                                                          16
Property Portfolio Snapshot
Core Portfolio
Core portfolio comprises nine assets, majority of portfolio by value CORE
with a long WALE, essentially full occupancy plus low capex and
incentive requirements
58%
Wale: 11.1 yrs
Like for like NOI increased 4.6% Occupancy 99.9%
NOI 4.6%
Soward Way reached Practical Completion in September 2017 and
was added to the Core portfolio on a 15 year lease to the
Commonwealth Government’s Department of Social Services
CORE+
Core+ Portfolio
Portfolio comprises seven assets with medium term WALE and
36%
Wale: 3.8yrs
leasing expiry Occupancy
96.2%
Like for like NOI increased 1.6% benefitting from leasing success at NOI 1.6%
19 National Circuit and HQ North
Active Portfolio
ACTIVE
Portfolio comprises six value add opportunities including
Tuggeranong Office Park and Wakefield Street, Adelaide to portfolio 6%
Wale: 2.9yrs
Occupancy 79.8%
NOI (14.8%)
CMW – FY18 Results 17Property Portfolio – Valuations Continue To Rise
All assets were revalued over the course of the year
Fair value increase in investment property of $85.7 million net of property improvements, lease costs and
incentives
Weighted Average Cap Rate tightened by 0.52% to 6.04%
Reflects improvement in core portfolio, slight further compression potential as value add projects come to fruition
Historic Weighted Average Cap Rate
9.0%
8.5%
8.0%
7.5%
6.04%
7.0%
6.5%
6.0% Jun-2009
Jun-2010
Jun-2011
Jun-2012
Jun-2013
Jun-2014
Jun-2015
Jun-2016
Jun-2017
Jun-2018
CMW – FY18 Results 18Property Portfolio – Strong Leasing Success
Strong Leasing Success
Strong leasing activity in year with 100 transactions in
total for 75,000 sqm. Major transactions have included:
TechnologyOne renewed for 9,613 sqm at HQ North
until 2026
ANAO renewed their lease for 12 years at 19 National HQ North, Fortitude Valley
Circuit, ACT (5,600 sqm)
Therapeutic Goods Administration (TGA Complex)
renewed for five years over 18,500 sqm
24 new retail leases commencing at Northpoint Tower
Increased activity in the sub 500 sqm office tenant
market 207 Kent Street, Sydney 200 Mary Street, Brisbane
4,745 sqm of new leases at Northpoint Tower
3,767 sqm of new leases at 207 Kent Street
2,347 sqm of new leases at 200 Mary Street
2,320 sqm of new leases at Victoria Avenue, Chatswood
TGA Complex, Symonston 19 National Circuit, Canberra
CMW – FY18 Results 19Property Portfolio – Market Leading WALE of 7.2 years
Vacancy, excluding the active asset portfolio, Lease Expiry Profile % Gross Income3
60%
is 2.5%. 54.1%
WALE of 7.2 years
50%
Average fixed review in next 3 years.
3.81% over 65% of portfolio in FY19 40%
3.75% over 58% of portfolio in FY20
2.85% over 48% of portfolio in FY21 30%
Next Review Type3 20%
0%
100% 11.8%
90% 8.0%
48% 13% 10% 6.4% 6.6% 7.2%
80% 5.9%
1% 39%
70%
60% 0%
58% 1
50% 20% Vacant FY19 FY20 FY21 FY22 FY23 Thereafter
40% 21%
30%
1%
20% 65% \
20% 14%
10% NSW:28% NSW:45% NSW:19% NSW:71% NSW:38% NSW:72% NSW:57%
0% QLD: 12% QLD: 24% QLD:44% QLD: 22% QLD: 11% QLD: 22% QLD: 7%
2
VIC: 1% ACT: 31% VIC: 4% ACT: 7% VIC: 1% ACT: 6% VIC: 16%
Fixed CPI Market No Review ACT: 59% SA: 33% ACT: 50% ACT: 20%
FY2019 FY2020 FY2021
1) Includes vacancy, holdover, casual
2) Includes CPI reviews with a fixed minimum amount
3) Calculated on current gross passing income, subject to review
All statistics incorporate 50% of Northpoint
CMW – FY18 Results 20Property Portfolio – Minimal Future Lease Expiries
There are four future expiries >1% income over the next three years
Lease Expiries representing >1% income (FY19-FY21)
% of Total
Property Tenant Comment Area (sqm) Expiry Date Portfolio Rental
Income
FY19
Lovett Tower Department of Prime Minister and Cabinet Adaptive reuse options being examined 7,048 March 2019 1.42%
FY20
HQ North AECOM In active negotiations 13,7711 April 2020 5.29%
Wakefield Street Calvary Healthcare Adelaide Pty Ltd In lease extension discussions 17,881 July 2019 4.09%
FY21
Victoria Avenue Reed Elsevier Australia Pty Ltd In active negotiations 8,231 Dec 2020 2.46%
1) 2,887 sqm of this total amount has been leased to Technology One as at April 2020.
CMW – FY18 Results 21Property Portfolio – Tenant Profile Remains Robust
Geographic Diversification1 Sector Diversification1 Tenant Classification1
1.7% 1.6%
4.1%
Office
ACT 4.1%
10.0% 18.9%
6.9% Mixed use 28.6% Government Authority 2
NSW
35.1%
15.5% Healthcare
QLD Listed Company/Subsidary
VIC Retail
Private Company
51.5% SA 85.7% Aged Care 36.3%
% of Gross
Top 5 Tenants1 Income Cumulative % Credit Rating3 Tenant profile remains consistent and of high quality
Federal Government 20.6% 20.6% AAA Top 5 tenants account for 58.1% of income
Qantas 14.8% 35.4% BBB- Government2 contributes 35.1% of income
NSW State Government 13.3% 48.7% AAA
Over half of portfolio is in NSW and benefitting from strong
AECOM Australia Pty Ltd 5.3% 54.0% BB leasing conditions
Calvary Healthcare 4.1% 58.1%
Exposure to resource states substantially reduced to two assets
TOTAL 58.1%
in Brisbane, none in Perth
1) By gross passing income
2) Includes Government owned and funded entities
3) S&P Ratings as at 22 August 2018
Increased sector diversification as investment strategy unfolds
All statistics incorporate CMW’s 50% ownership of Northpoint
CMW – FY18 Results 22Property Portfolio – Asset Recycling Continues
Assets Realisations
Continued strategy to realise value for assets at the end
of their optimal investment term and recycle the capital
More than $154.5 million in assets sold or contracted to
sell in FY18 including:
Health House & Forestry House, interconnected
towers in Brisbane CBD, sold for $66 million in
November 2017
Musk Avenue, Kelvin Grove, Brisbane Fringe sold for Huntingfield Avenue, Tasmania
$84 million in March 2018
Huntingfield Avenue, Tasmania sold for $4.5 million in
January 2018
Sturton Road vacant land (one lot of two) in South
Australia sold for $0.7 million
Proceeds from asset sales have been recycled,
reducing debt and allocated to funding new
investment opportunities
Health House and Forestry House, Brisbane
CMW – FY18 Results 23Property Portfolio – FY18 Value Enhancements Complete
Both Soward Way and Northpoint Tower, representing a combined $300
million in capital investment, reached practical completion in FY18.
Soward Way, ACT
Bespoke 30,704 sqm new building constructed for Department of
Social Services (DSS) on a 15 year lease, capacity for 2,500 workers
Project commenced in August 2015 and completed on time and on
budget ($170 million) in September 2017
Completion valuation of $260 million, 54% above cost
5 star Green Star rating and a 4.5 NABERS energy rating Soward Way, ACT
Northpoint Tower, North Sydney
Project commenced early 2016 and reached practical completion
in March 2018, on budget ($137.9 million) and on time
Focus on leasing remaining office space (89.2% occupied)
Heads of agreement have been signed over remaining food and
retail tenancies, to progressively open over the next few months
Early Light International acquired 50% interest in Northpoint from
Redefine Properties on 1 August 2018 for $300 million
Northpoint Lobby, North Sydney
CMW – FY18 Results 24Property Portfolio – FY19+ Value Enhancement Options
Victoria Avenue, Chatswood
Development application submitted April 2018 to add new four storey
office building, hotel, retail and other amenity to site
Result of DA expected November 2018, with construction, subject to
Council approval, starting in 2019
Likely to be a multi-stage process (office then hotel) with estimated
development cost of c$80 million over 2 years
Tuggeranong Office Park
Cromwell has invested in a 50% ownership interest in LDK Healthcare,
the operator of a planned >350 apartment community at Tuggeranong Artist Impression Victoria Avenue, Chatswood
Construction has commenced converting the old office buildings (mid
blue) to aged care, with first sales suite to open next year
Further development
The site has capacity for 35,000 sqm of further development either as opportunity
office or complementary uses to aged care (dark blue)
Cromwell retains 100% ownership of the land and buildings and LDK
Soward Way,
Healthcare has entered into a long-term lease over both DSS
LDK Managing Director is well-known aged care executive Paul
Browne
Cromwell is actively looking for future development sites and LDK Aged Care
conversion opportunities community
Tuggeranong Park, ACT
CMW – FY18 Results 25SECTION 4 Funds Management Segments
Funds Management – Strategy Realises Benefits
Total funds management operating profit was $39.6 million Funds Management Share of Operating Profit
(FY17 $27.7 million) continuing its growth trajectory and above
the previous target of > 20% of earnings (FY18 25.3%)
Internal funds management operating profit was $19.4
million (FY17 $2.6 million)
Wholesale funds management operating profit of $16.4
million (FY17 $16.9 million) with more than $4.7 billion in
assets traded in the year (excl. CEREIT)
Retail funds operating profit of $3.8 million (FY17 $8.2
million). Variance driven by $4.7 million in total income from
the Cromwell Riverpark Trust extension in prior year
Total AUM was up 14% ($1.4 billion) to $11.5 billion driven by Five year growth in AUM ($bn)1
the successful IPO of CEREIT:
Wholesale AUM $6.7 billion (FY17 $5.4 billion)
Internal AUM $2.8 billion (FY17 $2.9 billion)
Retail AUM $2.0 billion (FY17 $1.8 billion)
1) Includes 45% of Phoenix Portfolios AUM, 50% of Oyster Group AUM as at 30 June 2018.
CMW – FY18 Results 27Funds Management – CEREIT Debuts and Outperforms
€ 0.65
CEREIT now has two consecutive quarters of results after
successful listing on Singapore Exchange Securities Trading Limited
€ 0.60
(the SGX-ST) on 30th November 2017
€ 0.55
Exceeded IPO forecast for all key performance metrics, maiden
distribution of 2.53 euro cents per unit expected September 20183
€ 0.50
Effective annualised distribution yield of 7.9% based on €0.55 per
unit IPO price) 3 € 0.45
CEREIT FSTREI Index
CEREIT gearing has reduced to 31%. It’s focused on organic value € 0.40
creation through active asset management and is pursuing a
number of portfolios to support its inorganic growth ambitions3
Operational presence in Singapore, the largest wealth management Balanced Asset Class Diversified Geography
centre in Asia, has demonstrably increased Cromwell’s exposure to Exposure2 Exposure2
local institutional investors and other capital providers 10% 6%
8%
33%
43%
23%
47%
30%
1) Others include three government-let campuses, one retail property and one hotel in Italy on master lease
Light Industrial / Logistics Denmark Germany France
2) Based on Valuations as at 31 March 2018
Office
3) CEREIT financial results for second quarter ended 30 June 2018 and the Financial Period from 30 Italy Netherlands
November 2017 to 30 June 2018 Others 1
CMW – FY18 Results 28Funds Management – Heavy Wholesale Trading Volume
Strong activity in wholesale funds segment with $4.7 billion of assets traded
Australia. JV with Early Light International at Northpoint Tower announced
and discussions for further investment opportunities have commenced
CEE. Strategic partnership with Linkcity (Bouygues Construction) to rollout a
portfolio of logistics assets, assets >25% of the portfolio (by value) identified
Czech Republic. Sold Cestlice Business Park in Prague for €17.5 million
Finland. Appointed to €108.5 million portfolio by Goldman Sachs
Italy. Established platform in Italy with €428 million of assets as at 30 June
Netherlands. Most active market, selling, and then also acquiring more than
$1 billion in assets. Mandated on Blaak 555 in Rotterdam with JV partner
New Zealand. Global investment firm KKR completed NZ$209 million Blaak 555, Rotterdam
Corporate Centre deal in partnership with Oyster group
Poland. More than 150,000 sqm of leases in 200 deals. Sold the Warsaw
Corporate Centre for €27.8 million on a net initial yield of < 7%, 21% IRR
Singapore. Discussions with ARA ongoing and productive in relation to
Cestlice Business Park,
European initiatives, have already bid on significant assets Prague
UK. Started 7,000 sqm Next store in Plymouth and sold Imperial Palace for
£62.5 million after a comprehensive asset management programme
29
Imperial Palace, Warsaw Corporate Centre,
Borehamwood, UK Poland
CMW – FY18 Results 29Funds Management – Retail Funds Continue to Perform
Cromwell Direct Property Fund (DPF)
DPF purchased its fourth direct asset in Brisbane for $42 million
Performance since inception (Aug 2013) is 11.0% annualised
Highly recommended rating from independent research
houses Lonsec and Zenith
Fund is ready for further opportunity with no direct gearing
Listed Securities Funds
Cromwell Phoenix Property Securities Fund reopened in October
2017 and is attracting strong inflows
Cromwell Phoenix Opportunities Fund is now closed to
investment having generated annualised returns of more than
20% since inception in December 2011
Retail Investor Engagement Strategy Maintained
Education strategies to build prospect database and engage with
investors via quarterly magazine ‘Insight’ have been successful
with highly favourable Net Promoter Score received
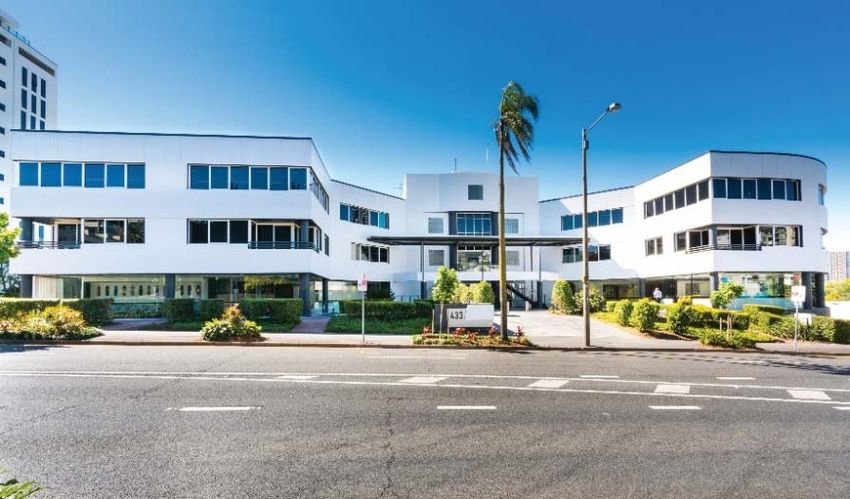
433 Boundary Street, Spring Hill, Brisbane
CMW – FY18 Results 30Funds Management – Retails Funds Continue to Perform
Fully Subscribed Funds – Cromwell Ipswich City Heart Trust
Voting has commenced to extend the term of the Trust from
December 2018 to June 2023
Trust has returned 14.0% per annum since inception in
December 2011
Distributions forecast to increase to 11 cents per unit from 1
January 2019, reflecting a 7.8% yield on the current unit price1
Queensland State government occupy 90% of the NLA and
have more than 10 years remaining on initial term
Preliminary non-binding feedback from unitholders indicated
strong support for extending the term2
Unitholder meeting set for 26th September 2018
1) Please refer to the Notice of Meeting and Explanatory memorandum dated 22 August 2018 for further information,
www.cromwell.com.au/ichvote
2) Based on participation from 53% of unitholders on the register
CMW – FY18 Results 31Funds Management – Oyster Group Reaches NZ$1.4bn
AUM at Oyster Group in New Zealand (50% interest) was
up 15% to NZ$1.4 billion (FY17 $1.2 billion). Activity during
the rear included;
Purchase of the 6.2 hectare Central Park Corporate Centre
for NZ$209 million with joint venture partner, KKR, settled
Oyster Direct Property Fund, with exposure to over
NZ$550 million in commercial property assets, settled the
purchase of 107 Harris Road, East Tamaki, Auckland
Sale of 2 Kitchener Street, Auckland was settled, returning Central Park Centre, Greenlane, Auckland
core retail investors an 8.6% IRR over 11 years
Sale of 102 Rosedale Road, Albany, Auckland was settled,
returning core retail investors an 8.5% IRR over 7 years
Oyster appointed experienced company director, Joanna
Perry, as first independent chair of the board
107 Harris Road, East Tamaki, 2 Kitchener Road, 102 Rosedale Road,
Auckland Auckland Albany, Auckland
CMW – FY18 Results 32SECTION 5 Outlook and Guidance
Outlook - Australian Economic Growth Moderate
Australia continues to slowly re-balance away from
resources to more broad-based economic growth
Business confidence has climbed higher and capex surveys
are positive for non-mining business investment. Public
investment is supportive, with some major infrastructure
projects underway
However, consumer spending is likely to be subdued for
some time and residential building, which has been a strong
driver of growth, is now falling and will be a drag for the
next few years
Also at US$0.75 the Australian dollar is providing only
lacklustre support to exports and overall economic
Source: NAB/JLL. As at 30 June 2017
competitiveness
Australian GPD Growth Rate
Trade wars, China’s continued slowdown and other
geopolitical risks all provide negative downside risk
GDP growth is expected to remain within its current band of
2 to 3% p.a. with RBA unlikely to increase rates before late
2019
Cromwell’s strategy is to seek some measured exposure
outside of Australia for diversification purposes
Source: Trading Economics.com, Australian Bureau of statistics
CMW – FY18 Results 34Outlook – Offshore Capital Continues to Chase Assets
Occupational
Sydney and Melbourne CBDs have strong underlying demand with
low vacancy rates, and this is spilling over to fringe locations
Low supply and withdrawn stock in Sydney will keep markets in
favour of landlords. Melbourne has more supply coming on stream
Both markets are in a development phase, opening up
opportunities for new projects, refurbishment and re-positioning
Vacancies continue to remain high elsewhere particularly in the
mining states (PER 19.4%, BNE 14.6%)
Investment
Source: PCA
Investor demand for offices across Australia’s capital cities
Foreign investment transaction volume by asset type
continues to be strong, particularly from offshore capital which
continues at elevated levels
This is driving a continued tightening of yields across the board
that, in some cities, is at odds with prevailing conditions
Cromwell’s strategy is to seek some measured exposure
outside of Australia for diversification purposes
Source: Real Capital Analytics
CMW – FY18 Results 35Outlook - European Economic Recovery Pauses
Eurozone economic growth slowed in the first two quarters of EU GDP Growth Rate Maintained
2018 but is still expected to be >2.0% for 2018
The purchasing managers index (PMIs) subsequently rose
again in June, driven by stronger activity in services
Rising European bond yields are also reflecting prospects of
stronger Eurozone growth as well as tighter monetary policy
(ECB has begun QE tapering, UK has raised rates)
Risks remain however (Trade Wars and Brexit) especially for
the externally-oriented manufacturing sector
Source: Tradingeconomics.com
There is ongoing momentum in the European economy – Global Capital Flows to Europe
stronger labour markets and increasing capital investment are
generally boosting confidence and extending the cycle
Cromwell has invested in Europe for diversification
purposes and to benefit from the European economic
recovery and strong demand for commercial real estate
CMW – FY18 Results Source: Cushman & Wakefield, RCA
36Outlook - European Commercial Real Estate
Occupational Transactional Volume
The desire for quality space has pushed prime rental rates in some CBD
and City Centre locations high enough that occupiers are being forced to
consider non-CBD and more peripheral, secondary locations
Occupier demand has eroded availability and pushed down the vacancy
rate to c6.5% across the significant European office markets
Europe is suffering from a lack of quality supply. Until construction catches
up most markets favour landlords with serviced office providers stepping in
to provide short-term solutions particularly in central locations
Investment
Investments by Sector
Europe’s property market paused in Q1 2018 with ‘just’ €56.5 billion
transacting, after a record breaking Q4 2017 where €90.1 billion transacted
Strong demand for offices is continuing to put downward pressure on yields
and the yield gap between secondary and prime is narrowing
UK surprised on the upside showing the resilience of core London
assets, Netherlands, Italy and Finland were strong. Spain, Sweden
and Ireland saw falls with low yields in Germany muting interest
Sources:
Savills – Market report European Offices May 2018
CMW – FY18 Results Savills – Market In Minutes European Investment June 2018 37FY19 Guidance
For further information please contact:
Strong balance sheet with low gearing, extended debt tenor coupled with
Paul Weightman
long WALE and favourable lease expiries leaves business well-positioned
CEO / Managing Director
‘Invest To Manage’ strategy will look to use capital profits and other paul.weightman@cromwell.com.au
Phone: +61 7 3225 7720
capital sources to fund seeding and (temporary) warehousing of assets in
order to accelerate AUM growth Michael Wilde
Chief Financial Officer
Pipeline opportunities have been identified and investments have already michael.wilde@cromwell.com.au
begun to be made into some of these opportunities Phone: +61 7 3225 7729
Cromwell is actively liaising with investors from East Asia, Japan, Europe Ross McGlade
and North America seeking portfolio and single asset opportunities Investor Relations Manager
ross.mcglade@cromwell.com.au
Cromwell has significant liquidity and assets available to be recycled and Phone: +61 2 8278 3613
has already invested into opportunities which will generate operating profit
growth in the medium term
Investor Services Brisbane Office Sydney Office London Office Auckland Office Singapore Office
1300 276 693 200 Mary Street Level 14 64 North Row Oyster Property Group 50 Collyer Quay
invest@cromwell.com.au Level 19, 200 Mary Street 167 Macquarie Street London, W1K 7DA Level 2, 14 Normanby Road, #07-02 OUE Bayfront
www.cromwell.com.au Brisbane QLD 4000 Sydney NSW 2000 UK Auckland, New Zealand Singapore 049321
CMW – FY18 Results 38FY19 Guidance
For further information please contact:
Guidance assumes maintainable transactional and funds management
revenues consistent with historical performance Paul Weightman
CEO / Managing Director
Guidance does not include potential impact of investments into platform, paul.weightman@cromwell.com.au
Phone: +61 7 3225 7720
“Invest to Manage strategy” or application of existing Balance Sheet liquidity.
Updates will be provided when these occur Michael Wilde
Chief Financial Officer
Guidance assumes reinvestment of some distributable cash back into the michael.wilde@cromwell.com.au
Business for further growth. Phone: +61 7 3225 7729
Distribution payout ratio of approximately 90% of operating earnings Ross McGlade
to be targeted in FY19 Investor Relations Manager
ross.mcglade@cromwell.com.au
10% of operating earnings to be reinvested in FY19 Phone: +61 2 8278 3613
Investor Services Brisbane Office Sydney Office London Office Auckland Office Singapore Office
1300 276 693 200 Mary Street Level 14 64 North Row Oyster Property Group 50 Collyer Quay
invest@cromwell.com.au Level 19, 200 Mary Street 167 Macquarie Street London, W1K 7DA Level 2, 14 Normanby Road, #07-02 OUE Bayfront
www.cromwell.com.au Brisbane QLD 4000 Sydney NSW 2000 UK Auckland, New Zealand Singapore 049321
CMW – FY18 Results 39FY19 Guidance
Initial Guidance: For further information please contact:
Paul Weightman
FY19 operating earnings expected to be not less than 8.00 cps
CEO / Managing Director
FY19 distributions expected to be not less than 7.25 cps paul.weightman@cromwell.com.au
Phone: +61 7 3225 7720
Michael Wilde
Chief Financial Officer
michael.wilde@cromwell.com.au
Phone: +61 7 3225 7729
Ross McGlade
Investor Relations Manager
ross.mcglade@cromwell.com.au
Phone: +61 2 8278 3613
Guidance Yield
Operating Earnings: 8.00 cps1 6.96%2
Distributions: 7.25 cps1 6.30%2
Investor Services Brisbane Office Sydney Office London Office Auckland Office Singapore Office
1300 276 693 200 Mary Street Level 14 64 North Row Oyster Property Group 50 Collyer Quay
invest@cromwell.com.au Level 19, 200 Mary Street 167 Macquarie Street London, W1K 7DA Level 2, 14 Normanby Road, #07-02 OUE Bayfront
www.cromwell.com.au Brisbane QLD 4000 Sydney NSW 2000 UK Auckland, New Zealand Singapore 049321
1) FY19 guidance
2) Based on CMW closing share price of $1.15 as at 22 August 2018
CMW – FY18 Results 40APPENDICES Additional Information
Appendices - Contents
Cromwell Property Group Statistics 43
Local European Footprint 44
CEREIT Portfolio Overview 45
Sustainability 46
FY18 Operating and Statutory Profit - Reconciliation 47
Segment Result - Operating Earnings Detail 48
Property Portfolio - Top 10 Assets 49
Property Portfolio - Top 20 Leases 50
Property Portfolio - Net Property Income 51,52
Property Portfolio - Movement in Book Value 53
Property Portfolio - Debt Platform Facility Details 54
CMW – FY18 Results 42Cromwell Property Group Statistics
Diverse Product Range Track Record of Successful Partnerships Extensive and Broad Skill Set
Portfolio Platform AUM by Sector
Office
11.5bn
9.2%
$
AUM 380+ 5.7%
12.6%
Retail
people Industrial /
Logistics
54.4%
Property
320+ 18.1% Securities
Other
properties 15
countries AUM by Geography
4.0m 6.1%
sqm
30 Europe
3,800+ offices 39.1% 54.8% Australia
NZ
tenants
CMW – FY18 Results 43Local European Footprint
20 regional offices providing on the ground local market knowledge and expertise
European Portfolio by Geography
11% 11%
9% 8%
€3.9bn
24% 25%
12%
Italy UK Benelux Nordics CEE Germany France
European Portfolio by Sector
5%
BENELUX GERMANY ITALY UK 22%
Amsterdam Berlin Milan Edinburgh
€3.9bn
46%
Luxembourg Düsseldorf NORDICS Leeds
CEE Frankfurt Copenhagen London
Bucharest Hamburg Helsinki Scarborough 27%
Prague Munich Malmö FRANCE
Warsaw Stockholm Paris
Office Retail Industrial other
CMW – FY18 Results 44CEREIT Portfolio Overview
Unique opportunity to invest in scale and diversification across Europe
Properties1 75
Occupancy Rate (by LA)1,3 88.7%
Denmark
Properties 13
Valuation (€ million)2,4 1,390.4
Lettable Area (sq m)1 151,483
WALE / WALB1 4.9 years / 4.1 years Valuation (€ million)2 81.4
% Freehold 88%5 % of Portfolio2 5.9%
Average Cap Rate 7.0%
Netherlands
Germany
Properties 15
Properties 11
Lettable Area (sq m)1 206,304
Lettable Area (sq m)1 166,458
Valuation (€ million)2 469.6
Valuation (€ million)2 107.8
% of Portfolio2 33.8%
% of Portfolio2 7.8%
Average Cap Rate 4.9%
Average Cap Rate 5.7%
France
Properties 21 Italy
Lettable Area (sq m)1 332,811 Properties 15
Valuation (€ million)2 313.7 Lettable Area (sq m)1 308,765
% of Portfolio2 22.6% Valuation (€ million)2,4 418.0
Average Cap Rate 6.5% % of Portfolio2 30.1%
______________________
Average Cap Rate 6.4%
1. As at 30 June 2018
2. Valuation as at 31 March 2018
3. Assumes Milano Piazza Affari is 100% leased in view of the rental guarantee
4. Valuation for Ivrea conducted as at 1 April 2018
5. % Freehold & Continuing or perpetual leasehold
CMW – FY18 Results 45Committed To A Sustainable Business
Cromwell is committed to building a sustainable business for all stakeholders, across its five pillars
framework inclusive of a sustainable target distribution payout ratio that allows for reinvestment in
people, platform and capital accretive investment opportunities
2018 saw a number of new milestones achieved including:
Commitment to achieving certification under the National Carbon Offset Scheme (NCOS) for
business operations achieving 71 % offset of corporate emissions, completing first NCOS audit
Soward Way achieves 5 star GBCA green star certification for design and construction
German Portfolio energy contract changed to renewable energy
Commenced implementation of policies regarding supply chain governance in advance of the
Australian regulatory changes
Completed external Materiality Analysis for CEREIT in preparation for its first report
Increased GRESB participation of Australian property portfolio and funds to over 97% by NLA
and EU funds by 12% to 72% by area
Appointed Chief Sustainability Officer in 2018, direct report to Group CEO
CMW – FY18 Results 46FY18 Operating and Statutory Profit Reconciliation
FY18 ($M) FY17 ($M)
Profit from operations 156.8 152.2
Operating EPS (cents per security) 8.36 8.65
(Loss) on sale of investment properties (5.0) (0.9)
Gain on sale of listed securities 15.7 -
Finance costs attributable to disposal group/other assets (2.1) -
Other transaction costs (5.7) -
Fair value net gain / (loss)
Investment properties 77.4 125.0
Derivative financial instruments (13.7) 17.1
Investments at fair value through profit or loss (3.5) 14.2
Non-cash property investment income / (expense)
Straight-line lease income 27.8 3.6
Lease incentive amortisation (17.8) (18.0)
Lease cost amortisation (1.7) (1.9)
Other non-cash or non-recurring items:
Amortisation of finance costs (21.2) (7.7)
Net exchange (loss) / gain on foreign currency borrowings (10.3) 1.0
Net (decrease) / increase in recoverable amounts (76.1) 0.7
Amortisation and depreciation, net of deferred tax expense1 (4.4) (6.8)
Relating to equity accounted investments2 94.8 (1.7)
Net foreign exchange loss (3.2) (0.7)
Net profit from discontinued operations 1.5 0.3
Restructure Costs3 (4.7) -
Net tax losses incurred / (utilised)4 (0.5) 1.1
Statutory Profit for the year 204.1 277.5
Statutory EPS (cents per security) 10.89 15.78
1) Comprises depreciation of plant and equipment and amortisation of intangible assets, including management rights and associated deferred tax liability
2) Comprises fair value adjustments included in share of profit of equity accounted entities
3) Relates to the transition of funds management responsibilities for the CEREIT portfolio from Europe to Singapore
4) Comprises tax expense attributable to changes in deferred tax assets recognised as a result of carried forward tax losses
CMW – FY18 Results 47Segment Result – Operating Earnings Detail
Property Asset Services Funds Management Funds Management Funds Management FY18
Full Year ending 30 June 2018
Investment ($M) ($M) Internal ($M) Retail ($M) Wholesale ($M) ($M)
Segment revenue
Sales – external customers 199.6 8.6 0.2 8.6 81.7 298.7
Sales - intersegmental 1.1 6.4 14.2 - - 21.7
Operating profits of equity accounted investments 5.4 - 22.0 1.7 1.2 30.3
Distributions - - 0.1 - 5.4 5.5
Interest - - 5.8 0.2 0.5 6.5
Other revenue 0.9 - - - - 0.9
Total segment revenue and other income 207.0 15.0 42.3 10.5 88.8 363.6
Segment expenses
Property expenses and outgoings (32.9) - - - - (32.9)
Funds management costs - - (0.2) (2.6) - (2.8)
Property development costs - (0.6) - - - (0.6)
Finance costs (37.1) - (5.0) - (3.8) (45.9)
Expenses - intersegmental (20.6) (0.4) (0.6) (0.1) - (21.7)
Employee benefits expense - (7.7) (11.8) (1.6) (43.9) (65.0)
Administration and overhead costs (1.4) (3.1) (4.3) (0.5) (24.1) (33.4)
Total segment expenses (92.0) (11.8) (21.9) (4.8) (71.8) (202.3)
Tax expense - (1.0) (1.0) (1.9) (0.6) (4.5)
Segment profit for the year 115.0 2.2 19.4 3.8 16.4 156.8
Segment contribution to operating profit 73% 2% 12% 2% 11% 100%
Weighted Average Securities on Issue ('000) 1,876.4
CMW – FY18 Results 48Property Portfolio – Top 10 Assets
Book Value Occupancy %
Asset State Class Cap Rate WALE Major Tenants
($M) by NLA
Qantas HQ NSW Office 490.0 5.25% 100.0% 13.2 years Qantas Airways Limited
Northpoint Tower1 NSW Mixed use 297.3 5.25% 89.2% 5.2 years CPT Operations, Griffith Hack, Zurich
Kent Street, Sydney NSW Office 279.0 5.75% 99.5% 3.5 years Symantec, Mann Judd, IOOF
700 Collins Street VIC Office 271.0 5.50% 99.7% 7.2 years Bureau of Meteorology, Metro Trains
Soward Way ACT Office 260.0 5.25% 100.0% 14.2 years Federal Government
McKell Building NSW Office 245.0 5.38% 100.0% 10.0 years NSW State Government
HQ North Tower QLD Office 217.0 6.75% 98.5% 4.1 years AECOM, Technology One
Victoria Avenue NSW Office 211.0 6.25% 91.4% 3.1 years Reed Elsevier
200 Mary Street QLD Office 74.0 7.25% 87.7% 2.8 years Secure Parking, Cromwell, Logicamms
TGA Complex ACT Office 57.0 9.25% 100.0% 4.0 years Federal Government
Total Top 10 Assets 2,401.3 5.73% 97.2% 7.5 years
Balance of Portfolio 348.0 8.02% 87.1% 5.9 years
Total 2,749.3 6.04% 94.1% 7.2 years
1) Represents Cromwell’s 50% interest in Northpoint Tower.
CMW – FY18 Results 49Property Portfolio – Top 20 Leases
Tenant Tenant Classification Expiry Date % of Portfolio Rental Income
Qantas Airways Limited Listed Company/Subsidiary Dec-32 14.8%
Commonwealth of Australia (Dept of Social Services) Government Authority Sep-32 8.2%
Government Property NSW Government Authority Jun-28 7.2%
AECOM Australia Pty Ltd Listed Company/Subsidiary Apr-20 5.3%
Bureau of Meteorology Government Authority Jul-26 4.1%
Calvary Healthcare Adelaide PTY LTD Private Company Jul-19 4.1%
Therapeutic Goods Administration Government Authority Jun-22 3.9%
Metro Trains Melbourne Pty Ltd Private Company Feb-25 2.9%
Technology One Limited Listed Company/Subsidiary Apr-26 2.5%
Reed Elsevier Australia Pty Limited Listed Company/Subsidiary Dec-20 2.5%
Symantec (Australia) Pty Ltd Listed Company/Subsidiary Jul-21 2.4%
Government Property NSW Government Authority Jun-28 1.8%
Government Property NSW Government Authority Jun-28 1.6%
LDK Tuggeranong Pty Ltd Private company Mar-28 1.6%
Department of Prime Minister and Cabinet Government Authority Mar-19 1.4%
Commonwealth of Australia (ANAO) Government Authority Sep-30 1.4%
Government Property NSW Government Authority Jun-28 1.3%
Government Property NSW Government Authority Jun-28 1.3%
Ventia Pty Ltd Private Company Feb-23 1.2%
CS Energy Limited Government Authority Jun-23 1.2%
70.9%
CMW – FY18 Results 50Property Portfolio – Net Property Income1
FY18 ($M) FY17 ($M) Variance ($M) Variance (%)
200 Mary Street 5.7 4.9 0.8 16.3%
700 Collins Street 16.0 14.0 2.0 14.3%
HQ North Tower 18.3 17.4 0.9 5.2%
Kent Street, Sydney 14.2 13.6 0.6 4.4%
Qantas HQ 28.1 27.2 0.9 3.3%
TGA Complex 7.0 6.9 0.1 1.4%
McKell Building 12.3 12.2 0.1 0.8%
19 National Circuit 3.1 3.1 0.0 0.0%
Station Street, Penrith 2.7 2.7 0.0 0.0%
Lovett Tower 2.3 2.3 0.0 0.0%
Bull Street, Newcastle 1.7 1.7 0.0 0.0%
Farrer Place, Queanbeyan 2.0 2.1 (0.1) (4.8%)
Crown Street, Wollongong 2.7 2.8 (0.1) (3.6%)
Tuggeranong Office Park/Soward Way 13.5 14.5 (1.0) (6.9%)
Victoria Avenue 13.0 14.5 (1.5) (10.3%)
Oracle Building 2.4 3.1 (0.7) (22.6%)
Office Total 145.0 143.0 2.0 1.4%
1) Includes only properties held for all of FY17 and FY18. Northpoint is equity accounted and therefore excluded from above analysis
CMW – FY18 Results 51Property Portfolio – Net Property Income1
FY18 ($M) FY17 ($M) Variance ($M) Variance (%)
Village Cinema Geelong 1.3 1.3 0.0 0.0%
Regent Cinema Centre 1.3 1.3 0.0 0.0%
Retail Total 2.6 2.6 0.0 0.0%
TOTAL HELD PROPERTIES1 147.6 145.6 2.0 1.4%
Wakefield St, Adelaide 4.4 - 4.4 N/A
Forestry House, Brisbane 6.4 6.5 (0.1) (1.5%)
Huntingfield Avenue (0.2) (0.3) 0.1 (33.3%)
Musk Avenue 4.4 7.0 (2.6) (37.1%)
Bundall Corporate Centre (0.2) 7.3 (7.5) (102.7%)
Health House, Brisbane (0.4) 8.8 (9.2) (104.5%)
Sold /Purchased Assets Total 14.4 29.3 (14.9) (50.9%)
Borrowdale House (0.1) (0.1) - 0.0%
Sturton Rd, Edinburgh Park - (0.1) 0.1 (100.0%)
Car Parking / Mary St Hub (0.4) (0.2) (0.2) 100.0%
Consolidation adjustments / eliminations 5.3 5.5 (0.2) (3.6%)
Other Total 4.8 5.1 (0.3) (5.9%)
TOTAL NET PROPERTY INCOME 166.8 180.0 (13.2) (7.3%)
1) Includes only properties held for all of FY17 and FY18. Northpoint is equity accounted and therefore excluded from above analysis
CMW – FY18 Results 52Property Portfolio – Movement In Book Value
Strategy of continuously improving portfolio through acquisitions since 2010
Recycling of capital means disposing of assets before asset has large capex requirements
In-sourced facilities management model also lowers lifecycle capex
Average Lifecycle Capex as a percentage of average assets is 0.21% of valuation since 2010
FY18 FY17 FY16 FY15 FY14 FY13 FY12 FY11 FY10
($M) ($M) ($M) ($M) ($M) ($M) ($M) ($M) ($M)
Opening balance 2,357.8 2,274.0 2,101.0 2,249.5 2,396.0 1,724.4 1,444.9 1,064.1 1,117.2
Acquisitions 51.8 - - 8.0 - 661.3 263.4 322.4 -
Construction Costs 13.6 92.3 47.2 - - - - - -
Finance costs capitalised 1.1 4.4 - - - - - - -
Property Improvements 6.7 9.2 2.1 16.5 44.5 76.3 50.2 40.4 1.3
Lifecycle Capex 2.5 3.0 2.6 6.8 6.8 6.3 2.6 3.0 2.2
Disposals (89.3) (87.1) (150.9) (205.8) (250.0) (42.4) (39.3) (33.7) (22.1)
Transferred to held for sale (0.9) (69.5) - (36.6) - - - - -
Straight Lining of Rental Income 27.8 3.6 2.3 5.5 5.6 6.0 6.9 4.9 0.8
Lease costs and incentives 22.1 22.8 21.7 37.7 11.9 29.3 15.8 15.9 2.2
Amortisation of leasing costs and incentives (19.5) (19.9) (15.2) (13.0) (11.6) (9.5) (7.7) (5.8) (5.4)
Net gain/(loss) from fair value adjustments 77.4 125.0 263.2 32.4 46.3 (55.7) (12.4) 33.7 (32.1)
Balance 2.451.1 2,357.8 2,274.0 2,101.0 2,249.5 2,396.0 1,724.4 1,444.9 1,064.1
Lifecycle Capex as a % on average assets 0.10% 0.13% 0.12% 0.31% 0.29% 0.31% 0.16% 0.24% 0.20%
CMW – FY18 Results 53You can also read