Locomotive Workshop, ATP, Eveleigh - Economic Impact Assessment October 2017 - Major Projects
←
→
Page content transcription
If your browser does not render page correctly, please read the page content below
Locomotive Workshop, ATP, Eveleigh
            Economic Impact Assessment

                          October 2017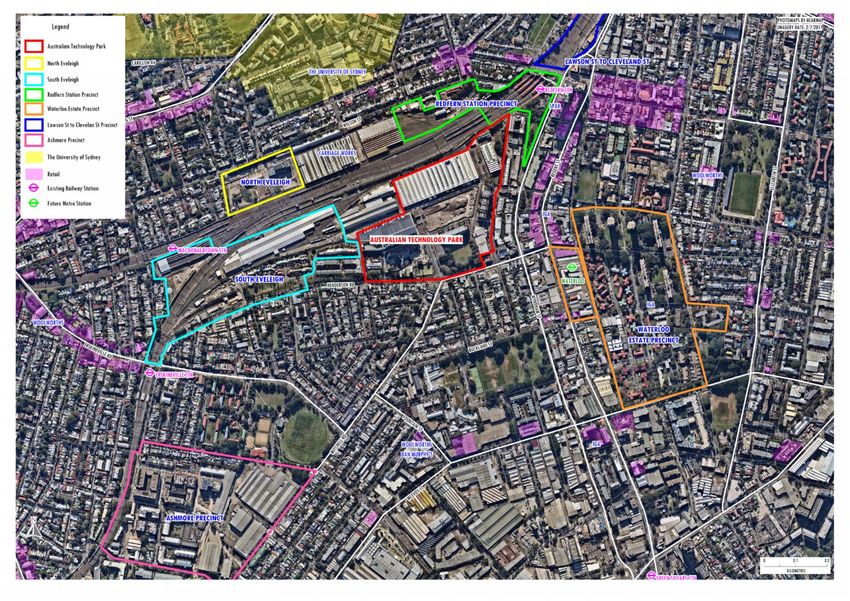
MacroPlan Dimasi

MELBOURNE                                   SYDNEY
Level 16                                    Level 52
330 Collins Street                          19 Martin Place
Melbourne VIC 3000                          Sydney NSW 2000
(03) 9600 0500                              (02) 9221 5211
BRISBANE                                    GOLD COAST
Level 15                                    Level 2
111 Eagle Street                            89 - 91 Surf Parade
Brisbane QLD 4000                           Broadbeach QLD 4218
(07) 3221 8166                              (07) 3221 8166
PERTH
Level 1
89 St Georges Terrace
Perth WA 6000
(08) 9225 7200

Prepared for: Mirvac

MacroPlan Dimasi staff responsible for this report:

James Turnbull, National Manager – Retail
Fraser Brown, Manager – Retail
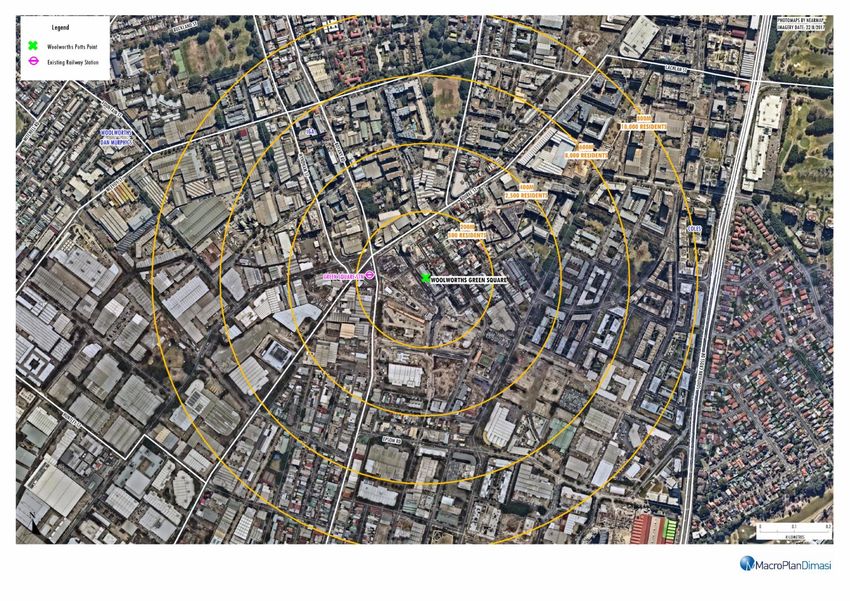
Table of contents

Executive summary                                           i

Introduction                                               vi

Section 1:     Site context and proposed development        1

      1.1    Site location and context                      1
      1.2    Proposed development scheme                    6
      1.3    Comparison with other precincts               13

Section 2:     Trade area analysis                         17

      2.1    Resident trade area                           17
      2.2    Worker trade area                             29
      2.3    Other customer segments                       36

Section 3:     Competitive context                         38

      3.1    Existing supply                               38
      3.2    Supply competition                            42

Section 4:     Retail floorspace and market gap analysis   45

      4.1    Projected supermarket demand and market gap   45
      4.2    Projected retail floorspace demand            49
      4.3    Summary                                       51

Section 5:     Estimated trading impacts                   52

      5.1    Purpose of impacts assessment                 52
      5.2    Indicative sales performance                  53
      5.3    Potential trading impacts                     54

Section 6:     Other economic benefits                     61

      6.1    Employment benefits                           61
      6.2    Other community benefits                      63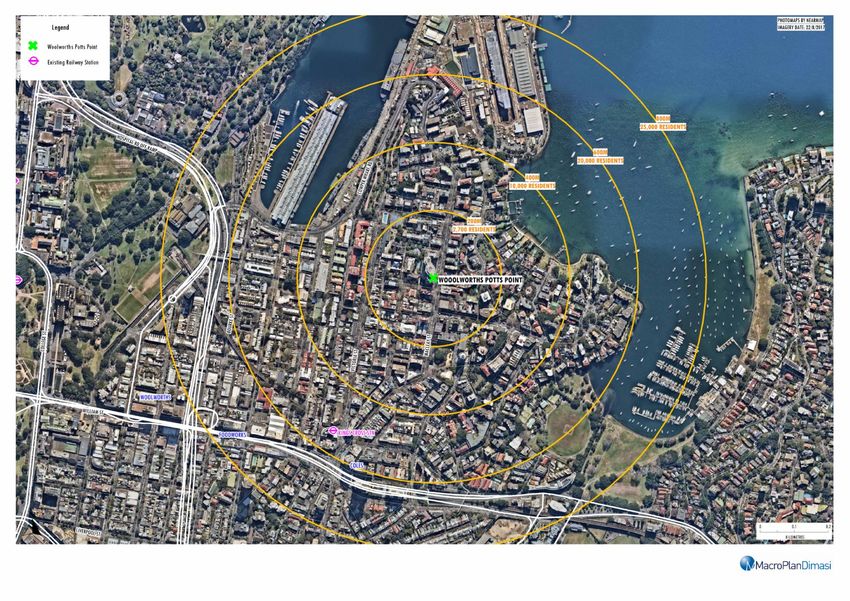
Executive summary
The Australian Technology Park (ATP) is a modern, specialised business park, located on
the southern side of the inner west railway line. The Locomotive Workshop, which is the
subject of this report, is situated at the northern end of ATP.
The broader area, including Eveleigh, Waterloo, Redfern, Zetland and Ashmore is
currently, undergoing significant urban regeneration and intensification. At present this
area is under supplied in terms of retail floorspace, in particular supermarket/everyday
stores.
The development at the subject site is proposed to include around 7,339 sq.m of
floorspace, including a 2,032 sq.m supermarket offering, 1,337 sq.m of retail specialty
floorspace, 750 sq.m of activated exhibition and cultural heritage space blended with
retail, 571 sq.m of exhibition interpretation space and 2,649 sq.m of non-retail
floorspace. While the provision of floorspace within the Locomotive Workshop represents
only around 5% of total floorspace at ATP, it is a key activator of the precinct, and will
service residents, workers and visitors.
The proposed offer will not be a traditional “shopping centre”, rather it will involve
elements of production, education, manufacturing, wholesale and dining in a setting that
is sympathetic to the heritage significance of the building. The critical mass of facilities
proposed will create a focal point for the surrounding residents and workers, capitalising
on the site’s proximity to public transport.
The proposed retail offer being considered at the subject site is explicitly designed to
attract visitors to the precinct to enable the heritage value to be more broadly realised
than it would otherwise be. The combination of factors will activate both the Locomotive
Workshop and Innovation Plaza.
The proposed retail mix will include everyday offerings (inc. supermarket and specialty
retail) that will serve of surrounding community of workers, residents, students as well as
other visitors. The proposed offer is not intended to be activated intermittently, like
Locomotive Workshop, ATP, Eveleigh
i
Economic Impact Assessment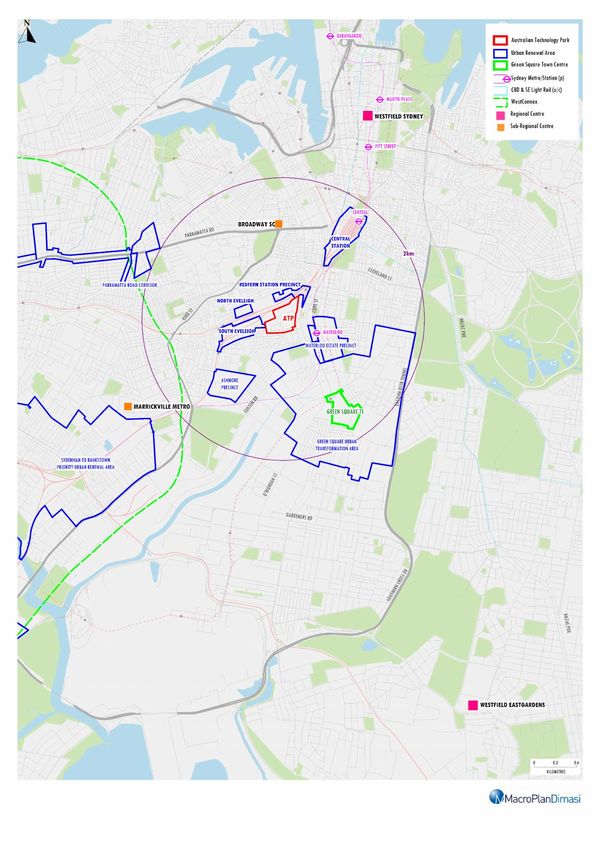
Executive summary
event style retail (e.g. weekend markets), as this tends to have much greater impact on
the days of operation, typically in the form of traffic congestion and parking impacts on
local residents.
In our view, specialty retail that will help to activate the Innovation Plaza cannot be
sustained successfully in a non-residential precinct without an everyday anchor tenant
such as a supermarket or a larger food offering.
Other anchors have been considered, but are unsuitable. Cinemas are essentially an
evening activator only and typically form part of a larger more established offer – noting
there are cinemas at Newtown and some being developed at Green Square Town Centre
and Central Park Mall. Hence not driving the day traffic into the Locomotive Workshop
during the day to support the specialty retail.
Department and discount department stores (DDS) require considerably larger
floorplates, and tend to co-locate with non-food uses in shopping centres as opposed to
local neighbourhood precincts.
The proposed retail at ATP has the potential to service four customer segments, namely
local residents; nearby workers; students; and other visitors.
The resident main trade area population is estimated at 34,660 as at June 2017, including
7,260 residents in the key primary sector, and is projected to grow to 56,360 by 2031,
reflecting an average annual growth rate of 3.5%.
Based on information from the ABS and Transport for NSW, the worker trade area
population is currently estimated at 8,340 persons, including 3,710 workers in the key
primary sector. The worker trade area population is estimated to grow at an average
annual rate of 7.6% to reach 23,390 by 2031, with the majority of this growth driven by
the development of commercial and retail facilities within ATP.
There are a number of competitive retail facilities throughout the broader area, including
higher order facilities such as Broadway SC and Marrickville Metro; supermarket based
centres such as East Village and Dank Street Plaza; and strip and street based retail
precincts such as Alexandria, Redfern, Erskineville and Redfern.
Locomotive Workshop, ATP, Eveleigh
ii
Economic Impact Assessment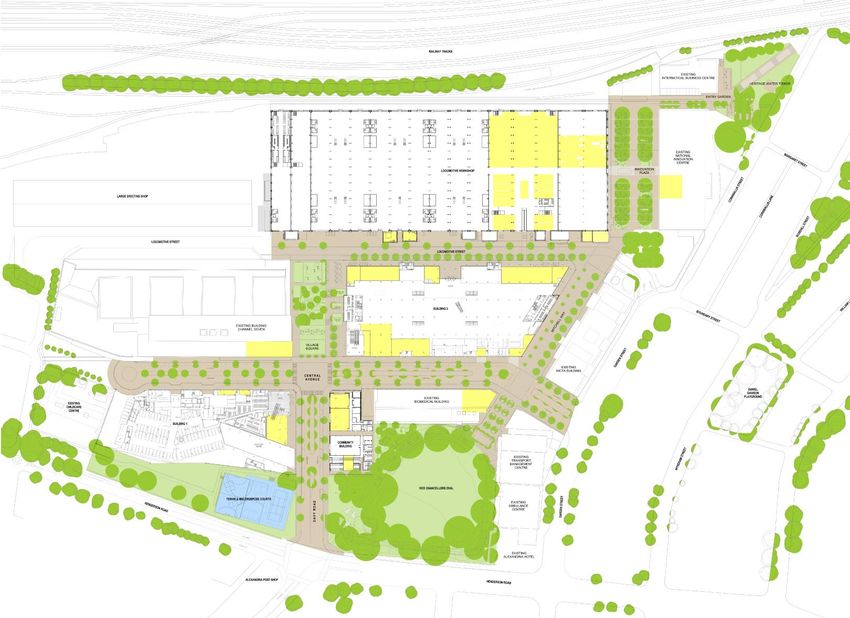
Executive summary
We have identified a main trade area supermarket floorspace gap of 4,235 sq.m at
present, which would increase to 7,940 sq.m by 2031, even with the addition of the
proposed supermarket facilities at the subject site and the Ashmore Street precinct, as
well as allowing for the approved small supermarket at Building 2 (i.e. for CBA).).
At 2017, the resident main trade area generates demand for 92,500 sq.m of retail
floorspace. By 2031, total retail floorspace demand from the resident main trade area is
estimated to grow by 73%, to 156,700 sq.m.
The worker trade area population generates demand for around 4,700 sq.m of retail
floorspace. Over the period to 2031, worker trade area retail floorspace demand is
estimated to grow by around 210%, or around 10,000 sq.m, to 14,530 sq.m by 2031.
Having regard for some trade area overlap of around 6% (i.e. people who are residents
and workers in the main trade area), the total retail floorspace demand of the combined
resident and worker trade area populations is estimated to increase from 96,900 in 2017
to 173,300 by 2031, reflecting total growth of around 79%.
The proposed 4,119 sq.m of retail floorspace proposed at the Locomotive Workshop
subject site accounts for around 4.3% of total floorspace demand at 2021 and 2.4% of
total floorspace demand at 2031. Furthermore, the proposed retail floorspace at the
subject site accounts for around 5.4% of retail floorspace demand growth between
2017 and 2031, indicating that the additional facilities proposed at the subject site can
easily be absorbed by the market.
Based on our analysis, the small supermarket approved at the Building 2 site is not
sufficient in scale to meet the significant market gap for supermarket floorspace at the
ATP. We understand that a larger floorplate cannot be accommodated on the Building 2
site due to the grade change within this site.
One of the key objectives of any redevelopment of the Locomotive Workshop is to enable
the heritage value to be ‘unlocked’ through visitation. Retail will be a key driver of
visitation to the precinct, in particular supermarket or a larger food offering retail,
because it generates significant and frequent visitation. A key established anchor such as
Locomotive Workshop, ATP, Eveleigh
iii
Economic Impact Assessment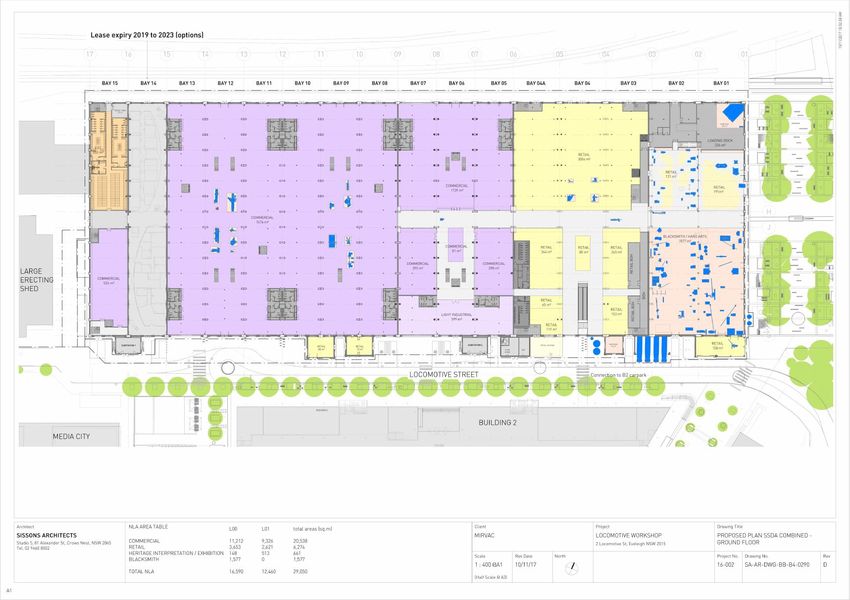
Executive summary
supermarket retail is also fundamental to attracting other specialty retailers, including
food and beverage type retailers and bespoke maker/seller type operations.
The key anchor tenant, such as a supermarket, will help to drive activation through the
ATP 18 hours a day, 7 days a week, particularly given that the subject site is generally
disconnected from most of the surrounding residential area (i.e. set-back 100 – 200m into
ATP). Sufficient car-parking will be an important component to achieve this, and will help
to minimise customers parking in the streets in the surrounding area. Dedicated car-
parking will not only service the anchor tenants, but the supporting specialty tenants as
well.
Connectivity of the car-parking to the retail at the Locomotive Workshop through
travellators will be a fundamental threshold requirement to attract retail tenants, in
particular a supermarket anchor tenant. Without this immediate connection, in our view,
an anchor tenant would be unlikely to locate at the Locomotive Workshop, leading to a
much inferior retail outcome, and a reduced appreciation (through visitation) of the
heritage value of the site.
Critical success factors for a retail offer include critical mass, functionality, mix/diversity,
anchor tenants, and accessibility (including hours of operation, parking, and connectivity).
We estimate that the proposed retail centre at the Locomotive Workshop subject site
could achieve sales in the order of $33.9 million in 2020/21, expressed in constant
$2016/17.
The largest impact on a specific centre/precinct is expected to be absorbed by the
Alexandria Precinct, at around 6.4% or $5.9 million, given its proximity and offer (noting
that the majority of this impact would be absorbed by the Woolworths supermarket),
while impacts on all other centres across the region are expected to be below 5.5%.
The impacts on other centres range from 0.5% - 5.3%, and many of these centres only
draw very thin market shares from the available main trade area at present because they
contain small independent supermarkets and small offers in general; and serve a different
role and function to the proposed retail development at the subject site.
Locomotive Workshop, ATP, Eveleigh
iv
Economic Impact Assessment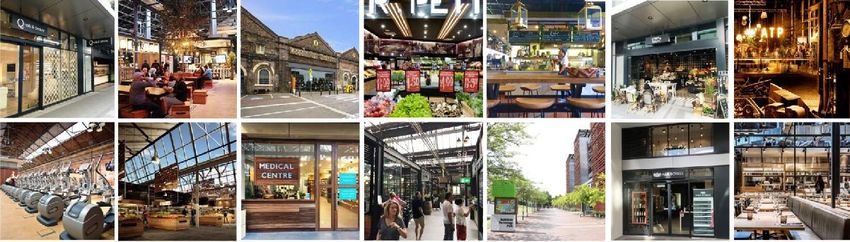
Executive summary
The development is estimated to support around 212 net additional jobs on site, as well
as around 85 jobs across the broader supply chain. Based on a construction cost of
$48 million, around 534 temporary construction jobs are expected to be created as a
result of the proposed development of the convenience component of the centre,
including on-site construction jobs.
Locomotive Workshop, ATP, Eveleigh
v
Economic Impact Assessment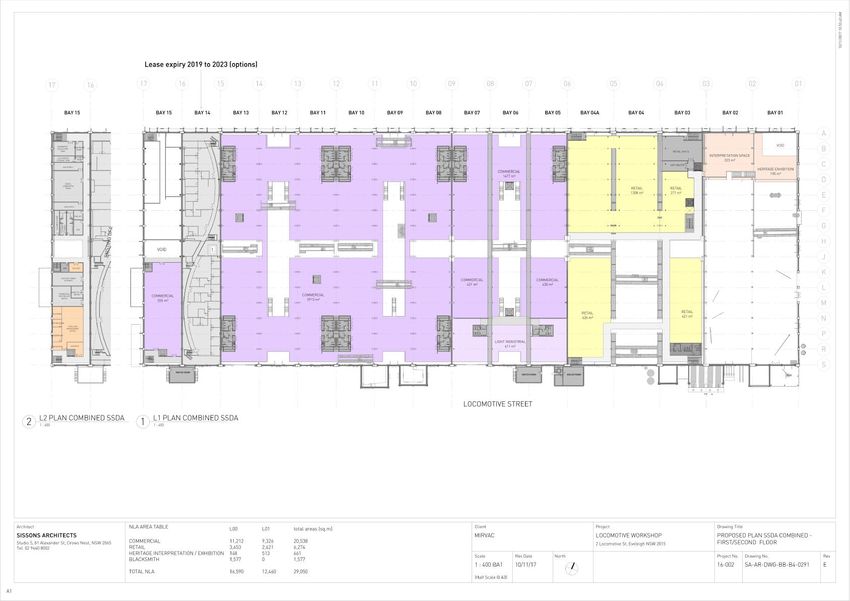
Introduction
This report presents an independent assessment of the need for retail facilities at the
Locomotive Workshop at Australian Technology Park (ATP), and the potential economic and
community impacts that might result from such a development at the subject site.
This report has been prepared in accordance with instructions received from Mirvac and is
structured as follows:
Section 1 reviews the local and regional context of the subject site including an
assessment of the surrounding facilities in the immediate locality and major
infrastructure projects of relevance, and provides an overview of the proposed
development being considered at the subject site.
Section 2 examines the various market segments that could potentially be served by
retail facilities at the subject site; provides estimates of current and anticipated
population levels within the resident and worker trade areas; analyses the socio-
demographic profile of the trade area populations; and assesses the current and future
estimated retail expenditure volumes generated by the trade areas.
Section 3 reviews the competitive context within which retail facilities at the subject site
would operate, including all proposed competitive facilities across the region.
Section 4 provides an assessment of the market gap for supermarket floorspace across
the main trade area, as well as the future growth in retail floorspace demand across the
resident and worker trade areas
Section 5 presents our estimates of potential sales volumes that could be achieved by
retail facilities at the subject site; examines the potential trading impacts on the
surrounding retail/centres hierarchy; then discusses the implications of these impacts.
Section 6 considers other economic and community impacts associated with convenience
based retail development at the subject site.
Locomotive Workshop, ATP, Eveleigh
vi
Economic Impact Assessment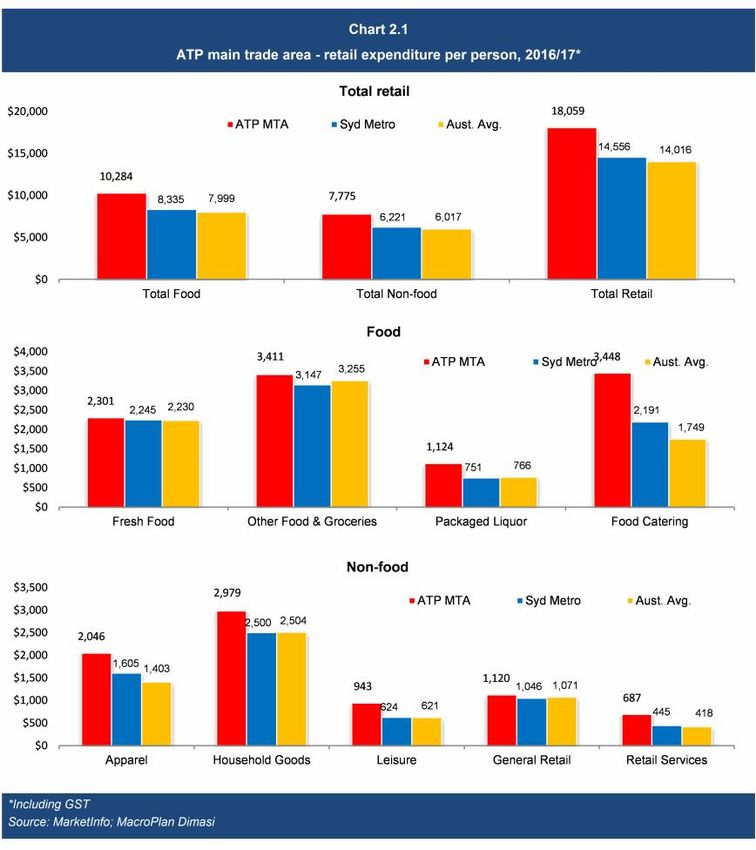
Section 1: Site context and proposed development
This section of the report reviews the local and regional context of the subject site including
an assessment of the surrounding facilities in the immediate locality and major infrastructure
projects of relevance, and provides an overview of the proposed development being
considered at the subject site.
1.1 Site location and context
The Australian Technology Park (ATP) is a modern, specialised business park, located on the
southern side of the inner west railway line. From its inception, the precinct was utilised as
workshops for the railway network, evolving into a location for markets, convention centres
to its current use as a high-tech business park with commercial office and function centre
uses. ATP is situated around 2 km south of the Sydney central business district (CBD) (refer
Map 1.1).
Map 1.2 illustrates the local context of ATP and in particular, the Locomotive Workshop,
which is the subject of this report. The Locomotive Workshop is currently used for functions
and events, and also accommodates commercial uses. Bays 1 and 2 include a static display of
the remaining heritage items from the workshop, as well as the blacksmith. The key features
of relevance in the local area include:
Redfern, Macdonaldtown and Erskineville Railway Stations
The future Waterloo Metro Station
University of Sydney
The existing commercial buildings on the ATP site, which contain around 75,000 sq.m of
floorspace, including NIC (which is utilised by four universities), NICTA (which is occupied
by CSIRO), Sydney University Biomedical Building, Channel 7 and Transport Management
Centre.
Woolworths supermarkets at Alexandria and Redfern
Carriageworks
Locomotive Workshop, ATP, Eveleigh
1
Economic Impact AssessmentMap 1.1: Australian Technology Park, Sydney Regional context
Map 1.2: Australian Technology Park
Site location
Section 1: Site context and proposed development
Map 1.2 also illustrates ATP’s location and the site of the CBA development, which is
expected to accommodate a further 10,000 workers within ATP upon completion in 2020.
The CBA development will accommodate around 100,000 sq.m of commercial floorspace and
3,000 sq.m of retail and ancillary floorspace upon completion in 2020. The CBA
development, including both the commercial office and retail floorspace, has already
received development approval. The retail offer within the CBA buildings will be primarily
orientated to the immediate CBA workforce, but will also help drive this as a 7 day offering
to the local residents, students and visitors.
Surrounding development
The Central to Eveleigh Urban Transformation and Transport Program (C2E) includes three
projects, comprising five precincts of government land, including Redfern to Eveleigh
(Redfern Station, North Eveleigh, and South Eveleigh), Waterloo and Central Station.
The Redfern to Eveleigh component has the potential to yield in excess of 1,400 dwellings
over the next 15 years.
The Waterloo precinct will be serviced by a new rail station (i.e. Waterloo Metro Station) as
part of the Sydney Metro – City & Southwest rail project which is providing services
extending to Bankstown. It is estimated that more than 5,000 additional dwellings will be
accommodated in the Waterloo precinct over the long term, in addition to future integrated
planning with the site of the new Waterloo metro station.
The C2E forms part of a broader inner-city urban transformation area which includes the
Green Square Urban Renewal Area (URA) and the Ashmore precinct, as well as sites beyond
these designated precincts.
These areas have already undergone significant change, and are expected to include tens of
thousands of new dwellings over the next few decades, including:
Ashmore precinct: 2,000 – 3,000 additional dwellings
Green Square URA: 15,000 – 20,000 additional dwellings
Locomotive Workshop, ATP, Eveleigh
4
Economic Impact AssessmentSection 1: Site context and proposed development
C2E: 10,000+ additional dwellings (including approx. 5,000 net additional at Waterloo).
The Locomotive Workshop subject site is zoned Business Zone – Business Park under the
SEPP (MD) 2005 Redfern-Waterloo Authority Sites document. The objectives of the Business
Zone – Business Park are as follows:
a) to establish business and technology parks to encourage employment generating
activities that provide for a wide range of business, technology, educational and
entertainment facilities in the Zone,
b) to support development that is related or ancillary to business, technology or education,
c) to support development for retail uses that primarily serve the needs of the working
population in the Zone and the local community,
d) to ensure the vitality and safety of the community and public domain,
e) to ensure buildings achieve design excellence,
f) to promote landscaped areas with strong visual and aesthetic values to enhance the
amenity of the area.
The proposed development, detailed in the next sub-section, is therefore consistent with the
zone objectives and will help drive and attract small business, technology, educational and
entertainment facilities, all while serving local residents and workers. The existing retail
floorspace approved within ATP will primarily service the current and future workers.
Locomotive Workshop, ATP, Eveleigh
5
Economic Impact AssessmentSection 1: Site context and proposed development
1.2 Proposed development scheme
Figure 1.1 illustrates the plans for the ATP, including the CBA office towers (approved) and
the Locomotive Workshop (the subject of the analysis this report), while Figures 1.2 and 1.3
detail the proposed layout of the Locomotive Workshop offer.
The retail component of the Locomotive Workshop (as highlighted on the diagram) is located
in Bays 3 – 4a and part of the northern Bays 1 and 2, together with the area of activation
along Innovation Plaza. In basic terms, it is envisioned that this offer will accommodate a
market, convenience retailing, food and beverage outlets and non-retail services
(e.g. medical, allied health, fitness).
Table 1.1 details the proposed composition of the retail facilities at the Locomotive
Workshop subject site. In total, around 7,339 sq.m of retail and ancillary non-retail
floorspace is proposed within the eastern component of the Locomotive Workshop,
including a 2,032 sq.m market offering, 1,337 sq.m of retail specialty floorspace at ground
floor and 3,490 sq.m of non-retail floorspace at Level 1. There is also retail and non-retail
heritage exhibition and interpretation spaces proposed, totalling 1,321 sq.m.
Table 1.1
ATP Locomotive Workshop - Proposed composition
GFA
Category (sq.m)
Supermarket 2,032
Retail specialty 1,337
Blended Heritage exhibition and interpretation space (retail) 750
Total retail 4,119
Heritage exhibition and interpretation space (non-retail) 571
Non-retail 2,649
Total offer 7,339
Source: MacroPlan Dimasi
Locomotive Workshop, ATP, Eveleigh
6
Economic Impact AssessmentSection 1: Site context and proposed development
The vision for the offer includes food specialties, which may also have a hybrid food
production function (e.g. bakery, coffee roaster etc.) as well as food catering (i.e. cafes and
restaurants). The offer will not be a traditional “shopping centre” rather it will be a retail
precinct that creates a significant point of difference in the market, allowing production,
education, manufacturing, wholesaling and dining – a fully immersive and operating precinct
for businesses, residents, workers and visitors.
The provision of retail facilities in the Locomotive Workshop represents around 5% of overall
floorspace at ATP, and is ancillary to the predominantly office usage of the precinct, however
retail facilities in the Locomotive Workshop is an important activator for the site, and will
encourage longer dwell times at ATP, connecting local residents, workers and visitors within
a setting that is sympathetic to the heritage value of the building.
The proposed retail offer being considered at the subject site is explicitly designed to attract
visitors to the precinct to enable the heritage value to be more broadly realised than it
would otherwise be. The combination of retail, commercial and improved heritage setting
will activate both the Locomotive Workshop and Innovation Plaza.
The proposed retail mix will include everyday offerings (inc. supermarket and specialty retail)
that will serve of surrounding community of workers, residents, students as well as other
visitors. The proposed offer is not intended to be activated intermittently, like event style
retail (e.g. weekend markets), as this tends to have much greater impact on the days of
operation, typically in the form of traffic congestion and parking impacts on local residents.
In our view, specialty retail that will help to activate the Innovation Plaza cannot be
sustained successfully in a non-residential precinct without an everyday anchor tenant such
as a supermarket. Other anchors have been considered, but are unsuitable. Cinemas are
essentially an evening activator only and typically form part of a larger more established
offer – noting there are cinemas at Newtown and some being developed at Green Square
Town Centre and Central Park Mall.
Locomotive Workshop, ATP, Eveleigh
7
Economic Impact AssessmentSection 1: Site context and proposed development
Department and discount department stores (DDS) require considerably larger floorplates,
and tend to co-locate with non-food uses in shopping centres as opposed to local
neighbourhood precincts. Other household goods/homewares type retailers.
The existing retail offer throughout ATP is limited, and the approved retail within the CBA
development will be fragmented and will primarily service the convenience needs of the
immediate worker population. The development within the Locomotive Workshop will
create a critical mass of facilities that will activate the area, capitalising on the site’s
proximity to public transport connections.
Based on our analysis, the small supermarket approved at the Building 2 site is not sufficient
in scale to meet the significant market gap for supermarket floorspace at the ATP. We
understand that a larger floorplate cannot be accommodated on the Building 2 site due to
the grade change within this site.
One of the key objectives of any redevelopment of the Locomotive Workshop is to enable
the heritage value to be ‘unlocked’ through visitation. Retail will be a key driver of visitation
to the precinct, in particular supermarket retail or large food offering, because it generates
significant and frequent visitation. A key established anchor, such as a supermarket, is also
fundamental to attracting other specialty retailers, including food and beverage type
retailers and bespoke maker/seller type operations.
This key anchor tenant, such as a supermarket, will help to drive activation through the ATP
18 hours a day, 7 days a week, particularly given that the subject site is generally
disconnected from most of the surrounding residential area (i.e. set-back 100 – 200m into
ATP). Sufficient car-parking will be an important component to achieve this, and will help to
minimise customers parking in the streets in the surrounding area. Dedicated car-parking will
not only service the anchor tenants, but the supporting specialty tenants as well.
Locomotive Workshop, ATP, Eveleigh
8
Economic Impact AssessmentSection 1: Site context and proposed development
Connectivity of the car-parking to the retail at the Locomotive Workshop through
travellators will be a fundamental threshold requirement to attract retail tenants, in
particular a supermarket anchor tenant. Without this immediate connection, in our view, an
anchor tenant would be unlikely to locate at the Locomotive Workshop, leading to a much
inferior retail outcome, and a reduced appreciation (through visitation) of the heritage value
of the site.
Critical success factors for a retail offer include critical mass, functionality, mix/diversity,
anchor tenants, and accessibility (including hours of operation, parking, and connectivity).
Locomotive Workshop, ATP, Eveleigh
9
Economic Impact AssessmentFigure 1.1
SUBJECT SITE
EXISTING OR APPROVEDFigure 1.2
Figure 1.3
Section 1: Site context and proposed development

1.3   Comparison with other precincts

Maps 1.3 – 1.5 present a comparison of the Locomotive Workshop subject site with two
other high density locations across Sydney, i.e. Potts Point and Green Square Town Centre.
These two locations have supermarket anchors with limited car-parking (i.e. limited to street
based parking). There are very few examples across Sydney, and indeed Australia, of solid
supermarkets (i.e. 2,000 sq.m+) without dedicated car-parking. Indeed, excepting CBD
locations these two and Central Park Mall are the only two examples we have identified.

The respective Woolworths supermarkets at Green Square and Potts Point are located
immediately adjacent to high density residential development.

There is around 2,700 residents within 200m of Woolworths at Potts Point and around
10,000 within 400m. At Green Square, the town centre is in its infancy, and based upon
observations, initial trading at the centre is subdued. The site however is located
immediately amongst future high density residential development.

The Locomotive Workshop site on the other hand is located inboard from the surrounding
residential development in the region and is disconnected to the north by the railway line.
There is a small amount of residential within 200m along Garden Street, with only around
500 persons estimated to live within 200m. There is a similar amount of residential
population within 400m of the subject site, than is at Green Square, however, Green Square
immediate population will increase significantly over the next 5 – 10 years, whereas the
immediate 400m radius around the Locomotive Workshop is only expected to yield a
relatively minor amount of additional population.

                                                             Locomotive Workshop, ATP, Eveleigh
                                                                                                       13
                                                                       Economic Impact Assessment
Map 1.3: Subject site with distance measurements Population density context
Map 1.4: Green Square
Population density context
Map 1.5: Potts Point
Population density context
Section 2: Trade area analysis
This section of the report examines the various market segments that could potentially be
served by retail facilities at the subject site; provides estimates of current and anticipated
population levels within the resident and worker trade areas; analyses the socio-
demographic profile of the trade area populations; and assesses the current and future
estimated retail expenditure volumes generated by the trade areas.
There are a number of customer segments that have been identified as the future customers
of the retail facilities at the ATP Locomotive Workshop, these include:
Local residents – this customer segment includes residents within the immediate
surrounding area who would access retail facilities at the subject site;
Nearby workers - this customer segment includes the current and future workers within
the ATP precinct, as well as surrounding workers who can access the site within a
relatively short walk;
Students – this includes students of Sydney University who would potentially utilise the
retail facilities at the ATP Locomotive Workshop to socialise and study; and
Other visitors – this includes residents from the broader local area (i.e. Alexandria, Surry
Hills, Newtown and Mascot), as well as broader metropolitan Sydney residents.
2.1 Resident trade area
The extent of the trade area or catchment that is served by any retail facility or precinct is
shaped by the interplay of a number of critical factors. These factors include:
The relative attraction of the precinct, in comparison with alternative competitive retail
facilities. The factors that determine the strength and attraction of any particular precinct
are primarily its scale composition (in particular the major trader or traders that anchor
the centre); its layout and ambience; and car-parking, including access and ease of use.
Locomotive Workshop, ATP, Eveleigh
17
Economic Impact AssessmentSection 2: Trade area analysis
The proximity and attractiveness of competitive retail centres and facilities. The locations,
compositions, quality and scale of competitive retail facilities all serve to define the
extent of the trade area which a retail centre is effectively able to serve.
The available road network and public transport infrastructure, which determine the ease
(or difficulty) with which customers are able to access a retail centre.
Significant physical barriers which are difficult to negotiate, and act as delineating
boundaries to the trade area served by an individual retail centre.
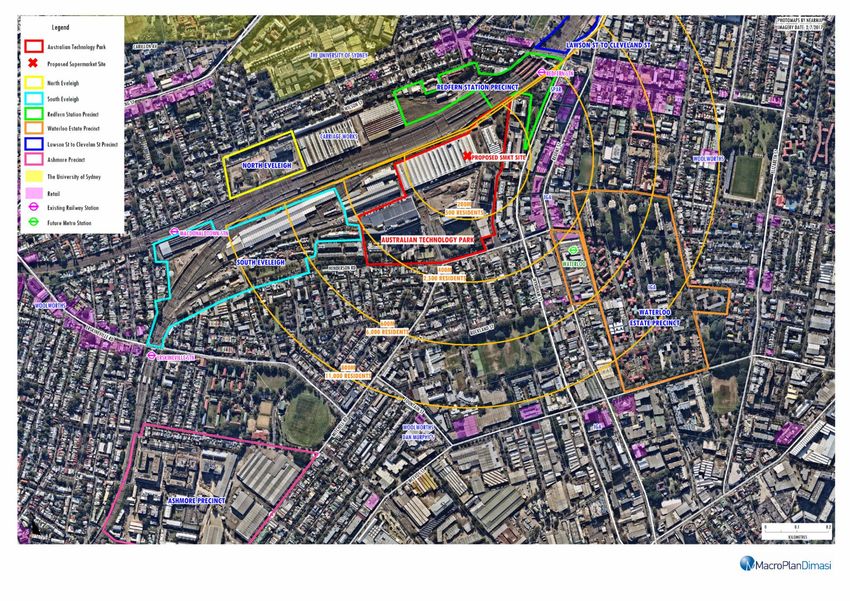
Having regard to the above, Map 2.1 illustrates the trade area that is expected to utilise the
proposed retail facilities at the ATP Locomotive Workshop development. The trade area
includes one primary sector and four secondary sectors, described as follows:
The primary sector is bounded by the railway line to the north and west, Botany Road to
the east and McEvoy Street and Ashmore Streets to the south includes the ATP subject
site, as well as the South Eveleigh precinct and parts of Alexandria and Erskineville.
The secondary north sector extends to Cleveland Street and King Street in the north and
west and includes parts of Eveleigh, Redfern, Darlington and Newtown.
The secondary east sector extends to Cleveland Street in the north, Pitt Street in the east
and McEvoy Street to the south and includes parts of Redfern and Waterloo.
The secondary south sector extends to Sydney Park Road to the south and includes the
Ashmore Street Urban Renewal Precinct.
The secondary west sector extends west to King Street and includes parts of Newtown
and Erskineville.
In combination, the primary and secondary sectors are referred to as the resident main
trade area throughout the remainder of this report.
Locomotive Workshop, ATP, Eveleigh
18
Economic Impact AssessmentMap 2.1: Australian Technology Park Resident trade area and competition
Section 2: Trade area analysis
Table 2.1 details the current and projected population levels within the defined resident
main trade area. These estimates are based on a range of data and information sources,
including the following:
Australian Bureau of Statistics Census of Population and Housing (2006, 2011 and 2016);
Australian Bureau of Statistics Estimated Resident Population (ERP);
Australian Bureau of Statistics New Dwelling Approval Data (2011 - 2016);
NSW DPE Household and Population projections (2006 - 2036);
NSW Bureau of Transport Statistics (BTS) population projections – small area;
Other investigations of future residential development, undertaken by MacroPlan Dimasi.
The resident main trade area population is estimated at 34,660 as at June 2017, including
7,260 residents in the key primary sector. Over the most recent intercensal period (2011-
2016), the main trade area population increased at an average rate of 3.0% per annum, or
around 940 persons per annum.
Population growth is expected to be driven by residential intensification projects throughout
the main trade area, including Eveleigh, Waterloo and Ashmore Street precincts.
Having regard for the above, the resident main trade area population is estimated to grow at
an average annual rate of 3.5% to reach 56,360 by 2031. The primary sector population is
estimated to grow to around 9,560 by 2031.
Locomotive Workshop, ATP, Eveleigh
20
Economic Impact AssessmentSection 2: Trade area analysis
Table 2.1
ATP trade area population, 2006-2031*
Estimated population Forecast population
Trade area sector 2006 2011 2016 2017 2021 2026 2031
Primary 5,280 6,140 7,070 7,260 8,060 9,060 9,560
Secondary sectors
• North 6,530 6,740 7,220 7,320 8,920 10,170 11,170
• East 6,050 6,950 8,890 9,280 10,080 12,080 15,830
• South 3,890 4,470 5,070 5,190 6,590 10,090 12,590
• West 4,410 4,730 5,460 5,610 6,210 6,710 7,210
Total secondary 20,880 22,890 26,640 27,400 31,800 39,050 46,800
Main trade area 26,160 29,030 33,710 34,660 39,860 48,110 56,360
Average annual growth (no.)
Trade area sector 2006-11 2011-16 2016-17 2017-21 2021-26 2026-31
Primary 172 186 190 200 200 100
Secondary sectors
• North 42 96 100 400 250 200
• East 180 388 390 200 400 750
• South 116 120 120 350 700 500
• West 64 146 150 150 100 100
Total secondary 402 750 760 1,100 1,450 1,550
Main trade area 574 936 950 1,300 1,650 1,650
Average annual growth (%)
Trade area sector 2006-11 2011-16 2016-17 2017-21 2021-26 2026-31
Primary 3.1% 2.9% 2.7% 2.6% 2.4% 1.1%
Secondary sectors
• North 0.6% 1.4% 1.4% 5.1% 2.7% 1.9%
• East 2.8% 5.0% 4.4% 2.1% 3.7% 5.6%
• South 2.8% 2.6% 2.4% 6.2% 8.9% 4.5%
• West 1.4% 2.9% 2.7% 2.6% 1.6% 1.4%
Total secondary 1.9% 3.1% 2.9% 3.8% 4.2% 3.7%
Main trade area 2.1% 3.0% 2.8% 3.6% 3.8% 3.2%
*As at June
Source: ABS Census 2016; NSW Department of Planning and Environment 2016; MacroPlan Dimasi
Locomotive Workshop, ATP, Eveleigh
21
Economic Impact AssessmentSection 2: Trade area analysis
Table 2.2 details the socio-demographic profile of the resident main trade area population,
benchmarked against the averages for metropolitan Sydney and Australia, based on the
results of the 2016 ABS Census of Population and Housing. The key points to note include the
following:
Main trade area residents earn per capita incomes that are 42.3% above the metropolitan
Sydney average, with average household incomes being 5.5% above the respective
benchmark. The average household size across the main trade area (2.0) is significantly
lower than the Sydney average (2.7), therefore average household incomes are only
marginally higher than the respective benchmark.
The average age of main trade area residents, at 36.3 years, is below the average for
metropolitan Sydney (37.5 years), reflecting the above average proportion of residents
aged 20-39 years (+21% compared with Sydney average).
Rental households account for 62.7% of main trade area households, which is 27.6%
above the Sydney average (35.1%), reflecting the high proportion of young professionals
and students living in rental accommodation.
Couples without children are the predominant household type in the main trade area,
accounting for 36.7% of main trade area households, which is more than 16% higher than
the metropolitan Sydney average (20.1%). The proportion of lone person households in
the main trade area (25.5%) is more than double the respective benchmark for
metropolitan Sydney (9.2%). This reflects around 4,000 lone person households in the
main trade area as at 2016.
In summary, the socio-demographic profile of the resident main trade area is reflective of an
urban, inner city population, consisting of young, professional singles and couples. Inner city
residents tend to have larger than average disposable incomes, and therefore a greater
propensity to spend on food catering.
Locomotive Workshop, ATP, Eveleigh
22
Economic Impact AssessmentSection 2: Trade area analysis
Table 2.2
ATP main trade area - socio-demographic profile, 2016
Primary Secondary sectors Main Syd Metro Aust.
Census item sector North East South West TA avg. avg.
Per capita income $68,674 $57,749 $53,229 $75,757 $66,527 $62,977 $44,247 $40,116
Var. from Syd Metro bmark 55.2% 30.5% 20.3% 71.2% 50.4% 42.3%
Avg. household income $147,740 $122,533 $93,868 $152,673 $149,716 $127,826 $121,118 $102,415
Var. from Syd Metro bmark 22.0% 1.2% -22.5% 26.1% 23.6% 5.5%
Avg. household size 2.2 2.1 1.8 2.0 2.3 2.0 2.7 2.6
Age distribution (% of population)
Aged 0-14 11.5% 6.9% 5.8% 10.8% 11.7% 8.9% 18.7% 18.7%
Aged 15-19 2.0% 5.6% 2.5% 1.3% 3.0% 3.0% 6.0% 6.1%
Aged 20-29 22.5% 40.3% 23.9% 22.7% 22.6% 27.1% 15.0% 13.8%
Aged 30-39 25.9% 19.8% 21.4% 35.0% 22.9% 24.4% 15.5% 14.0%
Aged 40-49 16.7% 10.8% 12.7% 17.3% 17.7% 14.6% 13.7% 13.5%
Aged 50-59 11.3% 8.3% 11.6% 7.5% 12.4% 10.2% 12.2% 12.7%
Aged 60+ 10.1% 8.2% 22.0% 5.4% 9.8% 11.7% 18.9% 21.1%
Average age 36.1 32.8 41.8 33.9 36.0 36.3 37.5 38.6
Housing status (% of households)
Owner (total) 48.3% 29.8% 21.3% 46.7% 50.9% 36.8% 64.2% 67.4%
• Owner (outright) 14.4% 12.6% 6.3% 10.7% 18.2% 11.7% 30.0% 31.9%
• Owner (with mortgage) 33.9% 17.2% 15.0% 36.1% 32.7% 25.1% 34.2% 35.5%
Renter 51.3% 69.4% 77.9% 53.0% 49.1% 62.7% 35.1% 31.8%
Other 0.4% 0.8% 0.8% 0.3% 0.0% 0.5% 0.7% 0.8%
Birthplace (% of population)
Australian born 66.8% 54.8% 47.4% 61.5% 69.6% 58.9% 60.9% 71.9%
Overseas born 33.2% 45.2% 52.6% 38.5% 30.4% 41.1% 39.1% 28.1%
• Asia 8.9% 23.4% 21.7% 11.7% 6.7% 15.5% 19.1% 11.2%
• Europe 13.6% 11.5% 17.7% 16.7% 15.3% 14.8% 9.6% 9.6%
• Other 10.7% 10.3% 13.3% 10.1% 8.4% 10.8% 10.4% 7.4%
Family type (% of households)
Couple with dep't child. 31.2% 25.8% 14.3% 27.9% 36.6% 25.5% 48.5% 44.8%
Couple with non-dep't child. 2.6% 2.6% 1.6% 1.9% 2.4% 2.2% 9.1% 7.7%
Couple without child. 37.2% 33.0% 35.0% 46.0% 34.3% 36.7% 20.1% 22.8%
One parent with dep't child. 7.0% 4.4% 5.9% 2.9% 5.2% 5.2% 7.9% 8.8%
One parent w non-dep't child. 3.3% 1.7% 4.4% 1.2% 2.5% 2.8% 4.1% 3.7%
Other family 1.3% 2.1% 2.9% 1.6% 2.0% 2.1% 1.2% 1.1%
Lone person 17.3% 30.3% 35.8% 18.5% 16.9% 25.5% 9.2% 11.0%
Source: ABS Census of Population & Housing, 2016; MacroPlan Dimasi
Locomotive Workshop, ATP, Eveleigh
23
Economic Impact AssessmentSection 2: Trade area analysis
MacroPlan Dimasi estimates retail expenditure capacity generated by main trade area
residents based on information sourced from Market Data Systems (MDS) called MarketInfo,
which utilises a detailed micro simulation model of household expenditure behaviour for all
residents of Australia. The model takes into account information from a wide variety of
sources including the regular ABS Household Expenditure Surveys, national accounts data,
Census data and other information. We consider MarketInfo data to be an accurate measure
of available retail expenditure and it is widely relied on in the retail industry.
Chart 2.1 details the estimated per capita retail expenditure of the main trade area
population, by retail category, as at 2016/17, and provides comparisons with the
benchmarks for metropolitan Sydney and Australia. All retail expenditure estimates detailed
in this report are inclusive of GST. The key points to note include the following:
Estimated total per capita retail expenditure is around 24% higher than the metropolitan
Sydney average.
Estimated per capita expenditure on fresh food, other food and groceries, which are key
expenditure categories of relevance to supermarket retailing, is around 6% above
average.
Estimated per capita expenditure on food catering (i.e. takeaway food, cafes and
restaurants) is significantly higher (+57%) than the metropolitan Sydney average.
Estimated per capita expenditure on discretionary retail categories is well above average
(+25%), reflecting the affluent nature of the trade area population.
Locomotive Workshop, ATP, Eveleigh
24
Economic Impact AssessmentSection 2: Trade area analysis
Locomotive Workshop, ATP, Eveleigh
25
Economic Impact AssessmentSection 2: Trade area analysis
Table 2.3 presents the estimated total retail expenditure of the main trade area population,
by trade area sector, over the period 2017 to 2031. All expenditure forecasts presented
throughout this report are expressed in constant 2016/17 dollars (i.e. excluding inflation).
The retail expenditure market is estimated to grow from $617 million in 2017 to $1.15 billion
by 2031, reflecting an average annual growth rate of 4.5%. This average annual growth rate
comprises two components, as follows:
Residential population growth, which is estimated to average 3.5% per annum; and
Real growth in per capita expenditure, which is expected to average 1.0% per annum over
the forecast period.
Table 2.4 then presents projections of main trade area retail expenditure on a retail category
basis, for the period 2017-2031. FLG expenditure (take-home food, packaged liquor and
groceries) is estimated at $233.7 million, accounting for around 38% of all retail expenditure,
and is estimated to grow to $528.3 million by 2031, reflecting total growth of 4.6%. Food
catering expenditure is estimated to grow particularly strongly over the forecast period,
reaching $296.0 million by 2031, an increase of around 150%.
Locomotive Workshop, ATP, Eveleigh
26
Economic Impact AssessmentSection 2: Trade area analysis
Table 2.3
ATP main trade area - retail expenditure ($M), 2017-2031*
Year ending Primary Secondary sectors Main
June sector North East South West TA
2017 134.8 129.6 140.8 106.7 105.3 617.3
2018 139.7 135.0 146.8 112.3 109.1 642.9
2019 144.7 143.2 151.2 120.3 113.0 672.5
2020 149.9 151.9 155.9 129.0 117.0 703.6
2021 155.4 161.1 160.7 138.2 121.1 736.4
2022 160.7 168.8 166.9 150.0 124.8 771.2
2023 166.1 175.0 174.7 164.9 127.9 808.5
2024 171.6 181.3 182.8 181.3 131.1 848.2
2025 177.3 187.9 191.4 199.3 134.4 890.3
2026 183.3 194.7 200.4 219.1 137.8 935.2
2027 188.2 201.0 211.6 236.0 141.2 978.0
2028 192.0 206.8 225.5 249.0 144.6 1,017.9
2029 195.9 212.7 240.4 262.8 148.0 1,059.8
2030 199.9 218.8 256.2 277.3 151.6 1,103.8
2031 204.0 225.1 273.0 292.7 155.3 1,150.0
Average annual growth ($M)
2017-2031 4.9 6.8 9.4 13.3 3.6 38.0
Average annual growth (%)
2017-2031 3.0% 4.0% 4.8% 7.5% 2.8% 4.5%
*Constant 2016/17 dollars & including GST
Source: MarketInfo; MacroPlan Dimasi
Locomotive Workshop, ATP, Eveleigh
27
Economic Impact AssessmentSection 2: Trade area analysis
Table 2.4
ATP main trade area - retail expenditure by category ($M), 2017-2031*
Year ending FLG Food Apparel Household Leisure General Retail Total
June catering goods retail services retail
2017 233.7 117.8 69.9 101.8 32.2 38.3 23.5 617.3
2018 243.5 123.4 72.5 105.8 33.4 39.7 24.5 642.9
2019 254.7 129.9 75.6 110.5 34.8 41.3 25.6 672.5
2020 266.4 136.8 78.8 115.4 36.3 43.1 26.9 703.6
2021 278.7 144.1 82.1 120.5 37.8 44.9 28.2 736.4
2022 291.9 151.9 85.7 126.0 39.5 46.8 29.5 771.2
2023 306.0 160.3 89.5 131.7 41.2 48.8 31.0 808.5
2024 321.0 169.3 93.5 137.8 43.1 50.9 32.5 848.2
2025 336.9 179.0 97.8 144.3 45.0 53.2 34.2 890.3
2026 353.8 189.3 102.3 151.2 47.1 55.6 36.0 935.2
2027 370.2 199.2 106.5 157.7 49.0 57.9 37.6 978.0
2028 385.7 208.5 110.2 163.6 50.8 59.9 39.2 1,017.9
2029 402.1 218.3 114.2 169.8 52.6 62.1 40.8 1,059.8
2030 419.3 228.6 118.3 176.3 54.5 64.3 42.5 1,103.8
2031 437.3 239.5 122.5 183.1 56.5 66.7 44.2 1,150.0
2032 455.0 250.3 126.7 189.8 58.5 69.0 46.0 1,195.2
2033 472.2 260.9 130.7 196.2 60.3 71.2 47.7 1,239.2
2034 490.1 272.1 134.8 202.9 62.2 73.4 49.4 1,285.0
2035 508.8 283.7 139.1 209.8 64.2 75.8 51.2 1,332.7
2036 528.3 296.0 143.5 217.0 66.3 78.2 53.2 1,382.5
Average annual growth ($M)
2017-2031 14.5 8.7 3.8 5.8 1.7 2.0 1.5 38.0
Average annual growth (%)
2017-2031 4.6% 5.2% 4.1% 4.3% 4.1% 4.0% 4.6% 4.5%
*Constant 2016/17 dollars & including GST
Source: MarketInfo; MacroPlan Dimasi
Locomotive Workshop, ATP, Eveleigh
28
Economic Impact AssessmentSection 2: Trade area analysis
2.2 Worker trade area
Map 2.2 illustrates the defined worker trade area that is expected to be served by retail
facilities at the ATP Locomotive Workshop. The trade area comprises three sectors, as
follows:
The primary sector is bounded by the railway line to the north, Cornwallis Street to the
east, Henderson Road to the south and Burren Street to the west and includes the
ATP subject site, as well as the South Eveleigh precinct.
The secondary east sector extends to Cleveland Street in the north, George Street in the
east, and Phillip Street to the south and includes part of Redfern.
The secondary south sector extends to Botany Road to the east, Ashmore Road and
McEvoy Street to the south and the railway line to the west and includes parts of
Erskineville and Alexandria.
In combination, these three sectors are referred to as the worker trade area throughout this
report.
Locomotive Workshop, ATP, Eveleigh
29
Economic Impact AssessmentMap 2.2: Australian Technology Park Worker trade area and competition
Section 2: Trade area analysis

Table 2.5 details the estimated current and projected worker population over the period to
2031. Based on information from the ABS and Transport for NSW, the worker trade area
population is currently estimated at 8,340 persons, including 3,710 workers in the key
primary sector.

                                                          Table 2.5
                                    ATP worker trade area population, 2011-2031*

                              Estimated population                              Forecast population
  Trade area                      2011            2016             2017              2021          2026           2031

  Primary sector                 3,050            3,600           3,710             14,510       16,460         17,210
  Secondary sectors
  • East                         2,000            2,250           2,390              2,950        3,450          3,700
  • South                        2,180            2,230           2,240              2,280        2,380          2,480
  Total secondary                4,180            4,480           4,630              5,230        5,830          6,180
  Worker trade area              7,230            8,080           8,340             19,740       22,290         23,390

                                                                   Average annual growth (no.)
  Trade area                                   2011-16         2016-17         2017-21          2021-26        2026-31

  Primary sector                                    110               110            2,700          390            150
  Secondary sectors
  • East                                             50               140             140           100             50
  • South                                            10                10              10            20             20
  Total secondary                                    60               150             150           120             70
  Worker trade area                                 170               260            2,850          510            220

                                                                      Average annual growth (%)
  Trade area                                   2011-16         2016-17         2017-21          2021-26        2026-31

  Primary sector                                  3.4%            3.1%              40.6%          2.6%           0.9%
  Secondary sectors
  • East                                          2.4%            6.2%               5.4%          3.2%           1.4%
  • South                                         0.5%            0.4%               0.4%          0.9%           0.8%
  Total secondary                                 1.4%            3.3%               3.1%          2.2%           1.2%
  Worker trade area                               2.2%            3.2%              24.0%          2.5%           1.0%
  *As at June
  Source: ABS Worker Population Profile 2011; Transport for NSW; MacroPlan Dimasi

Growth in the worker trade area population will primarily be driven by the development of
new CBA offices at ATP, adjacent to the Locomotive Workshop, as well as additional
commercial and retail development throughout ATP and the Locomotive Workshop. The CBA

                                                                                    Locomotive Workshop, ATP, Eveleigh
                                                                                                                               31
                                                                                             Economic Impact Assessment
Section 2: Trade area analysis
development is expected to accommodate around 10,000 workers upon completion, in
addition to the retail workers across the CBA buildings and Locomotive Workshop. Additional
space within the Locomotive Workshop is planned to be converted to commercial and tech
floorspace, which will also drive a significant employment outcome.
The worker trade area population is estimated to grow at an average annual rate of 7.6% to
reach 23,390 by 2031, including 17,210 workers in the key primary sector.
Table 2.6 then details the socio-demographic profile of the worker trade area population,
based on data sourced from the 2011 ABS Census, as the employment data from the 2016
Census is not yet available. We note that the worker profile within this trade area has likely
changed since 2011, and will likely change significantly in the future as 10,000 CBA workers,
across various teams, will locate at ATP by 2020. As such, we have also presented the profile
of workers within Sydney Olympic Park at 2011, where CBA currently has a significant
workforce.
The key points to note include the following:
The average age of worker trade area workers, at 40.7 years, was marginally lower than
the metropolitan Sydney average. The workforce within Sydney Olympic Park was
significantly younger than the metropolitan Sydney average.
Professionals account for 39% of worker trade area workers, including 53% of workers
within the primary sector.
The average income earned by worker trade area workers was around 24% above the
metropolitan Sydney average.
At 2011, private car was the most utilised mode of transport to work for worker trade
area workers, at 43.7%. Train utilisation was more than double the metropolitan Sydney
average, at 32%, reflecting the proximity of Redfern and Macdonaldtown railway stations.
We would anticipate that public transport utilisation has increased since 2011, especially
on the train network.
Locomotive Workshop, ATP, Eveleigh
32
Economic Impact AssessmentSection 2: Trade area analysis
Table 2.6
ATP worker trade area - Worker population profile, 2011
Primary Secondary sectors Total Syd Metro Syd Olympic
Characteristics sector East South Worker TA avg. Park
Gender
Male 52.3% 57.7% 60.6% 56.2% 52.0% 59.3%
Female 47.7% 42.3% 39.4% 43.8% 48.0% 40.7%
Age distribution
Aged 15-19 0.6% 1.8% 1.0% 1.1% 4.2% 3.0%
Aged 20-29 21.9% 22.6% 20.3% 21.6% 21.3% 26.2%
Aged 30-49 57.4% 53.2% 51.5% 54.6% 47.5% 52.7%
Aged 50-64 18.8% 20.9% 24.0% 20.9% 24.0% 17.0%
Aged 65+ 1.2% 1.5% 3.1% 1.8% 3.1% 1.1%
Average age 40.2 40.3 41.9 40.7 41.0 38.7
Occupation
Managers 15.9% 17.1% 16.9% 16.5% 14.2% 19.9%
Professionals 53.3% 31.0% 25.2% 39.0% 27.3% 31.7%
Clerical and service workers 18.2% 31.0% 24.1% 23.4% 26.2% 31.4%
Sales workers 2.2% 5.3% 8.2% 4.8% 9.3% 4.0%
Tradespersons and technicians 8.8% 7.5% 14.7% 10.2% 11.0% 8.3%
Labourers & transport workers 1.5% 8.2% 10.9% 6.1% 12.0% 4.7%
Personal income
Less than $20,799 1.9% 9.2% 11.4% 6.6% 13.6% 8.1%
$20,800 - $41,599 6.8% 17.5% 25.5% 15.1% 24.3% 12.1%
$41,600 - $64,999 21.0% 29.5% 28.8% 25.6% 25.5% 24.9%
$65,000 - $103,999 39.8% 27.8% 24.2% 32.0% 22.3% 29.0%
$104,000 or more 30.5% 16.0% 10.1% 20.6% 14.3% 25.8%
Average income 102,927 74,571 63,324 83,735 67,257 89,025
Mode of transport
Train 36.3% 40.0% 18.1% 32.0% 14.2% 19.3%
Tram (& light rail) 0.0% 0.0% 0.0% 0.0% 0.1% 0.0%
Bus 1.4% 2.9% 3.0% 2.3% 6.0% 3.4%
Car driver 41.2% 30.6% 52.0% 41.5% 53.5% 61.7%
Car passenger 2.1% 2.0% 2.6% 2.2% 4.4% 3.6%
Bicycle 2.4% 2.2% 2.3% 2.3% 0.8% 0.9%
Other 7.5% 10.1% 8.5% 8.5% 8.0% 2.6%
Non travel 9.2% 12.2% 13.6% 11.3% 13.0% 8.3%
Source: ABS Worker Population Profile 2011, MacroPlan Dimasi
Locomotive Workshop, ATP, Eveleigh
33
Economic Impact AssessmentSection 2: Trade area analysis
To understand the potential retail expenditure capacity of the worker trade area, we have
adopted the retail expenditure profile of the top 10 residential areas where the majority of
the worker trade area workers live. This area accounts for around 51% of the workforce and
includes SA3s of Marrickville – Sydenham – Petersham, Sydney Inner City, Eastern Suburbs –
North, Eastern Suburbs – South, Bankstown, Hurstville, Kogarah – Rockdale, Leichhardt,
Strathfield – Burwood – Ashfield and Sutherland – Menai – Heathcote.
The proportion of a person’s annual retail expenditure which is spent at or near place of
work can vary depending on the retail offer that is available, and by retail category. For
example, workers in the Sydney CBD, who have a much better access to a broader range of
retail options, spend a much higher proportion of their annual retail expenditure at/near
their place of work.
Typically, workers spend around 30 – 50% of their total retail expenditure capacity near their
place of work, however we have applied a more conservative assumption because the retail
offer is not expected to be comprehensive (i.e. it will not accommodate significant non-food
or discretionary retail facilities). We estimate that workers within the defined worker trade
area could potentially spend approximately 25 - 30% of their total retail expenditure near
their place of work.
Table 2.7 presents the total retail expenditure capacity of trade area workers near their place
of work, by retail category, over the period 2017 to 2031. . All expenditure estimated in this
report are expressed in constant 2016/17 dollars and are inclusive of GST.
Therefore, the total available retail expenditure generated by the worker trade area
population is estimated to grow from $36.7 million at 2017 to $122.0 million by 2031,
reflecting an average annual growth rate of 9.0%.
Locomotive Workshop, ATP, Eveleigh
34
Economic Impact AssessmentSection 2: Trade area analysis
Table 2.7
ATP worker trade area - retail expenditure by category ($M), 2017-2031*
Year ending FLG Food Apparel Household Leisure General Retail Total
June catering goods retail services retail
Share near
work** 35% 60% 5% 5% 15% 15% 45% 29%
2017 18.1 12.8 0.7 1.1 0.9 1.3 1.9 36.7
2018 20.2 14.4 0.8 1.2 1.0 1.4 2.2 41.2
2019 24.7 17.7 1.0 1.5 1.2 1.8 2.6 50.5
2020 31.0 22.3 1.2 1.8 1.5 2.2 3.3 63.4
2021 39.8 28.7 1.6 2.4 1.9 2.8 4.3 81.4
2022 46.2 33.5 1.8 2.7 2.2 3.2 4.9 94.6
2023 47.8 34.9 1.9 2.8 2.2 3.3 5.1 98.0
2024 49.4 36.3 1.9 2.9 2.3 3.4 5.3 101.5
2025 51.2 37.7 2.0 3.0 2.4 3.5 5.5 105.2
2026 53.0 39.2 2.0 3.1 2.4 3.6 5.7 109.0
2027 54.4 40.5 2.1 3.2 2.5 3.7 5.8 112.2
2028 55.5 41.5 2.1 3.2 2.5 3.8 5.9 114.5
2029 56.6 42.5 2.1 3.3 2.6 3.8 6.1 117.0
2030 57.7 43.6 2.2 3.3 2.6 3.9 6.2 119.4
2031 58.8 44.7 2.2 3.4 2.6 3.9 6.3 122.0
Average annual growth ($M)
2017-2031 2.9 2.3 0.1 0.2 0.1 0.2 0.3 6.1
Average annual growth (%)
2017-2031 8.8% 9.3% 8.3% 8.5% 8.3% 8.3% 8.8% 9.0%
*Constant 2016/17 dollars & including GST
Source: MarketInfo; MacroPlan Dimasi
Locomotive Workshop, ATP, Eveleigh
35
Economic Impact AssessmentSection 2: Trade area analysis
2.3 Other customer segments
Students
As detailed in the previous sections, ATP is located within proximity of Sydney University,
although pedestrian access is constrained by the railway lines. Nonetheless, Redfern Station,
which is located a short walk from ATP is a major transport hub for students attending
Sydney University, and there is a significant student population residing in the surrounding
area.
Sydney University accommodates in excess of 58,500 students. Total student enrolments
have grown at around 2.7% per annum over recent years.
Students at Sydney University and UTS utilise retail centres such as Broadway SC and Central
Park as ‘break out’ spaces, and are key customer segments for these centres.
The provision of free Wi-Fi, open space and incubator facilities could potentially attract
students to ATP to study and socialise, however, the lack of direct access is considered a
major constraint.
Tourists
Sydney is the most popular tourist destination in Australia for both international and
domestic visitors. According to Tourism Research Australia (TRA), the Sydney tourism region
accommodated approximately 13.1 million overnight visitors in the year to March 2017.
There were approximately 32.6 million visitors to Sydney in the year to March 2017,
including 3.7 million international visitors, 9.4 million domestic overnight visitors and
19.5 million domestic daytrip visitors.
Over the past decade, the volume of international and domestic overnight visits has
increased by 3.3% and 2.1% per annum, respectively, while domestic daytrip visits have
increased by around 1.9% per annum.
Locomotive Workshop, ATP, Eveleigh
36
Economic Impact AssessmentSection 2: Trade area analysis
According to TRA, there is a solid outlook for tourism visitor growth across NSW, with
international visitor nights forecast to grow by 5.1% per annum and domestic visitor nights
expected to grow by 2.8% per annum over the long term.
The strong growth in international visitation is expected to be driven by a more sustainable
level for the Australian dollar; an increasing middle class in Asia; new flight routes; an
excellent international reputation, in particular for food and wine; and improved tourism
infrastructure (e.g. hotels).
Increasingly, tourists – particularly those visiting Australia, travel for food based experiences
and will seek out attractions across Sydney.
Other metropolitan Sydney visitors
As alluded to previously, destinational anchors and precincts can draw patronage from a
broad region. Tramsheds, Kensington Street and Danks Street in Sydney, and James Street in
Brisbane, are good example of a destinational precincts that attracts visitors from well
beyond their localised residential and worker trade areas (including broader metropolitan
residents and tourists).
The reinterpretation of the heritage of the site will help to create vibrancy in the precinct
beyond the typical 9 – 5pm workday.
Such a destinational and unique offer, incorporating production, education, retail and dine in
elements, is envisioned for the Locomotive Workshop within ATP. This type of offer would
attract residents from broader metropolitan Sydney, these customers however, will not be
core customers and frequency of visitation is expected to be significantly lower than that of
the immediate resident and worker populations.
The primary focus for the proposed retail facilities at the Locomotive Workshop will be local
residents and workers. However, given the heritage significant of the Locomotive Workshop
and the intended retail and service offer, there is a significant opportunity to draw a
destination visitor population from a broader metropolitan region.
Locomotive Workshop, ATP, Eveleigh
37
Economic Impact AssessmentYou can also read