ENVIRONMENT CANADA'S EXPERIMENTAL NUMERICAL WEATHER PREDICTION SYSTEMS FOR THE VANCOUVER 2010 WINTER OLYMPIC AND PARALYMPIC GAMES
←
→
Page content transcription
If your browser does not render page correctly, please read the page content below
ENVIRONMENT CANADA’S
EXPERIMENTAL NUMERICAL
WEATHER PREDICTION SYSTEMS
FOR THE VANCOUVER 2010 WINTER
OLYMPIC AND PARALYMPIC GAMES
By J. Mailhot, s. Bélair, M. Charron, C. doyle, P. Joe, M. aBrahaMowiCz, n. B. Bernier,
B. denis, a. erfani, r. frenette, a. giguère, g. a. isaaC, n. MClennan,
r. MCtaggart-Cowan, J. MilBrandt, and l. tong
To provide the best possible guidance to the Olympic Forecast Team,
Environment Canada has developed several experimental numerical weather
prediction systems for the Vancouver 2010 Games.
O
n 2 July 2003, the International Olympic Committee
(IOC) awarded Canada with the rights to host
the 2010 Winter Games. The XXI Olympic and
X Paralympic Winter Games took place from 12 to
28 February and from 12 to 21 March 2010, respectively,
in the Vancouver, British Columbia, and Whistler, British
Columbia, areas. The 2010 Winter Games showcased the
highest-level competition at five indoor and four outdoor
venues. Indoor venues include ice hockey, short-track and
speed skating, figure skating, and curling, and were con-
centrated in the metropolitan Vancouver area. Outdoor
venues were north of Vancouver (see Table 1 and Figs. 1
and 2 for locations) and included Whistler Mountain
(alpine skiing), Blackcomb Sliding Centre (bobsleigh,
luge, and skeleton), Callaghan Valley Olympic Park
(cross-country skiing, ski jumping, biathlon, and nordic
Photograph taken from Whistler Mountain combined), and Cypress Bowl Mountain (freestyle skiing
looking northwest in the afternoon; a low- and snowboard events). Over 80 countries participated,
level cloud blankets Whistler Creekside bringing 5,500 athletes and officials to the 2010 Games.
(“Harvey’s cloud”), and a higher deck of
Two weeks later,
cloud obscures the mountain tops.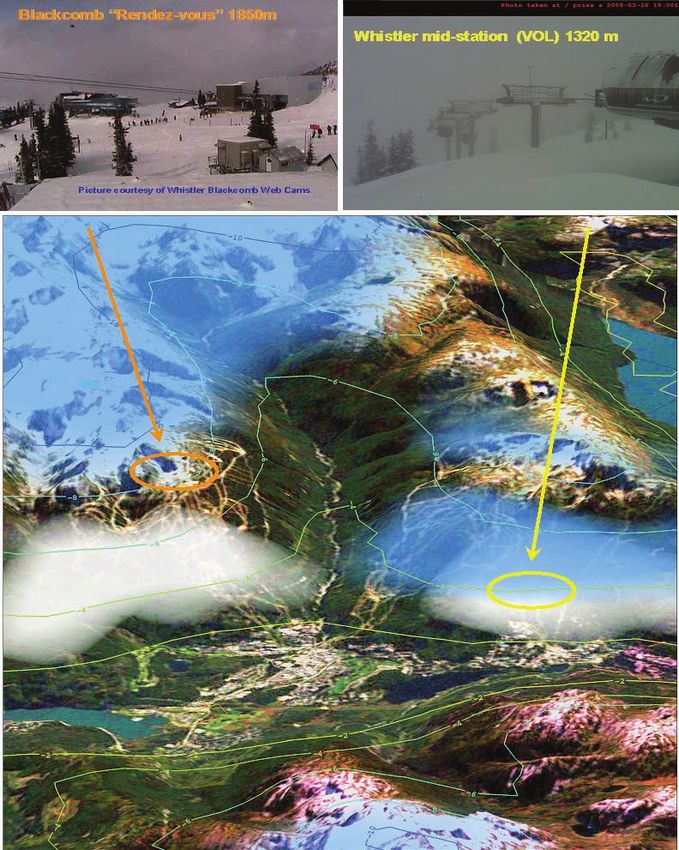
Fig 1 (top). Map of the main
                                                                                                         Olympic measurement sites
                                                                                                         (Environment Canada sites in
                                                                                                         yellow and British Columbia
                                                                                                         Ministry of Transport sites in
                                                                                                         white) including already exist-
                                                                                                         ing stations and new Vancou-
                                                                                                         ver 2010 Olympic Autostation
                                                                                                         Network (OAN) sites. The
                                                                                                         OAN instrumented sites are
                                                                                                         concentrated near the main
                                                                                                         outdoor venues : Whistler
                                                                                                         Mountain, Blackcomb Sliding
                                                                                                         Centre, Callaghan Valley, and
                                                                                                         Cypress Bowl Mountain. Note
                                                                                                         that the map does not show all
                                                                                                         the Olympic stations.

                                                                                                         Fig 2 (bottom). A map of the
                                                                                                         Whistler – Blackcomb area
                                                                                                         showing some of the Olympic
                                                                                                         observing sites, the gondola
                                                                                                         runs (yellow lines) where tem-
                                                                                                         perature, relative humidity
                                                                                                         and pressure measurements
                                                                                                         are taken, and the runs for
                                                                                                         the men’s (black trail) and
                                                                                                         women’s (red trail) downhill
                                                                                                         events. The three- or four-
                                                                                                         letter identifiers are defined
                                                                                                         in Table 1.

                                                                                                 with Environment Canada,
                                                                                                 through the Meteorologi-
                                                                                                 cal Service of Canada, to
                                                                                                 be the official provider of
                                                                                                 real-time weather services
                                                                                                 for the 2010 Winter Games.
                                                                                                 These weather forecasts,
                                                                                                 warnings, and information
                                                                                                 are essential for the safety
     the 2010 Paralympic Games brought the best athletes              and security of athletes, officials, spectators, and
     from over 40 countries to compete in Paralympic                  visitors, and for proper planning and preparation for
     alpine skiing, biathlon, cross-country skiing, ice               the games. As part of its mandate, in 2006 Environ-
     sledge hockey, and wheelchair curling.                           ment Canada began an extensive training program
        The Vancouver Organizing Committee contracted                 to develop an Olympic Forecast Team (OFT) with

Affiliations: Mailhot, Bélair, Charron, Abrahamowicz, Bernier,        Trans-Canada Highway, Numerical Prediction Research Section,
McTaggart-Cowan, and Milbrandt—Meteorological Research                Meteorological Research Division, Environment Canada, Dorval,
Division, Environment Canada, Dorval, Quebec, Canada; Joe and         QC H9P 1J3, Canada.
Isaac— Meteorological Research Division, Environment Canada,          E-mail: jocelyn.mailhot@ec.gc.ca
Toronto, Ontario, Canada; Doyle and McLennan — Meteorological
                                                                      The abstract for this article can be found in this issue, following the table
Service of Canada, Environment Canada, Vancouver, British Columbia,
                                                                      of contents.
Canada; Denis, Erfani, Frenette, Giguère, and Tong—Meteorological
                                                                      DOI:10.1175/2010BAMS2913.1
Service of Canada, Environment Canada, Dorval, Quebec, Canada
Corresponding author: Jocelyn Mailhot, Room 500, 2121                 In final form 26 February 2010

1074 |       AUGUST 2010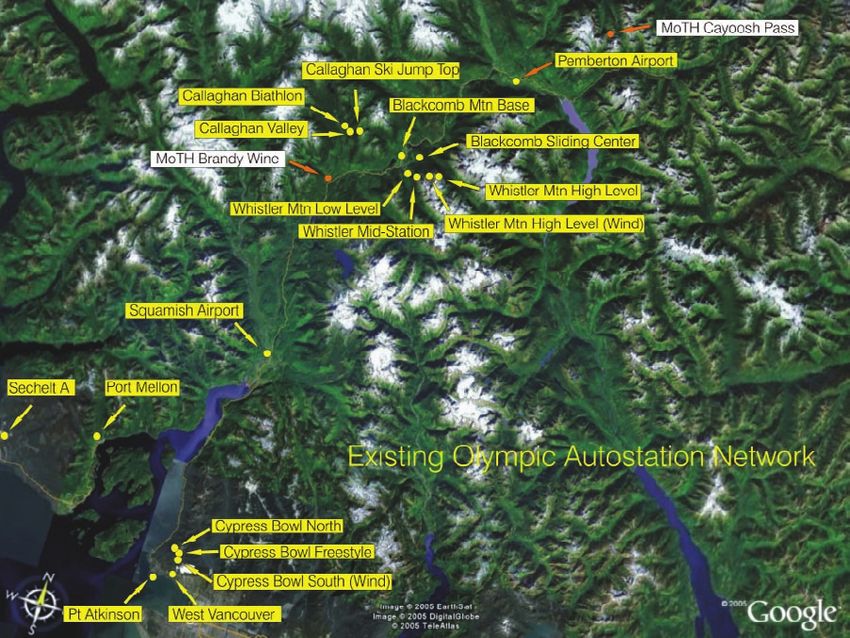
classroom training, several mountain weather work-        provided dedicated venue forecasts during the games.
   shops, and laboratories, as well as on-site venue prac-   An enhanced observing and monitoring network was
   ticum periods. The OFT, formed of 35 highly trained       also set up for the Olympics (details are given in the
   meteorologists from all regions of Canada and several     appendix). In addition to its current operational prod-
   forecasters from the U.S. National Weather Service        ucts, and in order to provide the best possible guid-
   offices in adjacent Washington State and Alaska,          ance and support to the OFT, Environment Canada

Table 1. List of the main Olympic measurement sites (already existing and new OAN sites) with their
identifiers, locations (latitude–longitude), and elevations.

    Main Olympic measurement sites              Identifier     Latitude (°N)      Longitude (°W)       Elevation (m)
Blackcomb Base Sliding Center Top                  VOI            50º06´09˝           122º56´11˝             937
Blackcomb Base Sliding Center Bottom               VON            50º06´22˝           122º56´32˝             817
Blackcomb Mountain Base/Nesters                    VOC            50º08´00˝          122º57´00˝              659
Callaghan Valley/Callaghan                         VOD            50º08´39˝           123º06´33˝             884
Callaghan Valley 1 (ski jump top)                 VOW             50º08´25˝           123º06´15˝             936
Callaghan Valley 2 (ski jump bottom)               VOX            50º08´25˝           123º06´25˝             860
Callaghan Valley 3 (biathlon)                      VOY            50º08´51˝           123º06´57˝             856
Cypress bowl Event (freestyle)                     VOZ            49º23´33˝           123º12´07˝             958
Cypress Bowl North/Cypress                         VOE            49º24´07˝           123º12´27˝             953
Cypress Bowl South/Cypress wind                    VOG            49º22´43˝           123º11´39˝             960
Mount Washington                                   VOJ            49º44´48˝           125º17´13˝             1474
North Cowichan                                     VOO            48º49´27˝           123º43´06˝              60
Pemberton Airport                                  WGP            50º18´09˝           122º44˝16˝             204
Pemberton Airport (wind)                           WPN            50º18´08˝           122º44´17˝             203
Pitt Meadows                                      WMM             49º12´00˝           122º40´48˝              5
Point Atkinson                                     WSB            49º20´00˝           123º16´00˝              35
Port Mellon                                        VOM            49º31´12˝          123º28´48˝              127
Powell River Airport                               VOP            49º50´03˝           124º30´01˝             125
Qualicum Airport                                   VOQ            49º20´14˝          124º23´38˝               65
Sechelt Airport                                    VOU            49º27´38˝           123º43´07˝              86
Squamish Airport 1                                 WSK            49º46´54˝           123º09´43˝              52
Squamish Airport 2: wind profiler                  XSK            49º46´54˝           123º09´43˝              52
Timing Flats                                       VOT            50 05´30˝
                                                                    o
                                                                                      122 58´49˝
                                                                                         o
                                                                                                             797
Vancouver International Airport                    YVR            49o 12´00˝          123o10´00˝              4
West Vancouver                                    WWA             49º20´50˝           123º11´31˝             168
Whistler Mountain High Level/Pig Alley             VOA            50º04´37˝           122º56´51˝             1640
Whistler Mountain High Level/remote wind           VOH            50º04´27˝           122º56´49˝             1643
Whistler Mountain Low Level/Creekside              VOB            50º05´17˝          122º58´32˝              933
Whistler Mountain Mid-Station                      VOL            50º05´07˝           122º57´51˝             1320
Whistler CWO Snowfall Verification System          WAE            50º08´00˝          122º57´00˝              659
White Rock                                        WWK             49º01´00˝           122º46´00˝              13

    Non-Environment Canada sites
MOC Roof Auto 8 and RVAS                           MOC            49º10´58˝           123º04´43˝              20
Roundhouse                                         RND            50o04´45˝          122o 56.818º            1856
Whistler Peak                                     AQRB            50o03´55˝          122o 57.485º            2165

   AMERICAN METEOROLOGICAL SOCIETY                                                             AUGUST 2010          | 1075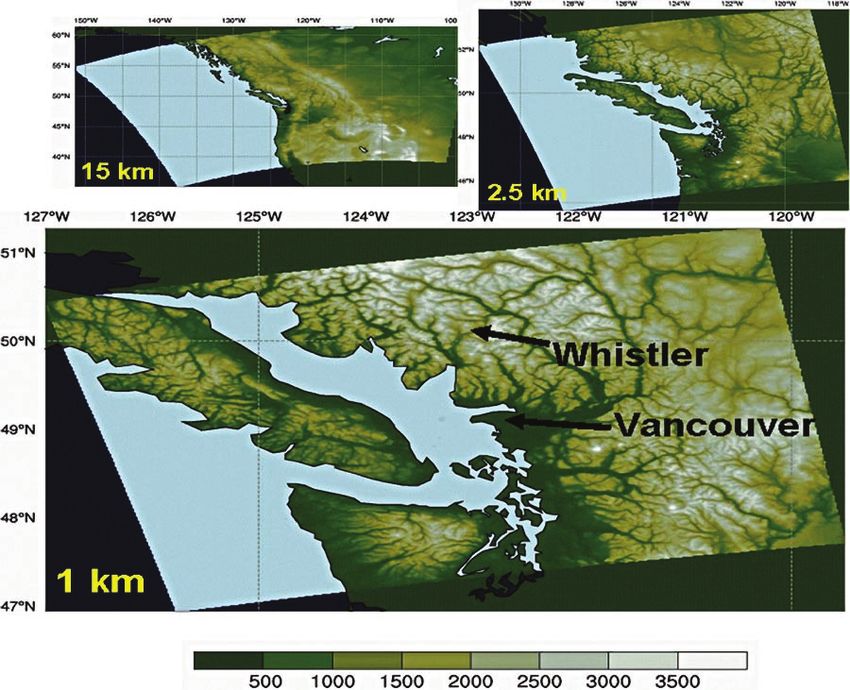
has developed the following experimental numerical         horizontal grid spacings, incorporating MesoWest
     weather prediction (NWP) systems for the Vancouver         observations into the near-surface initial conditions.
     2010 Games: 1) a regional ensemble prediction system       This Olympic system was found to often outper-
     (REPS), 2) a high-resolution deterministic prediction      form the operational models over complex terrain,
     system, and 3) an external land surface modeling           mostly because of its better resolution of orographic
     system at the microscales.                                 features.
        This paper focuses on a description of these ex-           For the 2006 Winter Games in Torino, Italy, the
     perimental numerical prediction systems, together          ARPA Piemonte Italian Weather Service developed
     with some examples and verification results from           an advanced system combining a very dense weather-
     the winters of 2008 and 2009 using the enhanced            observing network, high-resolution numerical mod-
     Olympic observing network.                                 eling, and a distributed weather office network with
                                                                well-trained forecasters (Oberto et al. 2007). New
     NWP support to the Winter Games.                           techniques and procedures were developed for the
     NWP in previous winter games. The Olympic Games            Torino Olympics, which led to a significant legacy
     have often been an opportunity to develop and test         for Alpine weather forecasting. Stauffer et al. (2007)
     new, advanced forecasting systems. For the 2002            showed that the accuracy of MM5 forecasts for the
     Winter Games in Salt Lake City, Utah, an Olympic           Torino 2006 Olympics increased, especially near the
     weather support system was developed by govern-            surface and in the boundary layer, with higher model
     ment agencies, private firms, and the University of        resolution (using an additional nested grid at 1.3 km)
     Utah (Onton et al. 2001; Horel et al. 2002). Apart         and with data assimilation of the special observing
     from the installation of several cooperative observ-       network.
     ing mesonetworks, and their later integration into
     MesoWest and SnowNet, real-time mesoscale nu-              NWP support to the Vancouver Games. Because of
     merical modeling was done using the fifth-generation       their proximity to the coastal waters of the Pacific
     Pennsylvania State University (PSU)–National Center        Ocean and the surrounding complex terrain, most
     for Atmospheric Research (NCAR) Mesoscale Model            Vancouver Olympic venues can experience a wide
     (MM5) with three nested grids of 36-, 12-, and 4-km        range of rapidly changing winter weather conditions
                                                                that pose great challenges for the forecasters. During
                                                                the month of February alone, for instance, typical
                                                                precipitation amounts vary from less than 130 mm
                                                                in the rain shadow of Vancouver Island to more
                                                                than 400 mm on the coastal mountains. Stretching
                                                                out from Vancouver to Whistler over a distance
                                                                of about 120 km, and serving as the main ground
                                                                transportation corridor, the Sea-to-Sky Highway
                                                                rises from sea level to an altitude of 660 m. The top
                                                                of the downhill ski runs are about 1000 m higher.
                                                                While it can be overcast and rainy in Vancouver and
                                                                Cypress Mountain, conditions at Callaghan Valley
                                                                and Whistler–Blackcomb can be a mix of rain and
                                                                snow, with low visibility resulting from fog and low
                                                                ceilings, and strong gusty winds at the mountaintops.
Fig 3. A profile of Whistler Mountain, the site of the
                                                                Local effects can be particularly important, with wind
downhill, slalom, and super G alpine events, showing
the elevation of various observation sites such as Nest-        channeling and drainage flow in the narrow moun-
ers (VOC), Timing Flats (TFL), Mid-Station (VOL), Pig           tain valleys, terrain-induced upslope flows leading to
Alley (VOA), Roundhouse (RND) and Whistler Peak                 fog and low cloud formation, such as Harvey’s Cloud
(AQRB). Harvey’s Cloud, a persistent cloud on the               at Whistler mid-mountain (Fig. 3), and heavy snow-
mountain, is marked in blue and constitutes a major             fall and rapid changes in precipitation types.
potential risk of reduced visibility for skiers, right in the       In addition to focusing more attention on the
middle of the downhill ski course. The cloud is fondly
                                                                various forecasting challenges at the Olympic ven-
named after Harvey Fellowes, a long-time employee
of the Whistler-Blackcomb ski resort, who spent quite           ues, the experimental NWP systems developed for
a few years on the hill and noted the looming and fre-          the Vancouver 2010 Winter Games were tailored to
quent presence of this cloud on the ski hill.                   fit several specific needs and requirements of the

1076 |      AUGUST 2010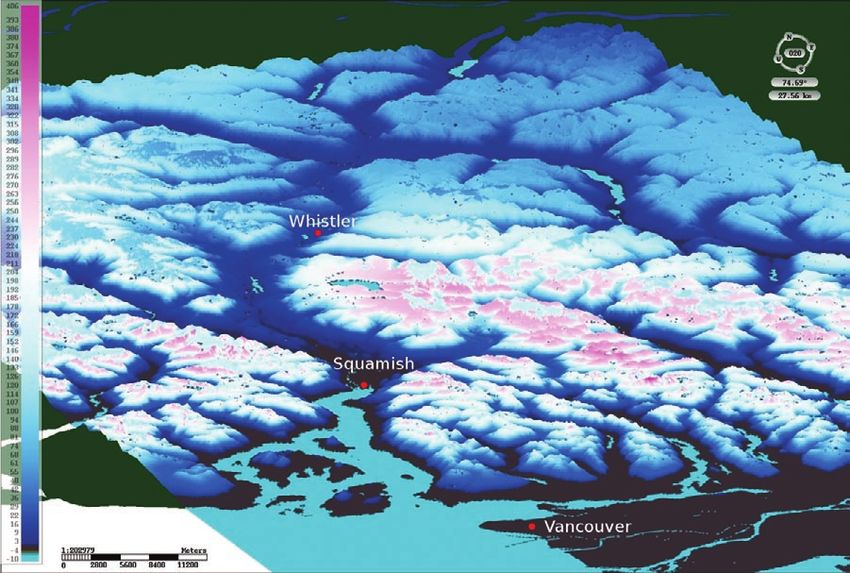
Table 2. The threshold matrix for the Alpine events (downhill, slalom, and giant slalom), showing the spe-
cific criterion used for decision factors by the competition judges with respect to various meteorological
conditions. Similar matrices exist for the other Olympic sport events.

Threshold matrix for downhill, slalom, and giant slalom events
                                                                                                                   Wind
                              New snow (24 h)                Wind                 Visibility          Rain         chill
                             > 30 cm                 Constant above 17 m s−1 < 20 m on entire     15 mm in 6 h    < −25°C
Critical decision point
                                                     or gusts > 17 m s−1     course               or less
                             > 15 cm and < 30 cm Constant 11–17 m s−1        20 m on portions     Mixed
Significant decision point
                                                                             of the course        precipitation
                             • 5 cm                  Gusts above 14 m s−1    > 20 m but < 50 m
Factor to consider           • 2 cm, within 2 h of   but < 17 m s−1          on all or part of
                               the event                                     the course

   users. Some Olympic competitions have extremely              global ensemble prediction system (EPS); each of its
   sensitive thresholds for their decision process. For         20 members are initialized and laterally driven by a
   instance, the Alpine events, such as the downhill,           global EPS member (100-km horizontal grid spacing).
   giant slalom, and slalom held at Whistler (Table 2),         Note that the global EPS is based on an ensemble
   rely on specific thresholds for a go/no-go decision.         Kalman filter assimilation system, including a repre-
   Weather elements that are considered include new             sentation of model errors and using four-dimensional
   snow or rain amounts over the last 6–24 h, winds             handling of observations that are valid at different
   and wind gusts, visibility on all or portions of the ski     times in the data assimilation window (Houtekamer
   course, and wind chill factor. Accurate information          et al. 2007, 2009). The model’s subgrid-scale pa-
   on such parameters influences critical and significant       rameterizations for the REPS are identical to the
   decision points or represents factors of consideration       deterministic GEM described in Bélair et al. (2009).
   by the event judges.                                         Stochastic perturbations are applied to the subgrid-
      The design and configuration of the experimental          scale physical tendencies of horizontal winds and
   NWP systems also took into account several strate-           temperature. An example of probabilistic precipita-
   gic constraints. These include the timely delivery of        tion forecast with the REPS is shown in Fig. 4, and
   model output products twice a day, complying with            other examples of REPS outputs will be shown in a
   the schedules of weather briefings of the Olympic            subsequent section.
   Forecast Team, which mainly focuses on the period               The Canadian REPS was one of the participating
   after the 6-h forecasts. Routinely, a morning briefing       systems in a Research Development Project (RDP)
   is held between 0700 and 0800 LT to provide en-              endorsed by the World Weather Research Programme
   hanced weather forecast guidance for the sport               (WWRP) of the World Meteorological Organization
   competitions of the day. An early afternoon briefing         (WMO) focusing on mesoscale ensemble forecasting
   (1300–1400 LT) provides updated forecasts to support         for the 2008 Beijing, China, Summer Olympics.
   competitions held in the evening (e.g., some nordic          During this period, a version of the REPS with 20
   and freestyle skiing events) and gives an outlook at the     members at 15-km horizontal grid spacing was run
   weather for the early morning of the next day.               daily.
                                                                   In the context of preparing dedicated weather
   Regional ensemble pre diction                                forecast systems for the Vancouver 2010 Winter
   system. In collaboration with McGill Univer-                 Olympics, the 33-km version of the REPS was first
   sity (Montréal, Quebec, Canada), a REPS has been             available to the OFT for evaluation and training dur-
   developed for probabilistic short-range weather              ing February 2008 and February 2009, and essentially
   forecasting. It is based on the limited-area version of      the same system was also available during the 2010
   the Global Environmental Multiscale Model (GEM-              games. After performing objective verification in
   LAM), with 20 members at 33-km horizontal grid               winter with a variety of probabilistic measures, it has
   spacing covering the North American continent                been decided that an REPS on a smaller domain with
   and adjacent oceans. The REPS is dependent on the            15-km grid length did not add value to the 33-km
   Canadian Meteorological Centre (CMC) operational             version. The latter version has thus been selected.

   AMERICAN METEOROLOGICAL SOCIETY                                                                AUGUST 2010         | 1077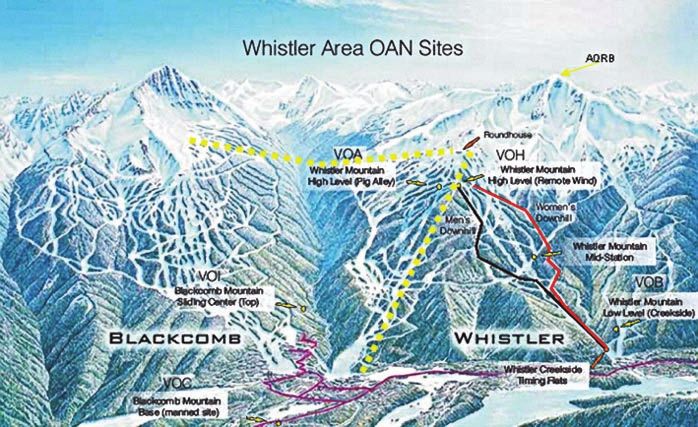
Fig 4. Example of probabilistic precipi-
                                                                        tation forecast with the 33-km REPS.
                                                                        The probability that the accumulated
                                                                        precipitation (equivalent liquid water)
                                                                        will be greater than 5 mm during the
                                                                        12-h time interval (forecast lead time
                                                                        from 36 to 48 hours) from 1200 UTC
                                                                        7 March to 0000 UTC 8 March 2009 is
                                                                        shown on the color bar. The Vancouver
                                                                        ( Y VR) , West Vancouver ( W WA) ,
                                                                        and Squamish (WSK) areas lie in the
                                                                        regions of 10% –30% of probability of
                                                                        precipitation (in pink) while Callaghan
                                                                        Valley (VOY), Whistler (VOA), and
                                                                        Pemberton (WGP) have probability of
                                                                        precipitation less than 10%.

                                                                          2006). Note that data assimilation
                                                                          is only used in the regional 15-km
                                                                          GEM runs. (Currently, no special
                                                                          mesoscale data assimilation system
                                                                          is available for the high-resolution
                                                                          GEM-LAM grids.) The configura-
                                                                          tion of the high-resolution modeling
                                                                          prototype is schematized in Fig. 6.
     Mesoscale deterministic predic-                    The 15- and 2.5-km grids of the Olympics system
     tion system. The second component of the           are essentially clones of the GEM-LAM system cur-
     experimental numerical prediction systems used     rently operational at CMC (Erfani et al. 2005), with
     for the Vancouver games is a high-resolution NWP   the main differences being that they are integrated
     model with improved geophysical fields and cloud   over a smaller domain and for a shorter period, and
     microphysics and radiation schemes, and with       that they use several improvements to the physics
     new diagnostic model outputs. This mesoscale       package, as follows:
     prediction system consists
     of three one-way-nested
     GEM-LAM grids (at 15-,
     2.5-, and 1-km grid spac-
     ings; see Fig. 5) integrated
     for 19 h, twice a day, from
     the 0000 and 1200 UTC re-
     gional 15-km GEM opera-
     tional runs (Mailhot et al.

Fig 5. The domains of the high-
resolution forecast prototype
for the Olympics consisting
of a cascade of three one-
way nested grids with 15-km,
2.5-km, and 1-km horizon-
tal grid -spacings covering
the Vancouver and Whistler
areas. The shading indicates
the terrain elevation (in m
according to scale at bottom
of figure).

1078 |     AUGUST 2010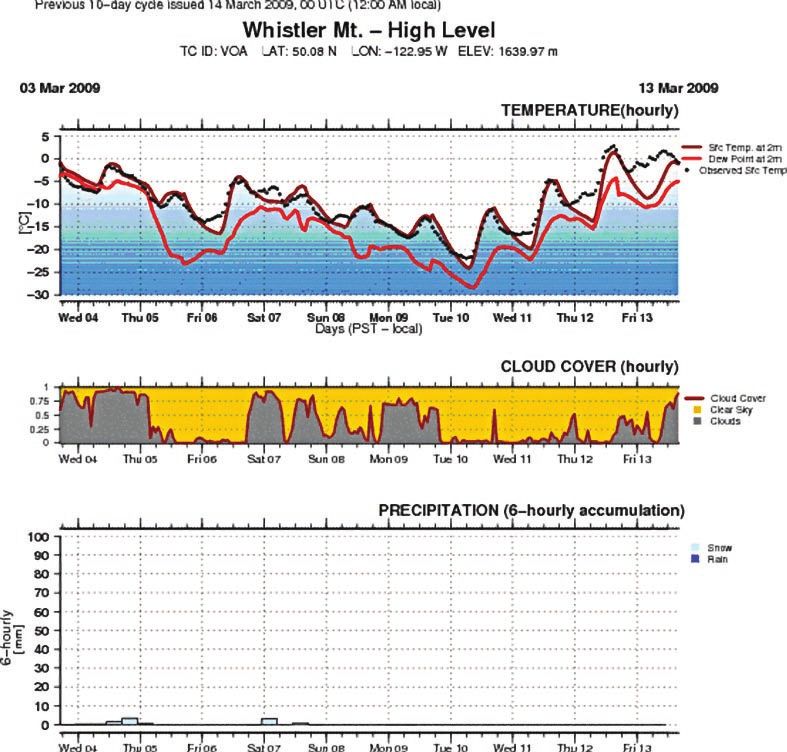
• Geophysical fields: Improved orography, land–sea         categories), which allows for the prediction of an
      mask, and surface roughness length fields have           instantaneous solid-to-liquid ratio (snow-water
      been generated from a recent geophysical database        equivalent) for solid precipitation (Milbrandt et al.
      at high resolution (90 m) using newly developed          2009). To the authors’ knowledge, this is the first
      geophysical processor software.                          time a fully double-moment microphysics scheme
    • Cloud microphysics scheme: The prototype uses            will be used for this type of operational forecast
      the double-version of the Milbrandt–Yau micro-           system.
      physics scheme (Milbrandt and Yau 2005) where          • Radiation and cloud–radiation interactions: The
      two moments of the particle size distribution,           radiative transfer scheme of Li and Barker (2005)
      proportional to the mass mixing ratio and total          has been included in the Olympic prototype, cor-
      number concentration, respectively, of each of           recting the cold bias during winter conditions and
      the six hydrometeor categories are independently         providing more realistic temperature forecasts
      predicted. The double-moment approach leads to           under such situations. Other components of the
      more accurate calculations of the microphysical          radiation package have also been improved, such
      growth/decay rates (source/sink terms) and sedi-         as cloud–radiation interactions (cloud optical
      mentation (i.e., precipitation) rates compared to        properties, liquid/solid partition, etc.).
      single-moment schemes, which predict only one
      moment (generally the mixing ratio), and are               Furthermore, special emphasis was put on de-
      more commonly used because of computational            veloping several new diagnostic outputs from the
      restraints. It also permits better identification of   high-resolution models, such as wind gusts, vis-
      particle types, for example, the distinction between   ibility, precipitation types, and snow-to-liquid ratio,
      drizzle and rain (for a given liquid water content),   all presented with a customized output package, as
      because the size distribution spectra can evolve       follows:
      more freely. Several other improvements to the
      microphysics parameterization have been made.          • Wind gusts and 10-m wind variances: Near-
      This includes a diagnostic bulk snow density             surface wind gusts associated with surface layer
      and a new precipitation rate (volume flux) of the        turbulence and large eddies in the boundary layer
      total unmelted “snow” (based on the combined             are diagnosed from the turbulent variables in
      precipitation rates of the ice, snow, and graupel        the model. Wind gusts [the wind gust estimate

                                                                                  Fig 6. The daytime configura-
                                                                                  tion (i.e. from 0000 UTC) of
                                                                                  the high-resolution modeling
                                                                                  prototype for the Vancouver
                                                                                  2010 Winter Olympics. The
                                                                                  cascade of integrations goes
                                                                                  the following way: 1) a GEM-
                                                                                  LAM 15-km run is initialized
                                                                                  from the 0-h forecast of the
                                                                                  Regiona l G E M 15 - k m r un
                                                                                  started at 0000 UTC (bound-
                                                                                  ary conditions for the GEM-
                                                                                  LAM integration are also pro-
                                                                                  vided by the regional run)
                                                                                  and integrated for 39 h until
                                                                                  1500 UTC the following day;
                                                                                  2) a GEM-LAM 2.5-km run is
                                                                                  initialized at 0600 UTC from
                                                                                  the 6-h forecast (allowing for
                                                                                  the model spinup period) of
the GEM-LAM 15-km run started at 0000 UTC (which also provides the boundary conditions) and integrated
for 33 h until 1500 UTC the next day; 3) the GEM-LAM 1-km run is then initialized at 1100 UTC from the 5-h
forecast of the 2.5-km run (which also provides the boundary conditions) and integrated for 19 h until 0600 UTC
the next day. The same procedure is repeated for the regional 15-km GEM run starting at 1200 UTC to provide
the Olympics cascade (15, 2.5, and 1 km) forecasts valid for the afternoon and evening (from 2000 to 1500 UTC;
i.e., from 1200 to 0700 LT).

    AMERICAN METEOROLOGICAL SOCIETY                                                            AUGUST 2010         | 1079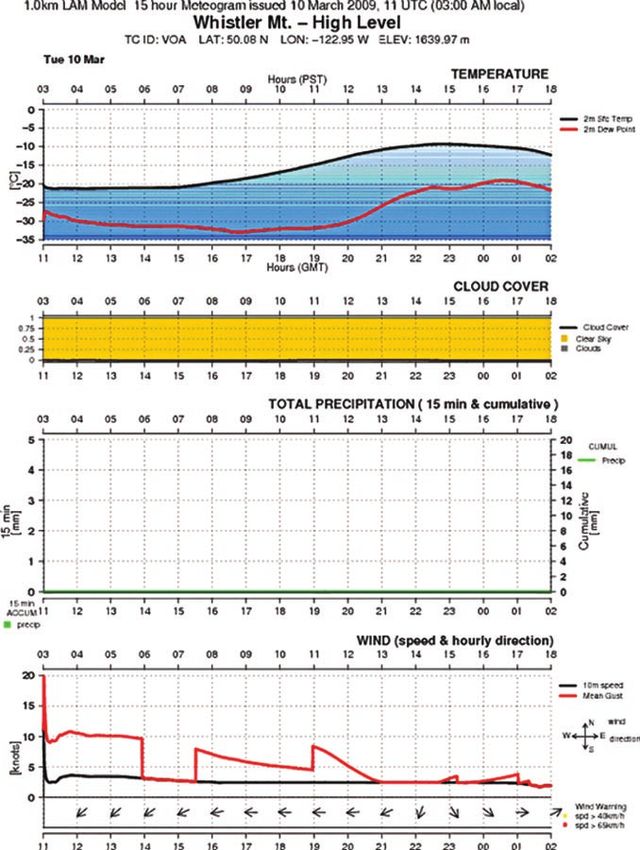
together with lower and upper bounds, based               includes 2D maps, time series or meteograms at
         on the method of Brasseur (2001)] and standard            a number of surface stations, cross sections along
         deviations of 10-m wind speed and direction are           specific lines, and vertical soundings at standard
         available as 2D output fields.                            and additional Olympic locations. Examples of
     •   Visibility: The visibilities through fog (cloud           these outputs will be presented later on.
         water), rain, and snow, and “total” visibility (re-
         sulting from the combined effects of the reduction     External land surface prediction
         of visibility from all three) are available as 3D      and assimilation system. Land surface
         diagnostic output variables. The computations          modeling is traditionally done “in line” in numerical
         are based on empirical relations to the cloud water    atmospheric models, with full two-way interactions
         content and the droplet number concentration,          between the atmospheric and surface components
         and the precipitation rates of drizzle/rain and        of the model. In this approach, the spatial resolution
         snow, respectively.                                    of the simulations is severely limited by the large
     •   Snow-to-liquid ratio of precipitating snow: As         computational cost of the atmospheric component
         mentioned above, the snow-to-liquid ratio of           of the coupled system.
         falling “snow” (ice crystals, aggregates, and              This limitation can be avoided, and significant
         graupel) is obtained as a new diagnostic output.       refinement in surface and near-surface forecasts (e.g.,
         The solid-to-liquid ratio can vary between values      air temperature, low-level winds, soil moisture, and
         of around 2.5 (for very dense snow, either heavily     snow canopy) can be achieved by running an external
         rimed or partially melted) to values of over 30 (for   high-resolution surface model in a prognostic mode
         very low-density snow, such as large aggregates).      driven in a one-way fashion by atmospheric forcing
     •   Various diagnostic levels: Several 2D fields have      provided either by a coarser-resolution atmospheric
         been added, such as the heights above ground of        model or by observations. Because a surface model
         cloud base, freezing levels (either as the first 0°C   can run at a fraction of the cost of the atmospheric
         isotherm from the ground or from above), and           component, its spatial resolution is mainly limited
         snow level (lowest level with a nonzero falling        by the resolution of the datasets available to define
         snow rate).                                            the local characteristics of the land surface (e.g.,
     •   Customized output package: Based on the feed-          orography, vegetation, and soil characteristics). Two
         back from the OFT after the practicum periods          strategies are proposed to achieve this refinement of
         of winters 2008 and 2009, a list of useful products    surface and near-surface numerical forecasts for the
         has been finalized, together with specifications       Vancouver 2010 Winter Games.
         related to the display format that could be easily
         used by the forecasters at the different OlympicTwo-dimensional high-resolution external land surface
         venues. The comprehensive list of model outputs model. The first strategy uses the external high-
                                                                         resolution (or microscale) prognos-
                                                                         tic surface model driven from 0 to
                                                                         48 h by available outputs from the
                                                                         operational 15-km regional model
                                                                         (Mailhot et al. 2006) and from the
                                                                         33-km global medium-range model
                                                                         (Bélair et al. 2009) afterward (up to
                                                                         96 h). The approach is schematically
                                                                         illustrated in Fig. 7. For numerical
                                                                         predictions over natural land covers,
                                                                         the Interactions between Surface,
                                                                         Biosphere, and Atmosphere (ISBA;
                                                                         Noilhan and Planton 1989) land sur-
                                                                         face scheme is integrated on a 100-m
                                                                         grid over a 140 km × 180 km domain
                                                                         (1400 × 1800 points; see Fig. 8).
Fig 7. Schematic description of the external high-resolution surface         The best-available land surface in-
system proposed for deterministic predictions during the Vancouver       formation was compiled and used to
2010 Winter Olympics.                                                    define local land characteristics. For

1080 |       AUGUST 2010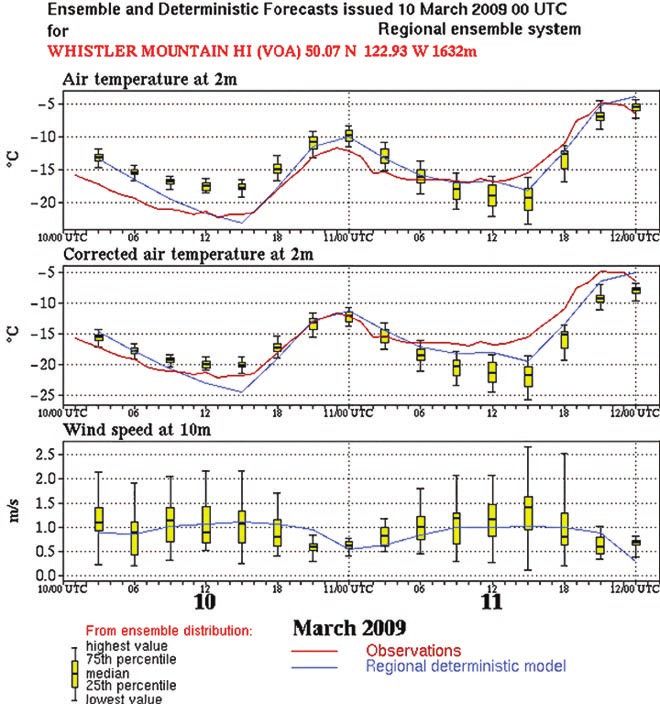
instance, microscale topo-
graphic information was
obtained from the Shuttle
Radar Topography Mission
Digital Elevation Model
(SRTM-DEM) to specify
the orography over the do-
main of the microscale sur-
face model (Fig. 8). Several
new databases have also
been acquired for land use–
land cover (LULC), such as
the GlobCover global data-
base at 300 m and several
Canadian databases ob-
tained from the Canadian
Centre for Remote Sensing
(CCRS) at 250 m and from
the Earth Observation for         Fig 8. The domain of the 1400x1800 computational grid of the external
Sustainable Development           microscale (100-m horizontal grid-spacing) surface system. The colors
of Forests (EOSD) at 25 m.        indicate an example of snow depth produced by the 100-m surface prediction
    The atmospheric forcing       system. Snow depth according to scale at left of figure.
fields required to drive the
external land surface system (i.e., low-level air tem- adapted 15-km regional outputs without any direct
perature, humidity, and winds, as well as surface assimilation of observations (in a so-called “open
pressure, downwelling shortwave and longwave loop” manner).
radiation, and precipitation) are provided by the
lower-resolution regional and global atmospheric Single-point external land surface prediction system. In
models. Some of these forcing variables are down- this other external system, the land surface scheme
scaled to the high-resolution external land surface ISBA land surface model is integrated at particular
computational grid in a simple manner. Knowing locations only (i.e., at a set of single-point locations
the exact height difference (for each point) of orog- corresponding to the OAN surface observing sta-
raphy between the high-resolution (100 m) external tions), for which local characteristics such as eleva-
computational grid and the low-resolution atmo- tion, vegetation type, and vegetation fractional cov-
spheric forcing grid, and assuming a constant lapse erage, are well known. The single-point forecasts are
rate of 0.0060 K m−1, it is possible to adapt or down- also driven by downscaled atmospheric forcing from
scale surface pressure and air temperature from the the 15-km regional model for the first 48 h and from
15- or 33-km GEM forecasts using the hydrostatic the 33-km global model for the next 48 h.
approximation. This adapted air temperature is              The land surface initial conditions used in these
then used to downscale low-level air humidity, by predictions are obtained with an approach similar to
assuming conservation of relative humidity, and the external 2D microscale system, except, however,
to possibly change precipitation phase. Despite its that atmospheric forcing is provided by station obser-
simplicity, this adaptation process leads to a more vations (when available; otherwise, forcing is provided
realistic representation of the spatial variability of by the regional model), and snow depth observations
surface variables in complex terrain, as shown by are assimilated using a simple optimal interpolation
the snow depth forecast given in Fig. 8.                 technique. This improvement in initial conditions
    As a preliminary step pending the development is clearly an advantage compared with the above 2D
of a detailed land data assimilation system, initial system, and indeed led to much improved predictions
conditions of the prognostic surface variables (e.g., of surface and near-surface conditions (even though
snow surface temperature, snow depth, etc.) are only at the surface observational stations). The single-
simply obtained from the 24-h external microscale point system was successfully tested during the 2008
forecast of the previous day. In this simple approach, and 2009 practicums, and an example of the products
the atmospheric forcing is thus provided by the is shown in the next section.

AMERICAN METEOROLOGICAL SOCIETY                                                      AUGUST 2010        | 1081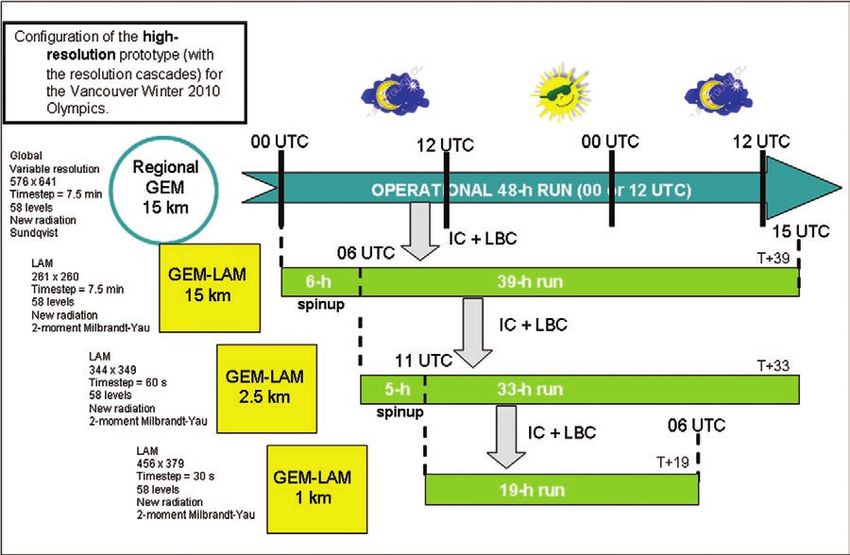
Examples of Olympic prototype
                                                        forecasts and verifications. Objec-
                                                        tive verification of high-resolution models poses many
                                                        challenges and must be based on high-resolution ob-
                                                        servation networks, such as surface mesonetworks
                                                        and radar imagery. We took advantage of the new
                                                        OAN for verification of the high-resolution Olympic
                                                        prototype. Despite a relatively large number of surface
                                                        stations (about 40), it is recognized that the OAN is
                                                        concentrated over a rather small region covering the
                                                        Olympic venues (cf. Fig. 1). Preliminary verification
                                                        of the high-resolution 3D deterministic model work
                                                        was based on 10 cases of significant weather from the
                                                        winter of 2008, which, according to the practicum
                                                        forecasters, were representative of “bad” weather
                                                        conditions over the various Olympic sites. These
                                                        cases included frontal passages, valley clouds, heavy
                                                        snowfall, mixed-phase precipitation, and strong wind
                                                        gust events. Objective verification scores against the
                                                        OAN for the 10 cases indicate significant improve-
Fig 9. Time evolution (1–15-h forecasts) of objective   ments with the 1-km grid for the near-surface winds
verification scores [root-mean-square (RMS) errors
                                                        (Fig. 9) compared to the 2.5-km and the regional
and bias] against the OAN for 10 cases of winter 2008
for 10-m wind speeds (in knots). Notable improve-       15-km models. For temperatures (not shown), both
ments are found with the 1-km model (in blue) for the   the 1- and the 2.5-km grid configurations show no-
winds compared to the 2.5-km model (in red) and the     table improvements compared to the regional 15-km
regional 15-km model (in green).                        model. Objective verification has continued through-
                                                                                    out the winter 2009 practi-
                                                                                    cum period, together with
                                                                                    subjective verifications and
                                                                                    feedback from the Olympic
                                                                                    forecast team.
                                                                                       Some examples of the
                                                                                    Olympic prototype model
                                                                                    out put s a re s how n i n
                                                                                    Figs. 10–12. They are drawn
                                                                                    mostly from the forecast
                                                                                    experience of A. Giguère,
                                                                                    one of the forecasters on the

                                                                                   Fig 10. Point forecast of the
                                                                                   single-point surface model at
                                                                                   VOA (Whistler Mountain High
                                                                                   Level–Pig Alley) for the period
                                                                                   from 4 to 13 March 2009 for
                                                                                   2-m air temperature ( °C),
                                                                                   2-m dew point temperature
                                                                                   (°C), cloud cover, and precipi-
                                                                                   tation (mm) . Temperature
                                                                                   observations appear as black
                                                                                   dots. Note how the forecasts
                                                                                   of temperature fit well the
                                                                                   observations but their minima
                                                                                   are generally too low under
                                                                                   clear skies conditions.

1082 |     AUGUST 2010
Fig 11 (left). Combined meteograms of
ensemble and deterministic forecasts at
VOA (Whistler Mountain High Level–
Pig Alley) for 10-11 March 2009. Regional
Ensemble Prediction System (REPS)
forecasts for 2-m air temperature,
“corrected” 2-m air temperature, and
10-m wind speed (m s –1). Deterministic
forecasts from the Regional 15-km GEM
are shown in blue and observations of
air temperature are shown in red (wind
observations are missing). Corrected
2-m air temperature is obtained us-
ing a dry adiabatic lapse rate between
the actual altitude of the observation
station and the corresponding model
terrain height.
F i g 12 ( b e low ) . Meteograms of the
Olympic GEM - L AM 1-km forecasts
starting at 1100 UTC 10 March 2009 at
VOA (Whistler Mountain High Level–
Pig Alley) for surface temperature and
dew point, cloud cover, precipitation,
wind (speed and hourly direction) and
estimated wind gust.
OFT, at the Alpine ski venue during the 2009
practicum period (January–March 2009),
which represented the final opportunity to
test the Olympic prototype in an operational
setting. A forecast challenge came up on
10 March 2009 with expected very low tem-
peratures combined with winds, so that the
wind chill factor could be an issue during
practice runs for a Paralympic Alpine Ski-
ing World Cup downhill event. Models were
consistent in forecasting wind chill factors of
−25°C or less (not shown), which are rather
infrequent in Whistler, especially in March.
Two useful tools for anticipating those very
low temperature minima were the meteograms
of the single-point surface model (Fig. 10) and
those combining the REPS forecast and the
deterministic output of the GEM regional
model (Fig. 11). In general, the single-point
surface model gave impressive forecasts for the
daytime temperature maxima and minima in
agreement with observations, except under
clear skies where the minima are too low. On
10 March, near-record-low dewpoint tempera-
tures (with values of around −30°C) were also
both forecasted (Figs. 10 and 12) and observed
(not shown), resulting in relative humidity of
less than 20%. Although models were doing
well on forecasting these values (cf. Figs. 10
AMERICAN METEOROLOGICAL SOCIETY AUGUST 2010 | 1083that it was snowing at VOL and VOA
(Whistler Mountain High Level-Pig
Alley; cf. Table 1 and Figs. 2 and 3)
and that the precipitation was form-
ing lower down the mountain. The
corresponding forecast (Fig. 13) at
1900 UTC (1200 LT) from the GEM-
LAM 1-km prototype indicates the
presence of several cloud layers with
low cloud bases over Whistler Valley
and higher cloud bases over the
mountains, with the lower-based Sc
cloud deck being “pushed” up the
valley.
Outlook. Following the 2009
practicum period, a few adjust-
ments to the experimental numeri-
cal prediction systems have been
done to produce the final version
of the Olympics high-resolution
forecasting systems, which were
delivered in time for t he 2010
Olympic and Paralympic Games.
As in previous winter games (e.g.,
Salt Lake City and Torino), the
Vancouver 2010 games presented a
unique opportunity to leave a sig-
nificant legacy through science and
technology with the development
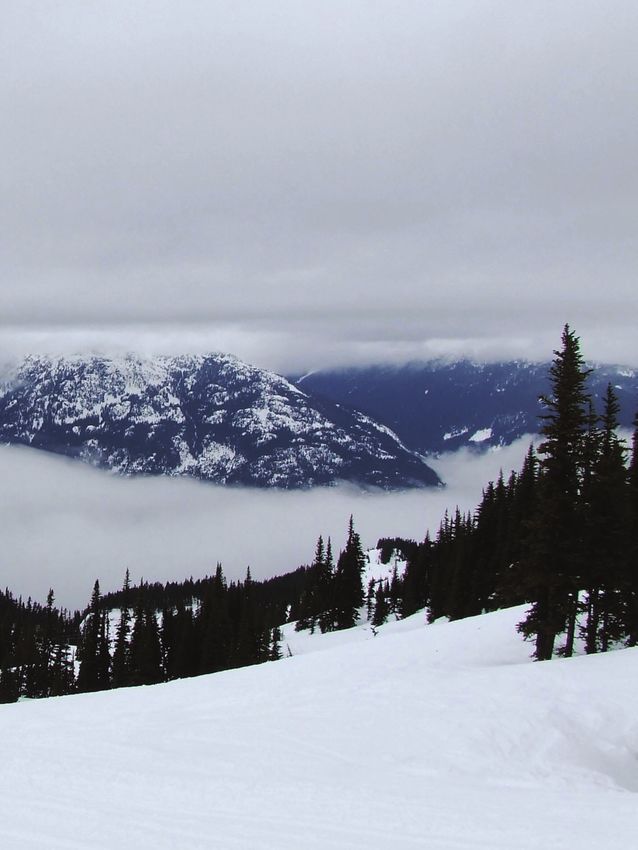
Fig 13. Pictures from the Whistler and Blackcomb web cameras at
Mid-Station VOL (upper right) and “Rendez-vous” (upper left) loca- and testing of new EPS and high-
tions taken at 1900 UTC (12:00 local time) on 16 March 2009 with resolution NWP systems, microscale
the corresponding GEM-LAM 1-km forecast of isotherms of 2-m air surface adaptation models, and
temperature [color contours (°C)] and of clouds containing liquid nowcasting systems. These advanced
droplets (white shading) and ice crystals (blue shading). systems have been used daily by the
forecasters of the OFT during the
and 12), forecasters were actually reluctant to forecast games in their internal weather discussions, their
dewpoints so low, and their adjusted forecast dewpoints forecasts, and their preparation for daily briefings
ended up being at least 5° too high. with competition venue managers and team coaches,
As already mentioned, another interesting forecast especially for weather-sensitive events such as alpine
challenge is the generation of a stratocumulus (Sc) skiing, freestyle skiing aerials, and ski jumping. In
cloud deck forming in the Whistler valley flow and the future, these systems will improve Environment
clinging to the mountainside, the so-called Harvey’s Canada’s predictive capability for high-impact win-
Cloud. This occurred, for instance, on 16 March 2009 ter weather in complex alpine terrain through their
and allowed for assessment of the height of cloud transfer to the operational activities of the CMC and
bases predicted by the LAM Olympic prototype. The regional storm prediction centers and through the
pictures taken by the Whistler–Blackcomb webcams training of operational meteorologists familiar with
(Fig. 13) indicate that Whistler Mountain Mid-Station those new tools.
(VOL) was in the fog while the top of Blackcomb
Mountain (“Rendez-vous”) was simply overcast by Acknowledgments. The development and final
an elevated cloud layer, with a Sc cloud deck that configuration of the experimental NWP systems greatly
was visible down below. The visibility sensor and benefited from the continuous feedback from our col-
snowfall-rate observations (not shown) also confirm leagues from the Pacific Storm Prediction Centre (PSPC)
1084 | AUGUST 2010in Vancouver, Brad Snyder and Trevor Smith, and from Conf. on Mesoscale Processes, Albuquerque, NM,
the Olympic Forecaster Team (in particular, Ivan Dubé, Amer. Meteor. Soc., 1M.4. [Available online at http://
Matt Loney, Carl Dierking, and Andrew Teakles). The ams.confex.com/ams/pdfpapers/97308.pdf.]
collaboration of Xiaoli Li and Prof. Peter Yau of McGill Horel, J., T. Potter, L. Dunn, W. J. Steenburgh,
University in the development of the REPS, of André Plante M. Eubank, M. Splitt, and D. J. Onton, 2002: Weather
(CMC) for the mesoscale objective verification package, support for the 2002 Winter Olympic and Paralympic
and of Jean-Philippe Gauthier (CMC) for the generation Games. Bull. Amer. Meteor. Soc., 83, 227–240.
of images is warmly acknowledged. Thanks are also due Houtekamer, P. L., M. Charron, H. L. Mitchell, and
to Al Wallace, director of PSPC, for providing some of the G. Pellerin, 2007: Status of the global EPS at En-
material presented in the introduction. The final version of vironment Canada. Proc. ECMWF Workshop on
the manuscript benefited from the constructive comments Ensemble Prediction, Reading, United Kingdom,
of two anonymous reviewers. ECMWF, 57–68.
—, H. L. Mitchell, and X. Deng, 2009: Model error
Appendix: A special observing net- representation in an operational ensemble Kalman
work for the Olympics. Until 2007, filter. Mon. Wea. Rev., 137, 2126–2143.
the mountainous corridor between Vancouver and Li, J., and H. W. Barker, 2005: A radiation algorithm
Whistler was rather data sparse; there were a few with correlated-k distribution. Part I: Local thermal
stations around Vancouver, an automated station at equilibrium. J. Atmos. Sci., 62, 286–309.
Squamish (about midway between Vancouver and Mailhot, J., and Coauthors, 2006: The 15-km version
Whistler), and a partial day–manned observing sta- of the Canadian regional forecast system. Atmos.–
tion at Whistler. An enhanced monitoring system has Ocean, 44, 133–149.
been set up for the Olympics, consisting of an OAN Milbrandt, J. A., and M. K. Yau, 2005: A multimoment
and several sites instrumented with various types of bulk microphysics parameterization. Part II: A pro-
profilers (boundary layer wind profilers, microwave posed three-moment closure and scheme description.
radiometers, ceilometers, visibility meters), a C-band J. Atmos. Sci., 62, 3065–3081.
weather radar and two vertically pointing X-band —, D. Jacob, and R. McTaggart-Cowan, 2009: Fore-
radars, and supplementary radiosondes. The main casting the solid-to-liquid ratio of precipitation in
Olympic measurement sites are listed in Table 1. The a cloud-resolving model. Preprints, 23rd Conf. on
OAN (Figs. 1 and 2) consists of about 40 standard and Weather, Analysis, and Forecasting/19th Conf. on
special surface observing sites with hourly or synoptic Numerical Weather Prediction, Omaha, NE, Amer.
reports available on the Global Telecommunication Meteor. Soc., 7A.2. [Available online at http://ams.
System (GTS) of surface pressure, temperature, rela- confex.com/ams/pdfpapers/154287.pdf.]
tive humidity, wind speed and direction, precipitation Noilhan, J., and S. Planton, 1989: A simple parameter-
rate, and snow depth. The installation of the entire ization of land surface processes for meteorological
network was completed in the autumn of 2007, giving models. Mon. Wea. Rev., 117, 536–549.
two complete winters of learning from the data before Oberto, E., D. Cane, M. Turco, and P. Bertolotto, 2007:
the 2010 Winter Games. Weather service for the XX Olympic Winter Games:
Forecast evaluation. Preprints, 29th Int. Conf. on
Alpine Meteorology, Chambéry, France, WMO.
References Onton, D. J., A. J. Siffert, L. Cheng, W. J. Steenburgh,
Bélair, S., M. Roch, A.-M. Leduc, P. A. Vaillancourt, and B. Haymore, 2001: Regional scale modeling for
S. Laroche, and J. Mailhot, 2009: Medium-range the 2002 Olympic Winter Games. Preprints, Ninth
quantitative precipitation forecasts from Canada’s Conf. on Mesoscale Processes, Fort Lauderdale, FL,
new 33-km deterministic global operational system. Amer. Meteor. Soc., J25–J26.
Wea. Forecasting, 24, 690–708. Stauffer, D. R., G. K. Hunter, A. Deng, J. R. Zielonka,
Brasseur, O., 2001: Development and application of a K. Tinklepaugh, P. Hayes, and C. Kiley, 2007: On
physical approach to estimating wind gusts. Mon. the role of atmospheric data assimilation and model
Wea. Rev., 129, 5–25. resolution on model forecast accuracy for the Torino
Erfani, A., J. Mailhot, S. Gravel, M. Desgagné, P. King, Winter Olympics. Preprints, 22th Conf. on Weather
D. Sills, N. McLennan, and D. Jacob, 2005: The high Analysis and Forecasting/18th Conf. on Numerical
resolution limited area version of the Global Envi- Weather Prediction, Park City, UT, Amer. Meteor.
ronmental Multiscale model (GEM-LAM) and its Soc., 11A.6. [Available online at http://ams.confex.
potential operational applications. Preprints, 11th com/ams/pdfpapers/124791.pdf.]
AMERICAN METEOROLOGICAL SOCIETY AUGUST 2010 | 1085You can also read