INSIGHTS FOR TEACHERS - NMSSA Mathematics and Statistics 2018 - National Monitoring Study of Student Achievement ...
←
→
Page content transcription
If your browser does not render page correctly, please read the page content below
N MSSA Rep o r t 19- IN

INSIGHTS
FOR TEACHERS
NMSSA Mathematics
 and Statistics 2018
NMSSA
                                                                                                       2018 Project Team                 EARU                         NZCER
                                                                                                       Management Team                   Sharon Young                 Charles Darr
                                                                                                                                         Albert Liau
             Wā n a n g a t i a t e P u t a n g a Ta u i r a                                                                             Lynette Jones
                                                                                                                                         Jane White
             National Monitoring Study
             of Student Achievement                                                                    Design/Statistics/                Alison Gilmore               Charles Darr
                                                                                                       Psychometrics                     Albert Liau                  Hilary Ferral
    Published on behalf of the Ministry of Education by Educational Assessment Research Unit (EARU),                                     Mustafa Asil                 Jess Mazengarb
    University of Otago, PO Box 56, Dunedin 9054, New Zealand.
                                                                                                       Curriculum/Assessment/            Jane White                   Linda Bonne
    https://nmssa.otago.ac.nz                                                                          Task development                  Sharon Young                 Jonathan Fisher
    NMSSA Report 19-IN: Insights for Teachers - NMSSA Mathematics and Statistics 2018                                                                                 Teresa Maguire
    ISSN: 2350-3238       ISBN: 978-1-927286-53-1                                                      Insights reporting                                             Linda Bonne
    Available online only at http://nmssa.otago.ac.nz                                                                                                                 Charles Darr
                                                                                                                                                                      Teresa Maguire
    © Crown 2020. All rights reserved.
    Images are copyright © Crown 2020 on pages 4, 10, 13, 28.                                          Programme Support                 Lynette Jones                Jess Mazengarb
                                                                                                                                         Linda Jenkins
    NMSSA is conducted by EARU and NZCER under contract to the Ministry of Education, New Zealand.                                       James Rae
                                                                                                                                         Fiona Rae
                                                                                                                                         Lee Baker
                                                                                                       External Advisors: Jeffrey Smith – University of Otago, Marama Pohatu – Te Rangatahi Ltd

2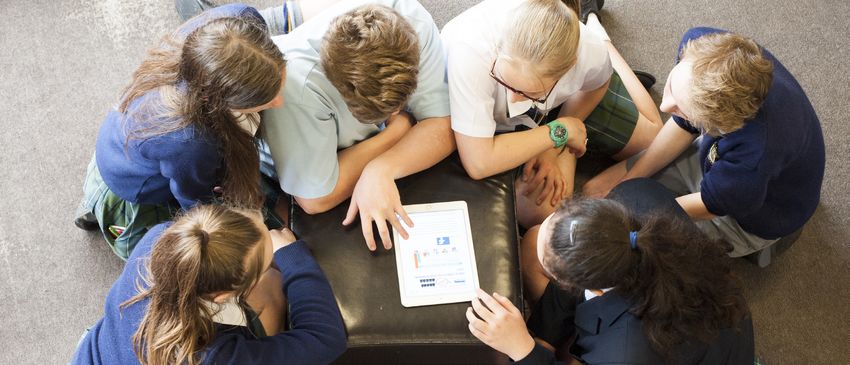
CONTENTS
Part 1: The NMSSA mathematics and statistics assessment                 4
        What is NMSSA?                                                  4
        The 2018 NMSSA mathematics and statistics assessment            5
        The NMSSA mathematics and statistics scale                      6
        How did students do on the 2018 mathematics
        and statistics assessment?                                       6

Part 2: Insights about mathematics learning                             8
  Spatial reasoning: Introduction                                       10
  Insight 1: Using the language of spatial reasoning helps students
		           to communicate their thinking
		           Task: Moving Models                                        12
  Insight 2: Spatial reasoning involves visualisation and mental
		 manipulation
		           Task: Building in the Mind’s Eye                           16
  Fractions and percentages: Introduction                               22
  Insight 1: Students need to work with different models of fractions
		           Task: Fractions                                            23
  Insight 2: Understanding percentages begins early
		           Task: Clothes for Sale – Year 4
  Insight 3: Successful problem solving with percentages
                                                                        24
                                                                             The purpose of this report
		           requires students to identify and represent                     This report is designed to support the teaching of mathematics and statistics in primary
		           multiplicative relationships                                    and intermediate classrooms. It draws on insights generated from the assessment of
		           Task: Percentage Problems                                  26   the mathematics and statistics learning area carried out by the National Monitoring
                                                                             Study of Student Achievement (NMSSA) in 2018.
  Collaborative problem solving: Introduction                           29
             Task: Moving and Jumping                                   30   The report is in two main parts. Part 1 introduces NMSSA and the NMSSA assessment
                                                                             of mathematics and statistics. Part 2 presents practical insights relating to three focus
  Insight 1: Most students can collaborate on a task that is
                                                                             areas: spatial reasoning, fractions and percentages, and collaborative problem solving.
		           engaging and clearly structured                            34
  Insight 2: Working systematically and making links between
		           problems enhances task success                             35
  Insight 3: Thinking algebraically involves using a range
		           of problem-solving strategies                              37

Useful resources and references                                         41

                                                                                                                                                                         3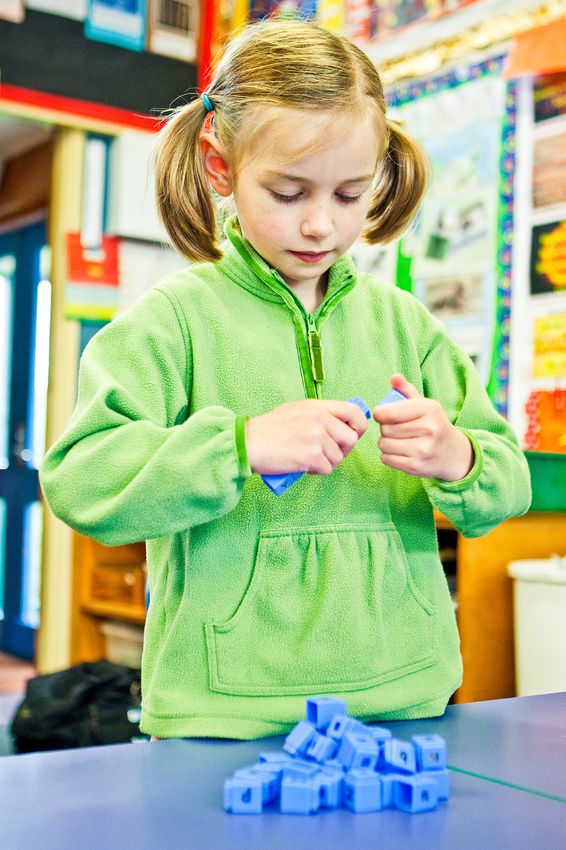
PART 1
       The National Monitoring Study of Student Achievement
       mathematics and statistics assessment

    What is NMSSA?
    NMSSA is designed to assess student achievement across the New Zealand Curriculum (NZC) (Ministry of Education, 2007) at
    Year 4 and Year 8 in New Zealand English-medium state and state-integrated schools. Each year, nationally representative samples
                                                                                                                                       NMSSA
                                                                                                                                       Wā n a n g a t i a t e P u t a n g a Ta u i r a
    of students from 100 schools at each of these two year levels are assessed in one or more learning areas. The mathematics and      National Monitoring Study
    statistics learning area was assessed in 2013 and again in 2018.                                                                   of Student Achievement

4
The 2018 NMSSA mathematics
and statistics assessment
To assess the Mathematics and Statistics learning area in 2018, the NMSSA project
team developed a two-part assessment called the Mathematics and Statistics (MS)
assessment.
The first part was a group-administered paper-and-pencil assessment which
was completed by up to 25 students in each school. It was made up of a mixture
of multi-choice and short-answer questions. Students completed one of
14 assessment forms which were carefully linked together using common items.
The second part of the assessment involved several ‘in-depth’ tasks, which
were completed by up to six of the students who did the group-administered
assessment in each school. Students were videoed while they worked on these
tasks, usually in a one-to-one interview with a teacher assessor (TA). The tasks
included a focus on students explaining their mathematical thinking, describing
and applying problem-solving strategies, and collaborating with a partner.

                                                                                    5
PART 1: The National Monitoring Study of Student Achievement mathematics and statistics assessment

    The NMSSA mathematics and statistics scale
    NMSSA used students’ responses to both parts of the 2018 assessment to construct a
    measurement scale–the mathematics and statistics (MS) scale1.
    The figure on the facing page shows the MS scale. The descriptors show how students’
    mathematics and statistics understandings increase in sophistication as the scale
    score increases and indicate the sorts of things students typically know and can do
    when they score at different parts of the scale. For example, a student scoring about
    110 units on the scale would typically be able to do the things described at that level.
    They would generally find the skills and knowledge described lower on the scale more
    straightforward. The descriptors further up the scale would typically involve knowledge                                                                        Year 4                 Year 8
                                                                                                                                                          180
    they were less clear about or skills they were unable to demonstrate consistently.
    It is important to note that the scale descriptors represent the knowledge and skills                                                                 160
    that were measured by the assessment items and are not intended to represent the
    mathematics2 learning area in its entirety.                                                                                                           140
                                                                                                                                                                                 Level

                                                                                                                                       scale score (MS)
                                                                                                                                                                                  4+
                                                                                                                                                          120
    How did students do on the 2018 mathematics                                                                                                                                 Level 3
    and statistics assessment?                                                                                                                            100

    The graph shows Year 4 and Year 8 students’ achievement on the 2018 NMSSA                                                                             80                    Level 2
    mathematics and statistics assessment, by levels of the curriculum.
    The 2018 study found that most Year 4 students (81 percent) achieved at or above                                                                      60                    Below-
    curriculum level 2, the expectation for the end of Year 4. In 2018, 45 percent of Year 8                                                                                    Level 2
    students achieved level 4 or above, the curriculum expectation for the end of Year 8.                                                                 40
    The study also found that there was no significant change in achievement for Year
                                                                                                                                                          20
    4 students between 2013 and 2018. For Year 8 students, however, there was a small
    statistically significant increase in average achievement.
                                                                                                                                                           0
                                                                                                                                                                Distribution of Year 4 and Year 8 students’ scores on
                                                                                                                                                                the 2018 Mathematics and Statistics (MS) scale

                                                                                                                                                            The blurred lines in the graph show the boundaries
                                                                                                                                                            between curriculum levels. The lines are blurred
                                                                                                                                                            to indicate the uncertainty involved in defining
                                                                                                                                                            precise boundaries.

    1
        For detailed information about the scale description, go to the report, https://nmssa.otago.ac.nz/reports/2018/2018_NMSSA_MATHEMATICS.pdf
    2
        In the remainder of this report, the term ‘mathematics and statistics’ has usually been shortened to ‘mathematics’ to support readability.
6       This in no way lessens the importance of statistics as part of the mathematics and statistics learning area.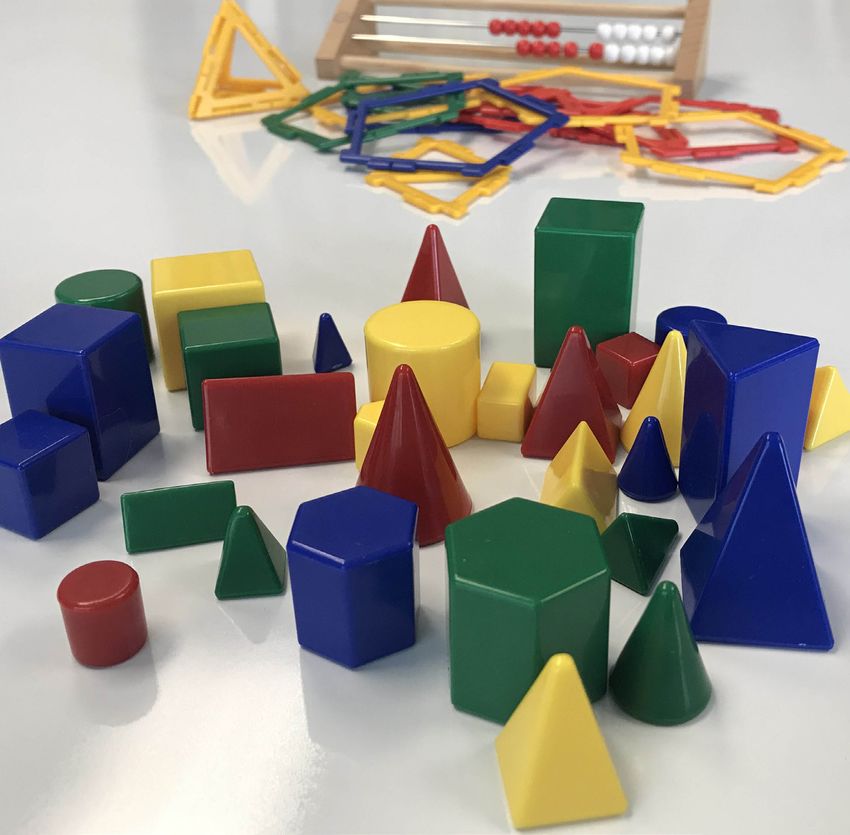
2018 NMSSA • Mathematics and Statistics scale descriptors

                              NUMBER AND ALGEBRA                            MEASUREMENT AND GEOMETRY                              STATISTICS

              180 •

                      Describe and apply efficient strategies to solve
                      word problems.
              170 •
                    Solve division problems with 2-digit divisors •
                    Find an unknown in an equation involving order
                    of operations • Solve a subtraction involving
                    mixed length decimals • Find a percentage of
              160 • a 3-digit number • Use proportional thinking to
                    solve percentage problems • Find fractions of a
                    fraction • Add and subtract fractions • Simplify
                    an improper fraction • Write an algebraic
                    expression to represent the nth term in a             Interpret a quadrilateral classification system
                    pattern.                                              • Explain how to convert between grams and
              150 •                                                       kilograms.

                    Plan, describe, and apply a strategy to solve
                    word problems • Solve division problems with
                    single•digit divisors • Find the square root of       Show a flexible understanding of perimeter, area
                    a whole number • Understand the order of              and volume • Identify direction and distance on a
              140 • operations • Add and multiply numbers involving       chart • Understand the effect of using a scale factor
                    one decimal place • Convert 3-digit decimals to       to enlarge a shape • Recognise invariant properties
                    percentages • Use proportional thinking to solve      under transformation • Rotate objects using turns
                    percentage problems • Find fractions of amounts       expressed in degrees.
                    • Order non-unit fractions • Recognise equivalent
                    fractions such as 12/16 • Add and subtract simple     Calculate the difference between two times several
              130 • fractions • Continue non•linear number patterns •     hours apart • Use measurements presented on a
                    Complete spatial number patterns.                     plan to find an unknown dimension • Use millilitres
                                                                          to estimate the capacity of a container • Read a
                    Recognise the number of 100s in a 4-digit

Scale score
                                                                          scale marked in 0.1 cm parts to measure length •
                    number • Order decimals up to 3 decimal places        Recognise properties of 2-D and 3-D shapes • Find
                    • Convert between simple fractions, decimals          the distance between two locations on a scale map
              120 • and percentages • Find a simple percentage of a       • Enlarge a shape by a scale factor.
                    number • Understand equality and inequality •
                    Continue number and spatial patterns.                 Use side by side scales to convert between inches
                                                                          and centimetres • Read scales to tenths • Work
                    Understand the effect of multiplying or dividing
                                                                          out the number of cubes in a shape where some
                    by 1 • Estimate simple multiplication problems •
                                                                          cubes are not visible • Identify which net can be
              110 • Use simple ratios to solve problems • Explain why
                                                                                                                                               PART 1: The National Monitoring Study of Student Achievement mathematics and statistics assessment

                                                                          used to make a given box • Use grid references and
                    a fraction is greater than another • Find a simple
                                                                          compass directions to show location • Recognise
                    fraction of an amount or set • Recognise different
                                                                          examples of different transformations.
                    representations of mixed fractions • Match a simple
                    number sentence with a word story • Continue
                    repeating spatial patterns with two variables.
              100 •                                                       Select appropriate units to measure a heavy object
                    Add and subtract 2-digit numbers • Solve simple       • Convert digital to analogue time • Read a half-way
                    multiplication and division problems • Estimate       mark on a scale marked in 20s • Have a sense of
                    the sum of two 3-digit numbers • Recognise which      the size of one metre • Draw a shape reflected in a
                    negative number is the lowest • Recognise the         mirror line • Identify movements on a grid • Identify
                                                                          cardinal compass directions.
               90 • number of tens in a 3-digit number • Recognise
                    simple fractions, decimals, and percentages •
                    Continue simple number and spatial patterns.          Recognise that a given container holds about
                                                                          one litre • Identify common shapes • Count the
                                                                          number of cubes in a shape where part of each
                                                                          cube is visible • Recognise a side view from a 3-D
               80 •                                                       representation.

                    Add groups of 10 • Understand the effect
                    of adding 0 • Write numerals as words •
                    Demonstrate a sense of place value up to 3
               70 • digits • Represent a simple fraction as an area •
                    Continue a repeating pattern with one variable.

                              NUMBER AND ALGEBRA                            MEASUREMENT AND GEOMETRY                              STATISTICS
         7
PART 2
           Insights about mathematics learning

                                                                                                Spatial reasoning
                                                                                                Insight 1: Using the language of spatial reasoning helps students to communicate
    This section presents a series of insights about mathematics learning, based on students’
                                                                                                           their thinking
    responses to tasks included in the in-depth component of the NMSSA assessment.
    The insights relate to three focus areas.                                                   Insight 2: Spatial reasoning involves visualisation and mental manipulation

8
Fractions and percentages                                                  Collaborative problem solving
Insight 1: Students need to work with different models of fractions        Insight 1: Most students can collaborate on a task that is engaging
Insight 2: Understanding percentages begins early                                     and clearly structured

Insight 3: Successful problem solving with percentages requires students   Insight 2: Working systematically and making links between problems enhances
           to identify and represent multiplicative relationships                     task success
                                                                           Insight 3: Thinking algebraically involves using a range of problem-solving strategies

                                                                                                                                                                    9
PART 2: Insights about mathematics learning: Spatial reasoning
SPATIAL REASONING
Introduction
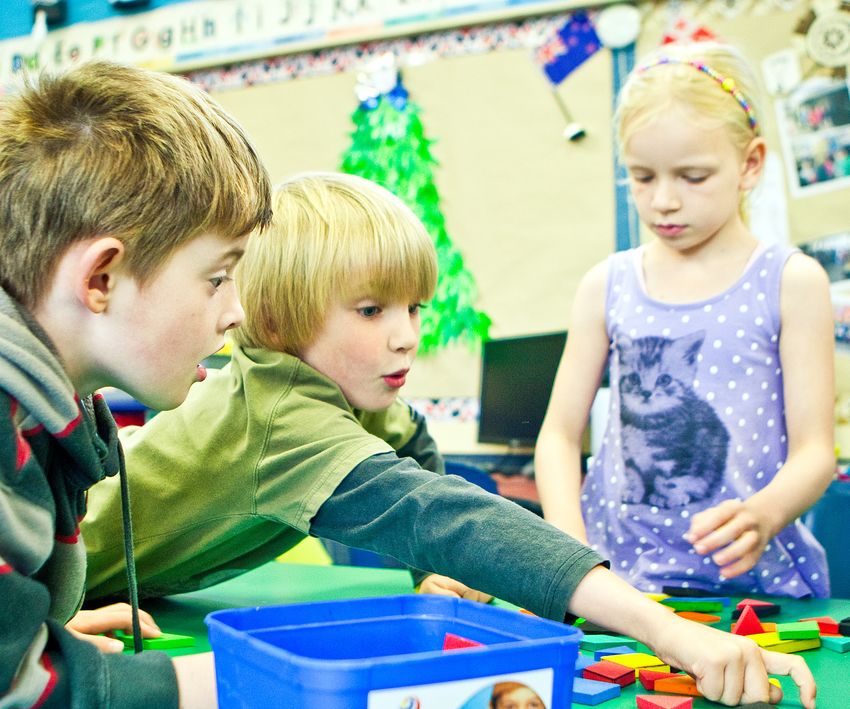
Spatial reasoning involves being able to visualise a 2- or 3-dimensional object and
then mentally manipulate it. If you’ve ever tried to parallel park your car, played a
game of Tetris or used a paper map to navigate, you’ve had to use spatial reasoning
skills.
Spatial reasoning includes both mental rotation and spatial orientation.Mental
rotation is when we think about objects in our mind and move them around, such
as when we imagine how a room might look if we shifted the furniture. Spatial
orientation is when we think about the position of an object in relation to our own
position, such as when we follow maps or complete mazes.
Why is spatial reasoning important?
Over the last few decades, there has been an increasing number of studies
demonstrating that early ability in spatial reasoning is a powerful predictor of
students who enjoy, enter and succeed in Science, Technology, Engineering, and
Mathematics (STEM) disciplines. People working in STEM areas often use diagrams,
maps and models to represent ideas when working through tasks or problems.
10PART 2: Insights about mathematics learning: Spatial reasoning
Where does spatial reasoning fit in the
curriculum?
Spatial reasoning is most visible in the Geometry and Measurement
strand of the Mathematics and Statistics learning area under the
sub-strands ‘Position and Orientation’ and ‘Shape’. Geometry is described
in the curriculum:
Geometry involves recognising and using the properties and
symmetries of shapes and describing position and movement.
(Ministry of Education, 2007, p.26)
The NZMaths website3 explains that we teach geometry because ‘we live in
an obviously three-dimensional world that we walk through, explore and
use every minute of every day’. We need to understand this world ‘in order
to carry out even the simplest of tasks’.
3
https://nzmaths.co.nz/geometry-information
11PART 2: Insights about mathematics learning: Spatial reasoning
Insight 1:
Using the language of spatial reasoning helps students to communicate their thinking
Task: Moving Models
Moving Models was an in-depth task given to both Year 4 and Year 8 students to assess
their ability to mentally manipulate objects.
How did the students respond?
Student responses were categorised according to how many sets of instructions they
In Part 1 of this task, a 3-dimensional model was placed in front of the student.
needed to give the TA to succeed with the task.
An identical model, in a different orientation, was placed in front of the teacher assessor
(TA). Results on the next page show how the students were scored on Parts 1 and 2 of
the Moving Models task, by year level. Students who scored a ‘2’, the highest scoring
The student was asked to tell the TA how to move the student’s model, so it looked like
category, were more likely to use specific spatial language that enabled them to give
the TA’s model. The students were not permitted to touch the models; however, they
clear instructions.
could point or make gestures as they gave their instructions. After repeating their
instructions back to them, the TA then followed the student’s instructions, checking
at the end to see if the models looked the same. If the models did not look the same,
students were permitted to give additional instructions. Part 2 of this task involved a
larger and more complex model.
PART 1 PART 2
Student ’s model TA ’s model Student’s model TA’s model
12PART 2: Insights about mathematics learning: Spatial reasoning
% response
Results for Moving Models, by year group: Y4 Y8
PART 1
Scoring category Descriptor
2 Gives one set of instructions that allows the TA to
successfully move student’s model to look like TA’s model 64 73
1 Gives a set of instructions that does not initially
allow the TA to successfully move student’s model to
look like TA’s model; after TA prompt, then gives additional
instructions which do allow the TA to successfully
move student’s model to look like TA’s model 30 23
0 Unable to complete 6 4
PART 2
2 Gives one set of instructions that allows the TA to
successfully move student’s model to look like TA’s model 59 81
1 Gives a set of instructions that does not initially
allow the TA to successfully move student’s model to
look like TA’s model; after TA prompt, then gives additional
instructions which do allow the TA to successfully
move student’s model to look like TA’s model 30 17
0 Unable to complete 11 2
13PART 2: Insights about mathematics learning: Spatial reasoning
Students who scored 2
In the four examples below, students have given one set of instructions that allowed the TA
to successfully move the student’s model to look like the TA’s model.
Spatial language
Flip it up vertically and then Rotate it so it’s standing up Students who scored a 2 often used specific
give it a rotation of 90 degrees and then rotate like a quarter turn spatial language words such as clockwise,
anticlockwise. anticlockwise. anticlockwise, vertical, horizontal, degrees,
rotate, quarter turn.
Student’s model TA’s model
Can you flip it up so it’s Spatial language
Put it on its triangle bottom. standing on the three blocks and Some Year 4 students used less specific
Turn it to the pointy end the one block on the side then turn spatial language words such as flip and
– this pointy end facing me it so it’s facing me – the one block pointy.
is facing me.
14PART 2: Insights about mathematics learning: Spatial reasoning
Students who scored 1
In this example the student gives a set of instructions that does not initially lead
to making the student’s model look like the TA’s model.
Literacy in mathematics -
The student uses a lot of gestures to indicate how the TA should move the model.
the language of spatial reasoning
The TA has to seek clarification as the student does not use specific spatial language. Spatial language is the explicit language used to describe position,
shape, direction and transformation. There are five categories of
Student spatial language:
Give me instructions to tell me how to move your • Shape terms - standard names for objects: circle, square,
model so it looks like my model. cone, pyramid, octagon, sphere, cylinder, cuboid,
Face it up. tetrahedron, equilateral, scalene triangle
TA
What do you mean face it up? • Dimensional adjectives - words describing the size of
Make that bit [points to the cube that
objects and spaces: big, little, long, short, tall, tiny, huge
is currently touching the table] point up.
• Spatial features - words describing the features of objects
So make that bit point up? and spaces: edge, corner, line, curved, straight, flat,
OK. Anything else? angle, acute, congruent, parallel, equivalent, perimeter,
No. circumference,
• Spatial location and directions - words describing the
So you want me to face that bit up. relative position of objects, people and points in space:
[TA follows the student’s instructions and moves the model.] between, in, on, under, above, below, forward, behind, near,
Does your model look like mine? far, middle, top
No. • Transformational language - words describing the
movements of objects and people: turn, slide, flip, translate,
Tell me what else I need to do to make rotate, clockwise, anticlockwise, degrees.
your model look like mine.
Turn it around. Exposing children to spatial language from a young age is very
Turn it around. OK. How will I turn it around? important as it has a strong influence on the development of spatial
cognition and mathematical skills.
[Student uses hands to indicate the model Teachers can help students to develop their spatial language by
should be turned 90 degrees towards her.] using mathematical vocabulary when describing objects, locations
or transformations.
The TA turns the model and the two models are now in the same orientation.
15PART 2: Insights about mathematics learning: Spatial reasoning
Insight 2:
Spatial reasoning involves visualisation and mental manipulation
TASK: Building in the Mind’s Eye How did students respond? % correct
responses
Building in the Mind’s Eye was another in-depth task given to both Year 4 and Year 8 Overall, Year 8 students performed better than Year 4 students on these Y4 Y8
students to assess their ability to mentally manipulate objects. tasks, with both groups finding the second and third tasks considerably
more challenging than the first task.
In this three-part task, students listened to step-by-step descriptions of how to
construct 3-dimensional models using plastic cubes. After hearing each description, Results for Building in the Mind’s Eye, by year level
they were then shown four photographs and asked to select which one looked like
Part 1 65 79
the picture they had built in their mind’s eye. Students were generally successful when
the model they were asked to construct was straightforward and involved only one Part 2 27 43
transformation. More complex instructions involving several construction steps or Part 3 35 47
transformations resulted in more challenge for students.
PART 1
Imagine you have four cubes.
Three are black and one is white.
The 3-dimensional shape
Take the three black cubes. Snap them
described here is made of
together in a row and lie them down flat
in front of you.
only four cubes.
Picture what this looks like in your mind. One simple transformation
Now put one white cube on top of the middle is performed on the
black cube. shape once it has been
Picture what this looks like in your mind. constructed.
Now flip the shape upside down.
Put a picture of this in your mind.
Correct response
16PART 2: Insights about mathematics learning: Spatial reasoning
PART 2
Imagine you have six cubes.
Four are white and two are black.
Take the four white cubes. Snap them together
in a row and lie them down flat in front of you.
Picture this in your mind.
The 3-dimensional shape
Now snap one black cube on top of the described here is made of
far left white cube of the row.
six cubes.
Picture what this looks like in your mind.
Two transformations are
Now put the other black cube next to the
first black cube, on top of the next white cube performed on the shape
in the row. – one half turn and one
Picture what this looks like in your mind.
quarter turn.
Now turn the shape to the left a half turn
or 180 degrees.
Picture this in your mind.
Now flip the shape up a quarter turn Correct response
to the right.
Put a picture of this in your mind.
17PART 2: Insights about mathematics learning: Spatial reasoning
PART 3
Imagine you have eight cubes. Four are black,
two are white and two are blue.
Snap a blue cube and a black cube together. Put
them down in front of you with the black cube
on the right.
Picture this in your mind.
This time you are going to build a tower shape.
Now snap the other blue cube to another black
cube, this time with the blue cube
on the right. The 3-dimensional shape
Put this second pair of cubes on top of the first described here is made of
pair with the black cubes on top of each other eight cubes.
and the top blue cube facing to the right.
The cubes are placed
Picture this in your mind.
in a range of different
Now put one white cube on top of the orientations – left, right,
black cubes.
behind, on top of.
Picture this in your mind.
No transformations are
Snap the remaining white cube on to the back
performed on this shape.
of the first white cube so it is facing away Correct response
from you.
Now put a picture of this in your mind.
Take one of the remaining black cubes
and put it on top of the white cube that
is closest to you.
Put a picture of this in your mind.
Lastly, take the final black cube and snap
it on to the front of the black cube you
just placed so that it is facing towards you.
Now picture this in your mind.
18PART 2: Insights about mathematics learning: Spatial reasoning
What can teachers do?
How can I include spatial reasoning in my classroom programme?
For some years there was an assumption that spatial reasoning skills were innate –
Introduce challenges that develop students’ visualisation skills
you could either parallel park or you couldn’t. Recent research, however, tells us that
spatial skills are malleable and can be taught. • The following quick challenges can help students develop spatial visualisation
Here are some things to consider: skills:
Start early »» Can you draw this? Students are given a piece of paper with the outline of
a square on it. They are then shown a geometric design drawn within the
• Helping students develop their spatial understanding can start from a very
boundaries of a similar square (see examples below). After 10 seconds of
young age. Te Whāriki (Ministry of Education, 2017) suggests that to develop
viewing time, the students attempt to re-create the exact design in their own
spatial understanding in the early years, students should have opportunities
square.
to fit things together, take things apart, rearrange and reshape objects
and materials, look at things from different viewpoints and use magnifying
glasses. It suggests young children should also have the chance to construct
3-dimensional structures such as making models from pictures. When students
start primary school, they will bring with them a range of experiences which
teachers can build on by extending their geometric concepts and vocabulary.
• Reading books and watching videos that use spatial language such as positional
words, are other ways for teachers to explore and extend these concepts and
vocabulary (also see p.15, Literacy in mathematics – the language of spatial »» Can you build this? The same process is used as for Can you Draw this? except
reasoning). students are shown a geometric structure made from multi-link blocks for
10 seconds and then asked to re-create it using their own set of multi-link
Encourage spatial play
blocks.
• Building with blocks, doing jigsaw puzzles, tangrams or using pentominoes
give students opportunities to develop spatial skills. Researchers found that »» Shape transformer: Similar to a ‘Function machine’ activity where two columns
children who had spent a lot of time playing with blocks, puzzles and board of numbers are shown – input and output - and a rule is developed to explain
games scored higher on tests of spatial ability. the function used to change the input into the output, for example, add 3 or
multiply by 2. In this version a shape is drawn into the Input column and a
• Many board games are available now that require students to use spatial transformed shape is drawn in the output column. Students have to work out
thinking. For example, Blokus, Patchwork, Cottage Garden, Indian Summer, what transformation has occurred, e.g. rotation 45o or translation, and predict
Nmbr9, Tetris and Jenga. Many board games have the added advantage of what will happen to future shapes.
needing addition and multiplication skills to calculate scores. There are also
many social skills, such as turn taking, that can be practised while playing board »» Barrier games: Students sit on either side of a barrier (cardboard folder, book
games. or similar). One student builds a shape or figure using blocks or multi-link
cubes then describes it to their partner who then builds the same figure.
Students compare structures and swap roles.
19PART 2: Insights about mathematics learning: Spatial reasoning
»» Building in the Mind’s Eye, as described in this Insight. Students are given oral • Several activities that can also help with spatial visualisation are mental folding,
instructions to build a 2-dimensional or 3-dimensional figure in their mind. They paper folding and working with nets. Mental folding involves students being
are then shown a series of pictures and asked to identify the one that matches shown a picture of a shape and asked to imagine folding it along a dotted line.
what is in their mind. The instructions can be made more complex by adding They select which of four images represents what the shape would look like after
more cubes; adding more instructions; adding more positional language (on being folded. Similarly, paper folding requires students to imagine the result
top of, behind, left, right) or adding more transformational language (rotate, of folding and cutting a piece of paper then unfolding it. Activities that require
flip, slide, turn). Students could work in pairs or groups and develop their own students to work out which nets fold to make shapes are further examples of
versions of this task. tasks that involve visualisation.
MENTAL FOLDING PAPER FOLDING MATCHING NETS II
(from Hodgkiss, Gilligan, Tolmie, (from Ontario Ministry of Education, 2014) (an ARB activity: https://arbs.nzcer.org.nz/resources/matching-nets-ii)
Thomas & Farran, 2018)
20PART 2: Insights about mathematics learning: Spatial reasoning
Help students develop perspective-taking Use maps
• Activities that encourage perspective-taking can help students to develop • Using physical maps is another good way to develop spatial reasoning skills in
spatial rotation skills. Set up blocks and shapes in a ‘scene’. Add a ‘photographer’ students. When using maps, there are opportunities to develop spatial language
– a figurine holding a camera, ‘looking’ at the scene. Ask students to select (left, right, between, etc.) and perspective-taking. Drawing maps, giving directions
which of four photographs show what the ‘photographer’ would have seen. using a map and locating ‘hidden treasure’ are activities that can help develop
Alternatively set up a scene with two different ‘photographer’ figurines these skills. [Refer to Social Studies Insights, p.73 for information on how students
looking at the same shapes from different viewpoints. Show a photograph of performed on a map-based perspective-taking task.]
one perspective and ask students which ‘photographer’ took the photo.
(from Hodgkiss et al., 2018)
• The Moving Models task, as described in this Insight, can easily be duplicated in
the classroom and can help develop perspective-taking. Students could work
in pairs or groups and develop their own versions of this task.
21PART 2: Insights about mathematics learning: Fractions and percentages
FRACTIONS AND PERCENTAGES
Introduction
Year 4 to Year 8 is a critical time for students to develop a strong grasp of fractions,
decimals and percentages so they can apply them across the curriculum (not just in
mathematics and statistics), move on to new mathematics learning, and make use of
them in life. Research suggests that developing a strong conceptual grasp of these
ideas is challenging and that it takes time. The focus of the tasks we describe in this
section is fractions and percentages.
Fraction task examples:
1. Colour in of this shape. 4. Mark where 1 would be on this number line.
0 2
2. Colour in a of these circles.
5. Colour in of these circles.
3. Draw a picture to show 1 6. What is as a decimal? 0.8
22PART 2: Insights about mathematics learning: Fractions and percentages
Insight 1:
Students need to work with different models of fractions
Fractions come in different guises and can carry a range of meanings. Students need 2018 (13) 2018 (13)
multiple opportunities to work with different models of fractions. % correct responses
Year 4 Year 8
TASK: Fractions Results for Fractions task, 2018 (and 2013) by year level
One NMSSA task called Fractions asked students at both year levels to complete
Fractions questions
six questions focused on using different representations of fractions, shown on the
previous page. (The exact items are not shown here because we intend to use them Colour in a fraction of an area 76 (69) 97 (95)
in future assessments. Instead, we show similar items.)
Colour in a unit fraction of a set 36 (29) 80 (78)
How did the students do? Draw a diagram to show a mixed fraction 15 (13) 71 (67)
The percentages of Year 4 and Year 8 students who responded correctly to each
question are shown in the table. Versions of the same questions were also asked in Show a mixed fraction on a number line 14 (13) 68 (68)
2013, allowing a comparison with students’ responses in 2018.
Colour in a non-unit fraction of a set 23 (21) 70 (67)
Write a non-unit fraction as a decimal 2 (1) 46 (41)
The improvement between Year 4 and 8 indicates the amount
of learning that goes on between the year levels. However, the
evidence suggests that, overall, students have a stronger grasp
of some ways of using fractions than others.
23PART 2: Insights about mathematics learning: Fractions and percentages
Insight 2:
Understanding percentages begins early
Clothes on Sale Card 1
Task: Clothes on sale – Year 4
The Clothes on Sale task asked Year 4 students to show their understanding of two PART 1: 50% off the price of this T-shirt.
commonly occurring percentages: 50% and 25%.
The task was based around a shopping scenario and was presented by a teacher
assessor (TA) as part of a one-to-one interview. The first part of this task focused on a
$20
discount of 50 percent and the second, a discount of 25 percent. For both parts of the
task, students were asked what they thought the percentage meant, what the answer
might be, and how they worked out the answer.
Voucher 1 Voucher 2
Clothes on Sale Card 2
VOUCHER
ONE USE ONLY
TAKE 50% OFF THE TA
REGULAR PRICE R
$16
24
Voucher 1 Voucher 2PART 2: Insights about mathematics learning: Fractions and percentages
$20
Clothes on Sale Card 2
How did the Year 4 students do?
Slightly over half of the Year 4 students were able to correctly discount the T-shirt PART 2: 25% off the price of a hoodie.
by 50 percent. Almost all of these students were able to explain how they found the
answer.
Twenty-two percent were able to correctly discount the hoodie by 25 percent. In
$16
response to the question, “What does 25% mean?”, 31 percent of the Year 4 students
explained that it meant one quarter.
Although achievement objectives in the NZC don’t explicitly mention percentages
before level 3, most students in Year 4 will be exposed to percentages in their daily
lives. They will also come across them in a range of curriculum contexts.
The success of many Year 4 students on this task suggests that there are opportunities
Voucher
for teachers to draw on these 1real-life understandings when teaching ideas about Voucher 2
fractions and percentages. It is also important to remember that students will not
automatically understand percentage because of their real-life experiences alone.
VOUCHER VOUCHER
ONE USE ONLY ONE USE ONLY
TAKE 50% OFF THE TAKE 25% OFF THE
REGULAR PRICE REGULAR PRICE
25
Voucher 1 Voucher 2PART 2: Insights about mathematics learning: Fractions and percentages
Insight 3:
Successful problem solving with percentages requires students to identify
and represent multiplicative relationships
TASK: Percentage Problems
Year 8 students were also administered a series of problems involving percentage
questions as part of a one-to-one interview with a TA. The questions demanded strong
conceptual understanding and went well beyond more routine questions that involve
a percentage increase or decrease. Two examples of the problems are below.
Card 2 Percentages Card 1 Percentages Card 2 Percentages Card 1
A shop has a ‘Buy one get the second one A shop has a ‘Buy one get the sec
in a 25% off sale. at half price’ sale. This T-shirt is in a 25% off sale. at half price’ sale.
e is $30. If you choose 2 items that are the same price, The sale price is $30. If you choose 2 items that are the
st before it was put in the sale? what percentage of the total cost will you save What did it cost before it was put in the sale? what percentage of the total cost w
altogether? altogether?
26PART 2: Insights about mathematics learning: Fractions and percentages
How did the Year 8 students do?
The proportion of students who were able to solve each problem is shown below. Drawing a picture or a diagram is a useful problem-solving approach with fractions
Students who answered correctly, generally demonstrated a strong understanding of and percentages. Here is a student’s drawing and an explanation of how they solved
what the questions were asking and could explain the problem diagrammatically or the “Buy one, get the second one at half price” problem.
as a series of multiplicative operations. There was evidence that some students had
an appreciation of the percentages involved but struggled to comprehend what the
question was asking and/or how to represent the proportional relationships involved.
Answering percentage problems such as these, requires students to have a strong
understanding of how the quantities in the questions relate to each other. The key
relationships have a multiplicative dimension and defining these is usually the key
to unlocking the problem. Developing the ability to think through these kinds of
problems goes well beyond applying a memorised procedure. Students need plenty
of opportunities to work on these kinds of problems, represent them in different ways,
and communicate how they might be solved. If you buy one you get another
one but it’s only half the price.
That means you pay for 1.5
% correct instead of paying for 2.
responses
Results for Percentage Problems, Year 8 The 0.5 you save is like a quarter
Y8 of 2 – there are 4 halves in 2.
Problem That means you save 25%.
number Problem text
1 Calculate the percentage saved when buying two identical
items at a ‘Buy one, get the second one at half price’ sale 43
2 Calculate what a T-shirt with a sale price
of $30 cost before it was put in a 25-percent-off sale 23
27PART 2: Insights about mathematics learning: Fractions and percentages
What can teachers do?
Fractions Percentages
• Provide students with multiple opportunities to work with different • Introduce simple percentages early, e.g., 50% and 25% can be included in
representations of fractions, including a fraction as part of a set and an area, meaningful contexts when fractions are also used.
and as a number on a number line. Help them to make strong connections
between these different representations. ‘Think boards’ are a resource that can • Use pictures, models and materials to help students build understanding
help build connections among different models. Think boards typically have of what percentages mean and how they can be shown.
four quadrants to show four models of the same problem or mathematical
idea, like this one: • Encourage students to visualise what a percentage means. Encourage them
to use drawings or diagrams to represent the relationships in a percentage
Story question. Make explicit connections between their understanding of fractions
and decimals to consolidate meaning.
Number Sentences
Concrete Materials
Picture
A think board could equally be used to make connections between four ways
of showing ¾ as: part of a rectangle, part of an array of 12 stars, a location on
a number line (marked at one end with ‘0’ and at the other end with ‘1’), and in
a story that involves ¾. In this case ¾ would be written in the rectangle at the
centre of the board.
• Provide learning experiences that involve unit fractions, non-unit fractions,
and mixed fractions, shown in the ways listed above.
• Emphasise fractions as parts of wholes, and that the size of ½ can vary
according to the whole (½ of a small cake compared with ½ of a large cake).
28PART 2: Insights about mathemat
COLLABORATIVE PROBLEM SOLVING
Introduction
What is collaborative problem solving? How does collaborative problem-solving link to the NZC?
Collaborative problem solving involves working with other people to solve problems. In the NZC, the disciplines of mathematics and statistics are introduced as: “related but
It has two aspects: a cognitive aspect and a social aspect. different ways of thinking and of solving problems” (p. 26). In the mathematics and
statistics learning area, achievement objectives at all levels are prefaced with:
1. The cognitive aspect involves:
In a range of meaningful contexts, students will be engaged in thinking
• task regulation–problem analysis; goal setting; collecting information
mathematically and statistically. They will solve problems and model
and adapting a strategy as more information becomes available; working
situations that require them to: …
systematically and monitoring progress
Working with others to collaboratively solve problems is a very natural fit for
• knowledge building–recognising patterns and relationships within the data, mathematics. Collaborative problem solving, however, extends across the
including cause and effect; hypothesising and testing hypotheses. curriculum and can be directly related to the Key Competencies of Thinking, and
2. The social aspect involves: Relating to Others. Thinking includes problem solving by ‘using creative, critical,
and metacognitive processes to make sense of information, experiences, and ideas’
• participating–being active; responding to and coordinating with others;
(Ministry of Education, 2007, p.12). Relating to Others ‘includes the ability to listen
persevering to complete a task; sharing a sense of responsibility
actively, recognise different points of view, negotiate, and share ideas. … By working
• perspective taking–integrating others’ contributions into one’s own thoughts effectively together, [students] can come up with new approaches, ideas, and ways of
and actions; showing responsiveness to the needs of a partner and the task thinking’ (ibid).
• social regulation–being aware of one’s own strengths and weaknesses, and
those of one’s collaborators; being able to negotiate and reconcile different
perspectives.
29PART 2: Insights about mathematics learning: Collaborative problem solving
TASK: Moving and Jumping
Students’ collaborative problem-solving skills were the focus of a task called Moving To promote a collaborative approach, students were told that only one person could
and Jumping. The task was presented to a pair of students by a teacher assessor (TA). move the red counters and only one person could move the blue counters. The TA
Each pair was randomly selected from the group of students involved in the NMSSA instructed the students: ‘You cannot move each other’s counters. Show me how you
programme at each school (one pair per school). Whether or not the students knew can work together, and talk to each other, to solve this problem.’
each other or had experience working together was not taken into consideration
When students successfully solved a problem, they recorded the number of moves
when selecting the students. The students’ work on the task was videoed for later
required in a table that was provided.
analysis.
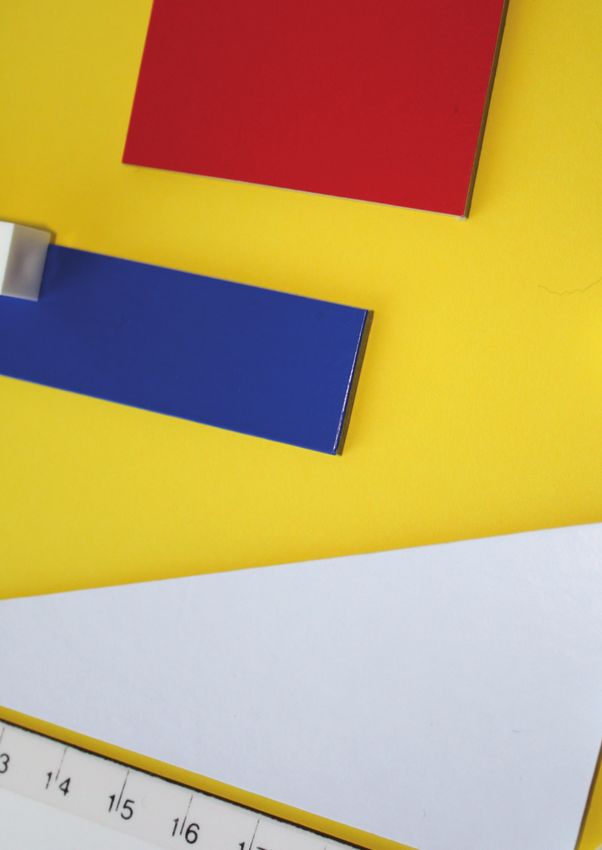
The task involved a series of five problems focused on a simple, counter-based activity.
The activity involved swapping the positions of two groups of counters positioned at
either end of a simple grid. Students were given the following instructions:
There are two ways to move a counter, by moving ahead one
square or by jumping a counter of the other colour.
A counter cannot move backwards along the line.
You cannot have two counters in the same square.
B B R R
If you and your partner get stuck, just start again.
The board set up for problem 1: the 2-counter problem
In the first problem (see figure right) students needed to work out how many moves
would be required to swap the position of the two blue and two red counters. Problems
2 and 3 involved sets of three and four counters, respectively. In each version of the
problem, the number of spaces on the board was always one more than the number
of counters. For the 2-, 3- and 4-counter problems students were provided with the
boards and counters so that they could work on the problem together.
30PART 2: Insights about mathematics learning: Collaborative problem solving
The pairs who successfully solved the 2-, 3- and 4-counter problems were invited to Prompts that could be used while students worked on a problem:
work out how many moves would be required if the problem was extended to 10
and then 1000 counters. The students were not provided with additional counters or • Maybe start by telling your partner what you need to do.
boards for these extended problems. Instead a pen and recording sheet were made If there’s very little talking at the start, or if the students seem unsure how to begin.
available. There were no rules about how materials should be used or shared. • Remember to talk with your partner about what you’re thinking.
Students were allowed a maximum of 15 minutes to work on the task. While students Anytime, to help elicit their thinking.
were working, the TA could use the following prompts to support the students. The
• Why are you stuck there?
TAs were expected to use their professional judgement to decide when these were
needed. When students stop because they have two same-colour counters in a row,
blocking other moves.
• Is there a different move you could make at this point?
Especially if students repeatedly get stuck at the same point and might be
becoming frustrated.
• Just stop for a moment and think about what will happen if you move there.
What are the other moves you could make?
Especially if students are getting to the same move and getting blocked by having
two counters of the same colour together.
TAs could also say to the students: ‘You can move more than one of your counters
in the same turn.’ Many students expected to take turnabout, probably because
moving one counter at a time is often the convention when counters are used
in board games. However, as this picture illustrates, students quickly reached an
impasse by turn-taking.
31PART 2: Insights about mathematics learning: Collaborative problem solving
Solutions Assessing the task
The figure below shows the number of moves needed for each version We developed scoring guides (rubrics) to assess each pair’s problem-solving and
of the problem as recorded by a pair of Year 8 students. collaboration skills. While a problem-solving rubric was developed for each of the
problems, a single scoring guide was developed for collaboration. For both problem
solving and collaboration, students were assessed as a pair rather than individually.
The rubric for collaboration was applied at two different stages of the task. The first
stage incorporated the work students did up to and including the 4-counter problem.
The second stage involved the work done on the 10-counter and 1000-counter
problems. Trained markers were used to score the task .
The scoring guide for collaboration (see following page) focused on the social
interactions between the students as they looked to solve the problems. Evidence
of collaboration included the way the students communicated with each other
(including the use of body language such as gestures, facial expressions and
exclamations), shared resources and information, and took on various roles.
A completed table for the Moving and Jumping task
32PART 2: Insights about mathematics learning: Collaborative problem solving
Scoring guide for collaboration
Score
Collaboration criteria
category
2 • Students interact with each other throughout the task to work out
what they need to do to solve the problem together.
• Students share the work.
• Students consistently show in their actions that they are listening
to their partner’s ideas.
1 • Students interact with each other occasionally during the task to
work out what they need to do to solve the problem together.
• One student leads and the other student is also engaged in the
task.
• Students sometimes show in their actions that they are listening
to their partner’s ideas.
0 • There is no / almost no interaction about what students need to
do to solve the problem together.
• One student leads / dominates and the other is largely passive.
• Students never / almost never show in their actions that they are
listening to their partner’s ideas.
33PART 2: Insights about mathematics learning: Collaborative problem solving
Insight 1:
Most students can collaborate on a task that is engaging and clearly structured
Most students at both year levels showed that they could collaborate in a clearly Student A Student B
structured and engaging problem-solving context. In the first stage of the Moving
and Jumping task nearly all the pairs at each year level scored a ‘1’ or more on the
collaboration rubric. Forty-seven percent of the Year 4 pairs and 66 percent of the Year 8
pairs scored a ‘2’ (the top category). The pairs of students who scored in the top category Maybe you could move that
were able to sustain their collaboration. They shared resources and information and [points to a blue counter],
actively listened to each other. there.
Collaboration depends on motivation and a sense of challenge. The task provided a [She follows his suggestion]
sense of challenge. It was presented as a problem activity and invited curiosity and Move that one
experimentation. Students could have multiple attempts at the problem and finding [points to a red counter],
a solution was satisfying. The task was also structured so that no one student could there.
access all the resources. This meant each student in a pair had to be at least minimally
You could move that one
involved.
[points to a blue counter],
there.
Right
[moves the counter]
then you can move that one
[points to a counter],
there.
[He moves a counter.]
And then I’ll move this one .
The following interaction from a pair of Year 4 students is typical of the kind of
communication associated with a score of 2 for collaboration during the first stage of
the task. The pair of students has just succeeded in solving the 3-counter problem and
are trying to repeat their solution and count the number of moves that were required. [moves a counter.]
Each student is prepared to give and listen to suggestions.
34PART 2: Insights about mathematics learning: Collaborative problem solving
Insight 2:
Working systematically and making links between problems enhances task success
Most pairs of students were able to successfully solve the 2-counter version As this pair of Year 4 students sets up the 3-counter problem and begins moving the
of the problem using a trial and error approach (sometimes with support). counters, there are already clues that they are on the way to successfully completing
Students who were successful with the 2-counter problem were often able to the problem.
successfully complete the 3- and 4-counter problems. The results below show the
scoring guide we used for the 2-counter problem and how the students achieved.
Results for Moving and Jumping, by year level Y4 Y8 Student A Student B
88 87
pairs pairs
Students’ responses to the 2-counter problem, for pairs of students n n
Score Problem-solving criteria
I know how we can do it,
3 Correct answer (8). just do the same thing but
Students solve the problem and with more.
can repeat it with relative ease. 30 60
2 Correct answer reached, maybe with support.
Students solve the problem once It’s just the first one was hard.
and may repeat it with difficulty. 49 25 Now we know what to do.
1 Students begin the problem
but are unable to solve it. 7 2
0 No response / Don’t know /
Unable to begin solving the problem 2 0
35PART 2: Insights about mathematics learning: Collaborative problem solving
Students were more likely to progress through the series of problems when they
worked systematically and used what they had learned about the activity along the
way. For instance, the pairs who took notice of the patterns that emerged when they
applied trial and error on the 2-counter version were more successful at solving the 3-
and 4-counter versions. The figure shows the number of pairs who began each of the
five different problems by year level. Students who did not begin all the problems were
either not able to solve a problem and therefore could not move on or ran out of time.
In general, Year 8 students began more problems than those in Year 4. Eighty-eight
pairs of Year 4 students and 87 pairs of Year 8 students began the first task.
The number of pairs of students who began each problem in the Moving and Jumping task,
by year level
36PART 2: Insights about mathematics learning: Collaborative problem solving
Insight 3:
Thinking algebraically involves using a range of problem-solving strategies
Although many of the student pairs did not get beyond the 4-counter problem in the
15 minutes provided, 13 pairs of Year 4 students and 41 pairs of Year 8 students did go
on to complete the 10-counter problem. The table shows how the students scored on
the 10-counter problem.
Results for Moving and Jumping, by year level Y4 Y8
Students’ responses to the 10-counter problem, for pairs of students, by year level 13 41
pairs pairs
Score Problem-solving criteria % %
3 Correct answer (120)
• Students solve the problem, using algebraic thinking
• Students identify a relationship between the number of counters and number of moves needed to swap them,
and express a rule for the number of moves needed using algebraic notation, e.g., n(n + 2) where n is the number of counters each. - 12
2 Correct answer reached, maybe with support:
• Students solve the problem.
• Students take a systematic approach to solving the problem. From the first 3 problems, they identify a relationship between the number
of counters and number of moves needed to swap them and describe a rule for predicting the number of moves needed
• Students may use a sequential approach to solve the problem, e.g., identify the difference between 8 and 15 (+7),
and 15 and 24 (+9), and then add 11, 13, 15, etc. 15 16
1 • Students are unable to solve the problem or solve it with difficulty
• Students treat this as a stand-alone problem, i.e., they do not make links to the easier problems to identify a relationship
between the number of counters and number of moves needed
OR • Students make links to the easier problems but mis-hypothesise a relationship between the number of counters and moves needed 54 60
0 • No response / Don’t know / Guessed
• Students’ combined explanations are vague, disorganised, or incomplete
• Students do not pinpoint what made the problem hard
• Students begin the problem but are unable to solve it 31 12
37PART 2: Insights about mathematics learning: Collaborative problem solving
For the 10-counter problem and the 1000-counter problem that followed it, students The pairs of students who did solve the 10-counter task generally identified a
were no longer able to rely on using physical materials and applying a series of moves. sequential (or recursive) pattern that predicted the number of moves needed as
Instead, they had to be able to think algebraically in order to identify a pattern that the number of counters in the problem increased. They made the table the focus of
linked the numbers together. Students who succeeded on these problems often their inquiry. They often recorded additional information in the table to support their
demonstrated that they could think algebraically. These students could apply a range thinking.
of strategies to search for patterns that provided a more generalised solution. Students One pair of students worked out the number of moves that would be needed for
who relied on a concrete approach struggled. For instance, one student decided that a 1-counter problem (3 moves). They then focused on how the number of moves
drawing the 10-counter problem would be helpful. increased as more counters were added to the problem. They recorded the following,
noticing that the number of moves required was increasing by consecutive odd
numbers.
When this didn’t enable them to solve the problem, their partner suggested that they
could just use ‘pretend counters’ on the table. However, even with prompting from
the TA, the difficulties involved in working with larger numbers and the lack of
concrete materials to ‘anchor’ the moves proved too hard to overcome.
Algebra in Moving and Jumping
These problems give students an opportunity to show the extent to which they
can identify and express rules for patterns. In NZC, this particularly links to the
bolded text in the following achievement objectives in Patterns and relationships:
• Level 1: Create and continue sequential patterns
• Level 2: Find rules for the next member in a sequential pattern
• Level 3: Connect members of sequential patterns with their ordinal
position and use tables, graphs, and diagrams to find relationships
between successive elements of number and spatial patterns
• Level 4: Use graphs, tables and rules to describe linear relationships
found in number and spatial patterns.
To support students to focus on thinking algebraically, a simple table was
provided for each pair to record the number of moves each problem took.
38You can also read