Evaluating the effect of city lock-down on controlling COVID-19 propagation through deep learning and network science models
←
→
Page content transcription
If your browser does not render page correctly, please read the page content below
Evaluating the effect of city lock-down on controlling COVID-19
                                              propagation through deep learning and network science models
                                                           Xiaoqi Zhang1 , Zheng Ji1 , Yanqiao Zheng2 , Xinyue Ye3 , Dong Li4

                                           Abstract
                                           The special epistemic characteristics of the COVID-19, such as the long incubation period
                                           and the infection through asymptomatic cases, put severe challenge to the containment of its
arXiv:2009.02152v1 [q-bio.PE] 4 Sep 2020

                                           outbreak. By the end of March, 2020, China has successfully controlled the within- spreading
                                           of COVID-19 at a high cost of locking down most of its major cities, including the epicenter,
                                           Wuhan. Since the low accuracy of outbreak data before the mid of Feb. 2020 forms a major
                                           technical concern on those studies based on statistic inference from the early outbreak. We
                                           apply the supervised learning techniques to identify and train NP-Net-SIR model which
                                           turns out robust under poor data quality condition. By the trained model parameters, we
                                           analyze the connection between population flow and the cross-regional infection connection
                                           strength, based on which a set of counterfactual analysis is carried out to study the necessity
                                           of lock-down and substitutability between lock-down and the other containment measures.
                                           Our findings support the existence of non-lock-down-typed measures that can reach the same
                                           containment consequence as the lock-down, and provide useful guideline for the design of a
                                           more flexible containment strategy.
                                           Keywords: COVID-19; city lock-down; counterfactual analysis; deep learning; network
                                           science; China

                                           1. Introduction
                                               The novel coronavirus COVID-19 that was first reported in Wuhan, China at the end of
                                           2019 quickly spread. Early 2020 has witnessed many efforts to contain the virus, such as the
                                           city lock-down, quarantining the suspected infectious cases and their close-contacts, setting
                                           health check point at crucial traffic nodes. By the mid of March 2020, the cumulative
                                           infectious cases have stopped growth in most of the major cities of China, including the
                                           epicenter of Wuhan. Although a growing list of published papers and reports claimed that the

                                                Email addresses: xiaoqizh@buffalo.edu (Xiaoqi Zhang), jz0429@163.com (Zheng Ji), zhengyanqiao@hotmail.com
                                           (Yanqiao Zheng), xinyue.ye@gmail.com (Xinyue Ye), lidong@thupdi.com (Dong Li)
                                              1 National School of Development, Southeast University, Nanjing, China
                                              2 School of Finance, Zhejiang University of Finance and Economics, Hangzhou, China
                                              3 Urban Informatics-Spatial Computing Lab & College of Computing, New Jersey Institute of Technoloy, New Jersey, U.S.A
                                              4 Innovation Center for Technology, Beijing Tsinghua Tongheng Urban Planning & Design Institute, China

                                           Preprint submitted to Journal Name                                                                     September 7, 2020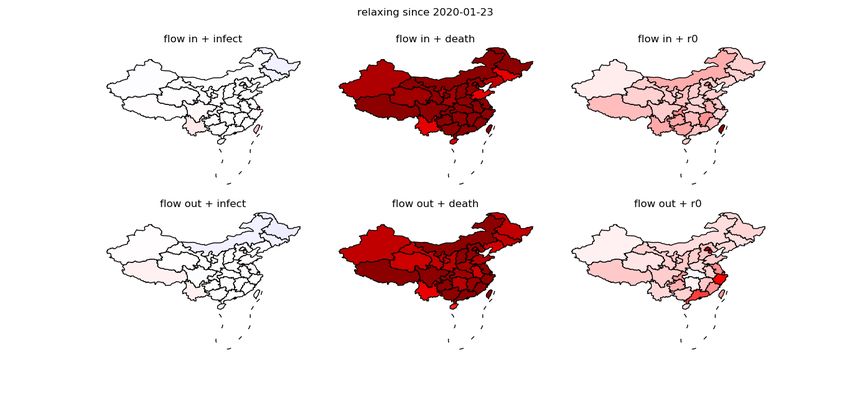
successful containment of COVID-19 in China was due to the national-wide travel ban and
lock-down(Li et al., 2020; Qiu et al., 2020; Tian et al., 2020), these studies focus exclusively
on the aggregated number. The micro-mechanism how lock-down stops outbreak has rarely
been analyzed based on real data. On the other hand, many countries, such as Italy, adopted
similar lock-down policy, but failed to contain the outbreak of COVID-19 as China did. The
South Korea and Japan didn’t close up their major cities nor impose severe travel restriction
to those uninfected people(Iwasaki and Grubaugh, 2020; Park et al., 2020; Shaw et al., 2020),
but they both reported a low growth rate of infections within a relatively short time. Hence,
it cannot be confirmed that the containment is achieved by lock-down unless the effect of
other confounding non-lock-down measures, such as the conditional quarantine and social
distancing, can be separated.
    To this end, a thorough investigation on the necessity of lock-down and its functioning
mechanisms is needed. At the same time, due to the severe social-economic cost of lock-
down (Atkeson, 2020; Barro et al., 2020; Bootsma and Ferguson, 2007; Halder et al., 2011;
Jorda et al., 2020; Kelso et al., 2020), it is neither feasible for the other countries that
are still struggling in the outbreak of COVID-19. Nor is an option for China given the
risk of experiencing a second-wave outbreak. Therefore, alternative measures to the lock-
down are recalled. A deep mechanism analysis of the lock-down can shed light on the
searching of alternative containment measures and understanding their effectiveness, it is
highly demanding at such a special moment when both US and China have experienced a
second-wave outbreak of COVID-19 in recent weeks but neither of the top 2 economies can
afford another round of lock-down.
    In this paper, we attempt to explore the mechanism issue mentioned above. Our analysis
is based on a novel network-based SIR (Susceptible-Infection-Recovery) model framework
(Li et al., 2020; Qiu et al., 2020) in which a time-lagged latent random infection mechanism
is added to capture the epidemic characteristics of undocumented infectious and long incu-
bation period, which cannot be handled in the classical SIR models (Heymann and Shindo,
2020; Keeling and Rohani, 2011; Li et al., 2020; Mizumoto et al., 2020; Qiu et al., 2020;
Wang et al., b; Zou et al., 2020). Unlike the model in Li et al. (2020); Qiu et al. (2020), to
capture hidden infection channels that are not directly linked to inter-regional population
flow, such as the infection through panic-induced gathering(Fang et al., 2020; Garfin et al.,
2020; Wang et al., 2020), we won’t adopt the prior assumption that the infection propagation
cross regions can only be via the inter-regional population flow. Instead, a non-parametric
network-based SIR model is applied, in which we do not impose any prior knowledge on the
link weights across regions and let it be fully inferred from the COVID-19 outbreak data via
deep learning methods. Using the inferred network, the connections between the infection
link weights and the population flows are established through standard regression technique
and tested for significance, by which, a counterfactual evaluation for the real effect of lock-
down is carried out. Different from the counterfactual analysis done in existing literature
(Chinazzi et al., 2020; Li et al., 2020; Qiu et al., 2020; Tian et al., 2020) that attempt to
justify the travel ban and the city lock-down measures as a sufficient condition for China’s
achievements in fighting COVID-19, we evaluate the necessity of these measures in the sense

                                               2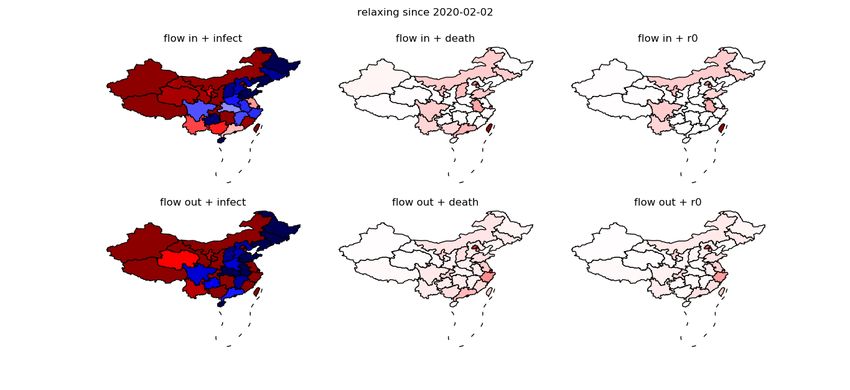
whether or not there exists much more moderate prevention measures that are as effective as
the travel ban and city lock-down in terms of containing the outbreak of COVID-19, while
have less negative impact on the social-economic development. We give positive evidence
for the existence of such alternative measures, and also discuss the substitutability between
lock-down and the other containment measures. We highlight that the substitutability can
help quantitatively design the combination of containment measures that reach the balance
between containing COVID-19 and the social-economic cost.

2. Methodology
2.1. Model construction
    The NP-Net-SIR model is set up as the following:
                              Z t
                      dn(t)
                            =          pI (τ, t)W(t) · n(τ )dτ − r(t)n(t)
                       dt      t−incub
                              Z t                                                              (1)
                       m(t) =          pB (τ, t)n(τ )dτ
                                    t−incub
                                >
where n(t) = (n1 (t), . . . , nk (t)) is the vector of the cumulative number of infectious cases of
k regions by time t, both the documented and undocumented cases are included within n(t),
m(t) = (m1 (t), . . . , mk (t))> denotes the documented number of infectious case by time t,
r(t) is the time dependent recovery rate. To reflect the epidemic characteristics of COVID-
19 that the incubation period (14 days) is very long (Heymann and Shindo, 2020; Li et al.,
2020; Mizumoto et al., 2020; Qiu et al., 2020; Wang et al., b; Zou et al., 2020) and the
asymptomatic infectious cases can proceed the transmission, we add two time-dependent
probability pB (·, t) and pI (·, t), they capture the time-lagged randomness within the two
processes that the hidden infectious cases get discovered (pB ) and that the hidden infectious
cases transmit the virus to healthy people (pI ). Without loss of generality, we let r, pB and
pI depend on time continuously so as to capture the impact of time and the government
prevention measures.
    To formulate the spatial interactions of COVID-19 outbreak, we set a family weighted
network adjacency matrices {W(t)} with Wij (t) ∈ [0, 1] for all ij entries and all t. The
adjacency matrix W(t) captures the cross-regional link weight of COVID-19 outbreak and
can be interpreted as the proportion of the past cumulative infectious cases in region j that
contribute to the newly infected cases in region i. In previous studies (Li et al., 2020; Qiu
et al., 2020), the adjacency matrices are directly identified as a constant multiple of the
population flow matrix cross regions. This assumption is not sufficient to capture outbreak
channels other than the point-to-point travel, such as the infection by panic-driven gathering,
multi-destination travelling and the like (Cohen and Kupferschmidt, 2020; Ferguson et al.,
2020; Harris, 2020; Pueyo, 2020; Wang et al., 2020). To account for these hidden channels,
we take the non-parametric specification of W rather than impose prior knowledge. We
also let W continuously depends on time t, accounting for the effect of time and various
prevention measures. Model (1) is trained by deep learning technique, and the details are
presented in Appendix A.

                                                3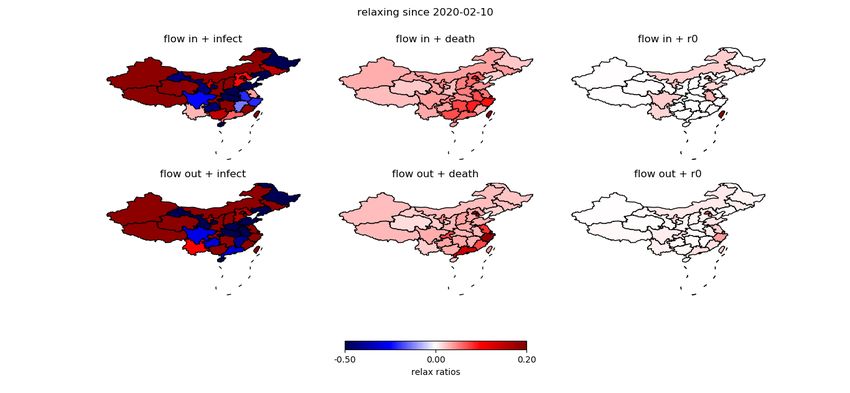
2.2. Counterfactual evaluation on the effects of travel ban and lock-down
    The effects of travel ban and city lock-down on containing the outbreak of COVID-19
can be evaluated based on the population flow data from Baidu Migration Index (avail-
able through the url “https://qianxi.baidu.com/”) and the trained NP-Net-SIR. The tem-
poral network adjacency matrix W(t)s sketches the cross-regional outbreak link strength of
COVID-19 and its variation trend over time. The variation of W(t) is by and large the con-
sequence of the travel restriction policies, but as we comment in the introduction, it cannot
exclude the impact of panic and the other type of unaware driving force. To single out the
impact of travel ban and city lock-down, we apply the following regression analysis:

                                   Wkj (ti ) = α + βTkj (ti ) + εkji                                (2)

where the temporal matrix T(ti ) is the weighted average of the singe-day population flow
matrices T(ti )s (extracted from Baidu migration index) by the infection probability pI (·, ti )
                                        incub−1
                                          X
                             T(ti ) =             pI (j, ti )T(ti − incub + j).                     (3)
                                         j=0

    Since Wuhan City was locked down, a bucket of containment measures had been applied
by both Wuhan and the other major cities in China, such as the social distancing, conditional
quarantine and setting health checkpoint in major transportation facilities etc., all of which
could affect the link weights and contribute to contain the outbreak of COVID-19. To
differentiate the effect of lock-down from the other measures, we fit the equation (2) only
using the data with Jan. 23, 2020 when Wuhan start to lock down. Given the estimates
coefficient α̂, β̂, the estimate to the residuals ε̂kji for the ti s after Jan. 23, 2020 are calculated
and interpreted as the part of infection link weights unexplainable by population flows,
accounting for the effect of the non-lock-down measures. Fix α̂, β̂ and ε̂kji s, (2) will be used
to evaluate the impact of counter-factually increasing the population flow intensity between
region pairs.
    Unlike the existing studies (Anderson et al., 2019; Chinazzi et al., 2020; Fang et al.,
2020; Li et al., 2020; Qiu et al., 2020; Tian et al., 2020; Zhang et al., 2020) that focus
almost exclusively on the sufficiency question, i.e. whether lock-down really help mitigate
the outbreak of COVID-19, this study attempts to answer the inverse problem. That is the
necessity of lock-down, i.e. whether or not there exists an alternative prevention strategy
that causes less damage to the social-economic development while performs as effective as
the travel ban and lock-down in containing the outbreak of COVID-2019. Since the existence
of such alternatives might be timing-sensitive, we consider different initialization time ts for
the counterfactual worlds in which the travel ban and city lock-down are relaxed. The degree
of relaxation is measured by a proportion rjk for each pair of destinations j and k such that
after the the relaxation, the traffic flow intensity is increased to Trjk (ti ) = (1 + rjk ) × Tjk (ti )
for ti ≥ ts . Given the relaxed population/traffic flow matrix Tr (ti )s, we can update the
adjacency matrix W(ti ) to Wr (ti ) via (2). Denote r as the matrix consisting of all rjk s,
then we evaluate the necessity of travel ban by asking whether there exist a positive r

                                                       4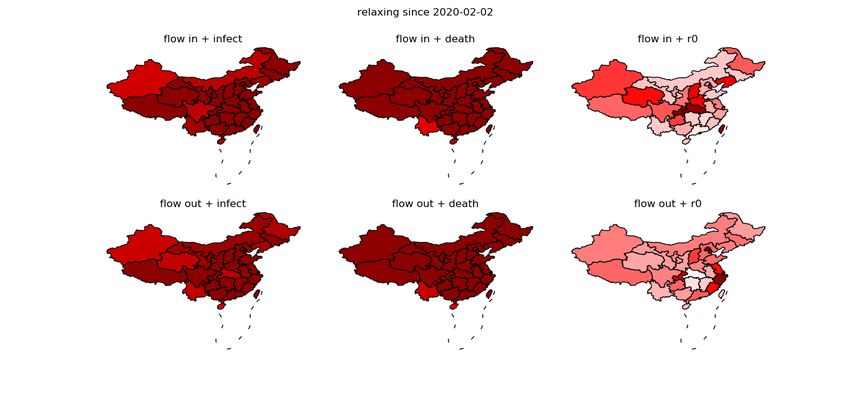
matrix (with at least one positive entry and no negative entries at the mean time) such that
under the updated Wr (ti )s by r, the outbreak status of COVID-19 are no worse than the
current for every ti ≥ ts . The comparison of outbreak status between the real case and the
counterfactual case can be measured in various different ways. In this study, we focus on
three measures that are summarized through the following three constraints:

                    R0 (Wr (ti ), r(ti )) ≤ max(R0 (W(ti ), r(ti )), 1), ∀ti ≥ ts              (4)

                                    mr (ti ) ≤ m(ti ), ∀ti ≥ ts                                (5)
                                    Dr (ti ) ≤ D(ti ), ∀ti ≥ ts                                (6)
where R0 is the basic reproduction number which depends on the maximal eigenvalue of
adjacency matrix and recovery rate. mr (ti ) denotes the estimated documented infectious
case by the updated Wr matrix through (1). D(ti ) (Dr (ti )) is the total death cases (updated
by r) by time ti which depends on both the total number of infections and the local healthcare
resources, the detailed calculation of D(ti ) is presented in Appendix C.
    These three constraints refer to three different goals of prevention, which require that
after relaxation, the total number of infection and death shouldn’t be greater than their
current value, R0r shouldn’t induce infection divergence (greater than 1) or at least shouldn’t
be greater than its current value. The “no greater than” relation in (4)-(6) is in the point-wise
sense, i.e. it has to hold for all region and all time after ts , therefore, it is a very stringent
restriction on the relaxation. Formally, any non-trivial relaxation r matrix satisfying the
constraints corresponds to a Pareto improvement of the current prevention strategy. In our
counterfactual analysis, we shall search for each constraint type the Pareto optimal relaxation
strategy r∗ from which no further Pareto improvement is allowed. This Pareto optimal r∗ has
practical significance in guiding the containment measure design for those countries suffering
from COVID-19 now.

2.3. Counter-factual evaluation on the substitutability between lock-down and other non-lock-
     down measures
    Except for city lock-down, many other non-lock-down measures have also been utilized
to prevent COVID-19 outbreak, such as the “social distancing” (Pike and Saini, 2020; Zhang
et al., 2020). All these measures can contain the outbreak of COVID-19, while compared
to travel-ban and city lock-down, they generate less negative impact on the social-economic
development, meanwhile their application is more accurately targeted rather than applies for
all people regardless their healthiness and vulnerability to COVID-19. It can be reasonably
expected that the execution of these non-lock-down measures can by and large substitute
the lock-downs and reduce the harm to the economy induced by lock-down.
    To quantify the substitutability, we extend (2) to include the effect of non-lock-down
measures. We roughly divide all the non-lock-down measures to two classes, which are the
measures adopted by the flow-in regions and the measures by the flow-out regions. The
flow-in measures, its effect is quantified as a parameter ink (ti , ta ), include the quarantine
of arriving travellers from out-town, the close up of schools, the cancelation of gathering

                                                 5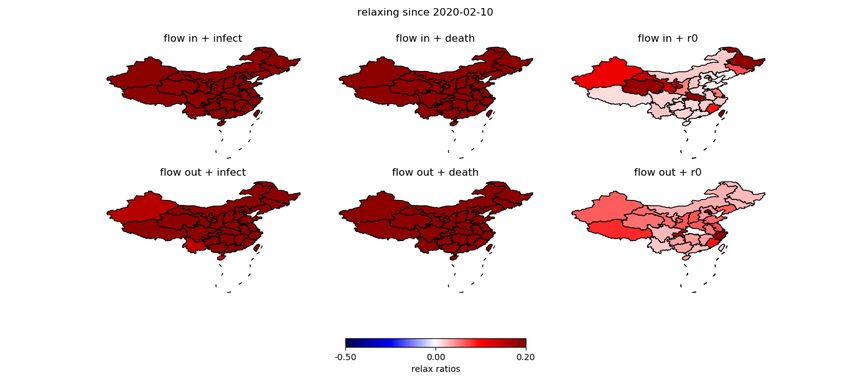
public activities and so on; the flow-out measures, its effect quantified as another parameter
outj (ti , tb ), include setting health check point in the entrance of inter-regional high-way,
airport, rail stations and so on. The notation k, j represent the index for regions, ta and tb
represent the starting date of the relevant measures, in the other words, we let
                                                        (
                                                         γk , ti ≥ ta
                                       ink (ti , ta ) =
                                                         0, else
                                                        (                                   (7)
                                                         θj , ti ≥ tb
                                      outj (ti , ta ) =
                                                         0, else

for some constant magnitude parameter γk s and θj s that measure the execution strength of
relevant measures. Adding ink (ti , ta ) and outj (ti , tb ) into (2) yields the following regression:

                  Wkj (ti ) = α + (β − outj (ti , tb )) · Tkj (ti ) − ink (ti , ta ) + ε0kji      (8)

where we suppose the flow-in measures impact the infection adjacency matrix additively
while the flow-out measures impact through a multiplier of the population flow. For the
starting date of two classes of non-lock-down measures, we follow the timeline provided in
Tian et al. (2020) and set ta as Jan. 26, 2020 when all 31 provinces in mainland China had
already initiated the first-class protocol for emergent public health event which include the
execution of various quarantine measures and the close-up of major public facilities. tb is
set to Jan. 30, 2020 when health check point had been set at all major high-way entrances,
railway stations and airports within Mainland China.
     Given the estimate to parameter γk s, θj s and the residuals ε0jki , the counterfactual analy-
sis is done by solving the same set of Pareto optimization problem under the same constraints
as in the previous section. The only difference is that in the current setting, not only the re-
laxation matrix r, but the set of non-lock-down parameter γk s, θj s can also be simultaneously
adjusted.

3. Results
3.1. Goodness of model fitting
     The NP-Net-SIR model is trained by using the province-level daily infection data col-
lecting during Jan. 10 - Mar. 8, 2020 and from the official website of the National Health
Commission (NHC) of China.
     Fig. 1 and 2 present respectively the fitting to temporal variation trend of documented
infectious case from Jan. 10, 2020 to Mar. 7, 2020 for the national-wide aggregation case
and province-level case for all 31 provinces in mainland China. Table 1 reports the fitting
                         2
accuracy R2 := km̂−mk
                    kmk2
                           measuring the relative difference between the estimated (m̂) and
the real (m) documented infection number since Feb. 12, 2020. It is quite apparent that the
fitting accuracy after the Feb. 12, 2020 for all situations in the two figures are extremely high
(R2 > 0.99 for the aggregation over the whole China), and the fitted number is systematically

                                                      6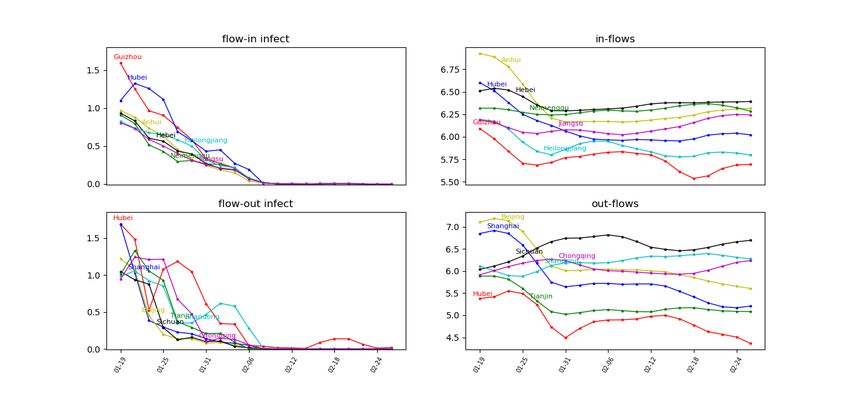
Figure 1: Aggregated documented infectious cases over all 31 provinces in Mainland China

greater than the reported number before Feb. 12, 2020. This is due to that we set Feb. 12,
2020 as the change point before which we do not punish the positive estimation error so
as to reflect the potential under-estimate of the report data. The high accuracy after Feb.
12, 2020 demonstrates the explanation power of our NP-Net-SIR model. As a comparison,
we run the classic SEIR model with the version discussed in Li et al. (2020) on the same
data set, and calculate the R2 measure for both model after Feb. 12, 2020, the result shows
our model performs much better by lifting R2 by 12%. The difference between the “over-
estimated” infectious cases by our model and the reported cases before Feb. 12, 2020 can be
thought of as a measure to the hidden infectious case that are not counted in the statistics.
We calculate the ratio of the hidden cases and the total cases, finding that on the national-
wide level, there were 79.27% of hidden cases on average that were not reported before Feb.
12, 2020, this ratio is close to the one reported in Tian et al. (2020). If we look at the
province-level data, the hidden ratios exceeds 90% for most of the provinces in mainland
China, among which Fujian, Guizhou, Yunan, Jiangsu, Jiangxi and Shanxi provinces are the
top 6 with hidden ratios greater than 96%, while Hubei is the province with lowest hidden
ratio (70%). This outstanding hidden ratio of Hubei can be attributed to the fact that Hubei
is the epicenter of the COVID-19 outbreak within China, which was attacked by COVID-19
in the earliest time, and also reacted earliest in time to the virus. In contrast, all the other
provinces suffered from the transmit-in cases in the early stage and therefore failed to react
in time and cause a significant delay of updating the number.

                                                        7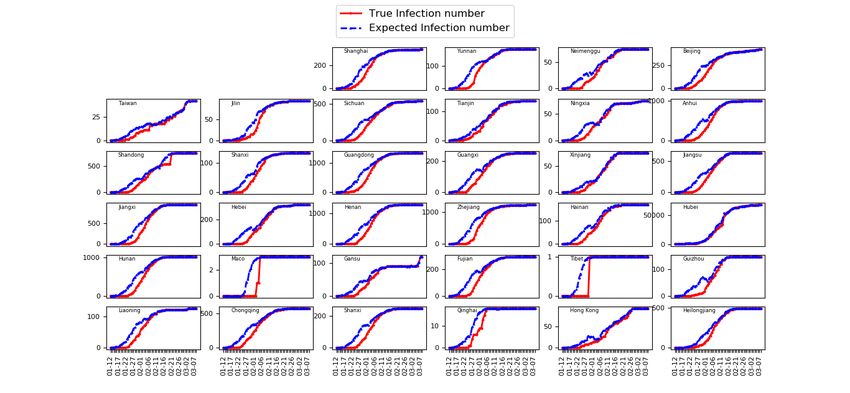
Table 1: Estimation Accuracy by R2

                                              Province       R2
                                              Full country   0.996
                                              Shanghai       0.979
                                              Yunnan         0.967
                                              Neimenggu      0.979
                                              Beijing        0.972
                                              Taiwan         0.978
                                              Jilin          0.977
                                              Sichuan        0.975
                                              Tianjin        0.991
                                              Ningxia        0.979
                                              Anhui          0.968
                                              Shandong       0.979
                                              Shanxi         0.979
                                              Guangdong      0.971
                                              Guangxi        0.974
                                              Xinjiang       0.993
                                              Jiangsu        0.976
                                              Jiangxi        0.977
                                              Hebei          0.976
                                              Henan          0.976
                                              Zhejiang       0.965
                                              Hainan         0.981
                                              Hubei          0.997
                                              Hunan          0.974
                                              Maco           0.897
                                              Gansu          0.976
                                              Fujian         0.964
                                              Tibet          0.907
                                              Guizhou        0.967
                                              Liaoning       0.973
                                              Chongqing      0.978
                                              Shanxi         0.968
                                              Qinghai        0.963
                                              Hong Kong      0.984
                                              Heilongjiang   0.984

3.2. Overview of the infection dynamics
    Due to the close connection between cross-regional population flow and the inter-regional
outbreak of COVID-19 claimed in the literature (Li et al., 2020; Qiu et al., 2020), we present
an overview on the strength of this connection in the following Fig. 3 and 4, in which
the correlation between the (estimated) temporal infection adjacency matrix W(t) and the
traffic flow matrix T(t) are visualized in different manners. The first line subplots of Fig. 3
consists of the scatter plots of all Tkj (ti )s versus Wkj (ti )s before (left) and after (right) the
time of Wuhan lock-down (Jan. 23, 2020). The second and third lines of Fig. 3 plot only
those Tkj (ti ) and Wkj (ti )s that are end up with (the second line) or sourced from (the third
line) Hubei province. To make the variation trend of the relation between W(t) and T(t)
clearly visible, we only plot the entries of W(t) and T(t) for five dates before and after Jan.
23, 2020. Fig. 4 gives the temporal view of the variation trend of the total flow-in (first
line) and flow-out (second line) infection link weight and traffic flow intensity since Jan. 19,

                                                  8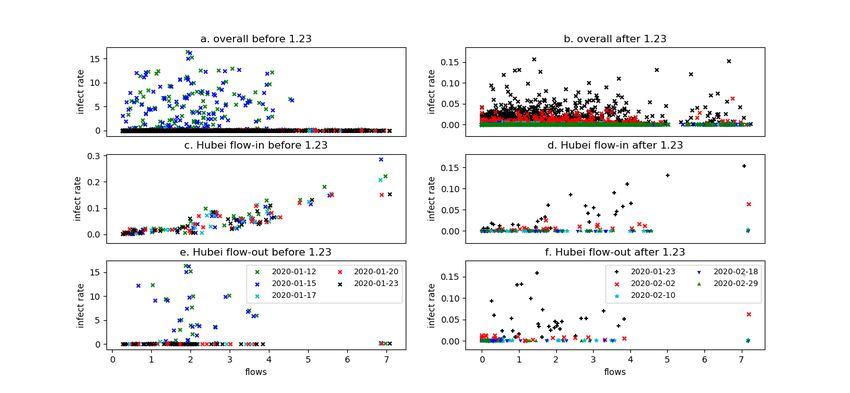
Figure 2: Documented infectious cases for 31 provinces in Mainland China

2020 and for the top 7 provinces (we rank all 31 provinces by their aggregated flow-in and
flow-out infection link weight averaged up to Jan. 23, 2020 in the descending order, and plot
the data for first 7 provinces in each of the flow-in and flow-out category). In all the plots,
we make the log transform for entries in W(t) and T(t), the horizontal axis corresponds to
the entries of T(t) vertical axis corresponds to W(t). For the entries of W(t), we rescale it
first by the potential infection number, i.e. Wkj (t) · nnkj (t)
                                                             (t)
                                                                 before taking log transform. By
rescaling, we hope to take the effect of the stock number of potential infections into account.
    From the first line of Fig. 3, a counter-intuitive finding is that the correlation between
population flow intensity across regions and the infection link weight is quite weak, no
matter before or after Jan. 23, 2020. Especially in Fig. 3, a great portion of scatter
points are clustered around a straight line close and parallel to the horizontal axis, such an
observation does not support a linear correlation exists between W(t) and T(t) as imposed in
Li et al. (2020); Qiu et al. (2020). The the subfigure 3c. and 3e. do show a significant linear
correlation between population flow strength and the infection link weight at least before the
lock-down, while the flow-out population before Jan. 23, 2020 turns out more powerful in
spreading the virus as in the subfigure 3e., the scale of the vertical axis is much greater than

                                                      9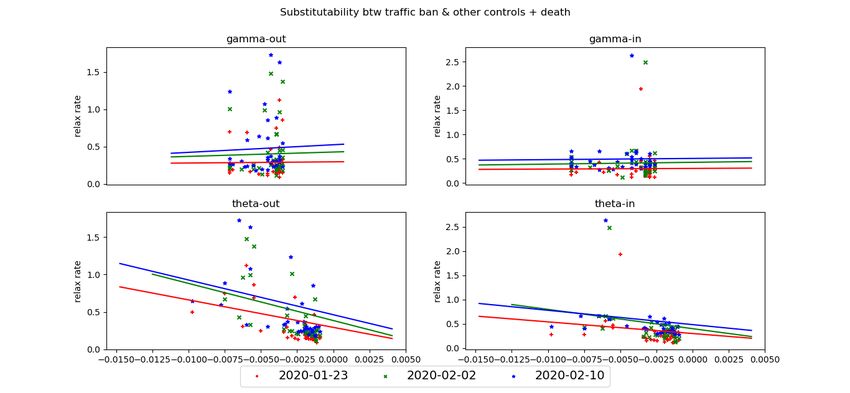
that in the subfigure 3c.. But on the other hand, after Jan. 23, 2020, the linear relationship
between W(t) and T(t) gets sharply decayed, after Feb. 10, 2020, the correlation coefficient
between entries of them cannot be differentiated from 0 no matter for either the flow-in or
the flow-out population. This observation contradicts to the classic assumption in Li et al.
(2020); Qiu et al. (2020). In fact, by the linear correlation assumption, the city lock-down
can only control the number of people moving across regions, it has nothing to do with the
proportion of infectious cases within these migrants, which should be a constant if only the
lock-down and/or travel ban measures are applied. In the other words, if lock-down really
works to contain the outbreak, the scatters in the right panel of Fig. 3 should converge
gradually to the origin along with a straight line with positive slope, rather than all scatters
rotated toward the horizontal axis as shown in Fig. 3. The finding implies that the measures
that really help contain the outbreak of COVID-19 may not be the lock-down, instead, they
should be the other measures initiated almost simultaneously with the lock-down and their
effect confounded with that of lock-downs. To correctly evaluate the real effect of each
type of containment measures, we have to differentiate the confounding measures and their
impact, which we shall leave to the discussion in section 3.4.
    By Fig. 4, there exists an significant gap period around one week between the vanishing
of the flow-in and -out infection link weight and the decay of the corresponding population
flow intensity. For the time series of flow-in and -out population intensity, all top 7 provinces
reached their minimum before Jan. 31, 2020, while at the mean time none of them have
made the flow-in and -out infection link weight decayed to somewhere close to zero until Feb.
6, 2020. Such an one week gap period reflects the effect of the long incubation period of the
COVID-19 and the fact that its infection can happen via infectious cases without symptoms.
The classical SIR/SEIR models ignore this gap period and tend to over-estimate the basic
reproductive number R0 in the early stage which would trigger the most severe containment
measures, such as the lock-down, if the decision is made upon that base.
    In sum, from the brief overlook on the numerical relationship between infection link weight
W and the population flow intensity T, we can summarize: 1) the positive linear correlation
assumption made in many versions of the SIR/SEIR model (Efimov and Ushirobira, 2020;
Fang et al., 2020; Li et al., 2020; Qiu et al., 2020; Tian et al., 2020) does not hold uniformly
during the outbreak of COVID-19, but it does hold for the population flow into and out of
Hubei province before the great lock-down; 2) after the lock-down initiated since Jan. 23,
2020, the positive linear correlation between W and T is reduced significantly and fastly
to zero and this reduction shouldn’t be simply attributed to the contribution of lock-down,
the effect of other confounding measures should be examined more carefully; 3) an one-week
gap-period exists between the decay of population flow intensity and infection link weight,
which should be a consequence led by the epidemic characteristics of COVID-19, the classical
SIR/SEIR model neglects this gap-period and can lead to too severe containment measures.

3.3. Relaxation of population flows
    As discussed in the previous section, the correlation between population flow intensity
and infection link weight is weak in most cases. This observation implies that the most

                                               10
Figure 3: Relationship between infection link weight W and population flow intensity T with Hubei as origin/destination
province
severe travel ban and lock-down may not be that necessary for those regions among which
the infection connection is weak. Therefore, there should be potential to relax the lock-down
even if the containment level of COVID-19 had to be maintained. To verify this argument,
we solve the relaxation optimization problem stated in section 2.2, the result is plotted within
Fig. 5, where we plot the averaged ratio of the relaxation of population flow-in and flow-out
intensity for all provinces in China. The ratio
P for everyP province k (or j) is calculated through
dividing the sum of all flow-in/-out index j Tkj (ti ) ( k Tkj (ti )) by their optimally relaxed
P r P r
version j Tkj (ti ) ( k Tkj (ti )), the average is taken over all ti s after the relaxation starting
date. Fig. 5 displays the relaxation degree for all the three alternative starting date, Jan.
23, Feb. 02 and Feb. 10, 2020, and all the three containment targets (4)-(6).
From Fig. 5, it is quite impressive that if control target is the total infectious cases, it
seems impossible to relax the population flows between any pair of provinces without any
more strict travel ban executed for Hubei and a couple of provinces that geographically
connect to Hubei. And the impossibility of relaxation hold for all the three starting points.
Such a result verifies the necessity of lock-down and strict travel ban executed by most of
major cities in China since Jan. 23, 2020. This conclusion also agrees with the discussion in
Li et al. (2020); Qiu et al. (2020); Tian et al. (2020).
But on the other hand, if the target is to control the temporal R0 that reflects the long-run
infection severity and/or the total death number, the global relaxation becomes feasible even
11Figure 4: The temporal variation trend of the aggregated flow-in/-out infection link weight and population flow intensity
if starting from Jan. 23, 2020. In particular to the total death number, the travel restriction
of all provinces in China can be relaxed substantially. For most of provinces in the south-
eastern coast regions, the ratio of relaxation for flow-out population can exceed 10%, while
the flow-in relaxation ratio exceeds 5%. In Zhejiang, Guangdong, Beijing, Shanghai and
Tianjin, the flow-out ratio is even greater than 15% and flow-in ratio is close to 10%. As
known, these five provinces consist of the most developed area of China in economy. A
substantial relaxation of the traffic connection both within them and between them and the
other provinces can significantly stimulate the overall economy growth for China.
On the other hand, despite the existence of global relaxation strategy for the control
target R0 , the potential for relaxation is not large. In the south-eastern coast area, most
provinces have to maintain a strict travel ban at least in one direction (flow-in or out) in order
to keep the R0 reasonably low (in the sense of constraint condition (4)). This observation
is partially because the index R0 is much more sensitive, compared with the total death
number, to the change of entries of W, which restrict the space to relax the population
flow. But compared with the total infection number, R0 is less sensitive to the change of
W because R0 depends merely on the greatest positive eigenvalue of W, while the infection
number relies on every single entry. This explains why the global relaxation is still feasible
for controlling R0 but infeasible for controlling the total infections.
Finally, if we come back to the target of controlling total infection, a partial relaxation
strategy does exist after all (the partial relaxation arrangement is determined by maximizing
12P r
the overall traffic flow intensity across all provinces, i.e. maximizing j,k,i Tjk (ti ), under the
same set of constraints (4)-(6), the overall traffic flow intensity can be viewed as an measure
to the active degree of the economy). It is remarkable that since Feb. 02, 2020, if the
travel ban was further strengthened for Hubei and its nearby provinces, the relaxation ratio
for flow-out population becomes high for major south-eastern provinces, including Fujian,
Zhejiang, Shanghai, Jiangsu, Beijing, Tianjin and Hebei, while the positive flow-in relaxation
ratio is allowed to be positive for Guangdong. The existence of such an partial relaxation
arrangement shows the existence of cross-regional substitutability of the strictness of lock-
down, it also implies that a centralized decision mechanism for the choice of lock-down and
travel ban could be more efficient in balancing the containment of COVID-19 outbreak and
the economy resume.
In sum, by the counterfactual analysis on the relaxation of travel ban and city lock-down,
we find that global relaxation strategies do exist for both the control target of R0 and total
death number, while it does not exist for control the total infection number, this observation
results from the relative sensitivity between the control target variables and infection link
weight W. According to the degree of easiness in relaxing lock-down, controlling death is
easier than controlling R0 , both of which are easier than controlling infection. To control the
death number, a substantial relaxation has already been feasible since early Feb. 2020 for
the major provinces in the south-east coast areas, relaxation for these provinces is critical
to maintain the national-wide economy development. To control total infection, although a
global relaxation is never feasible during the period studied in this paper, a partial relaxation
is still possible by which the traffic intensity for south-eastern provinces can be relaxed
substantially at the cost of a more strict lock-down for Hubei and the provinces that have
close connection with Hubei. Such a partial relaxation arrangement is better for economy
recovery, but its feasibility relies on the centralized decision on the lock-down as it does harm
the local benefits via a more harsh travel ban.
3.4. Relaxation of population flows under other non-lock-down measures
In this section, we study the substitutability between lock-down and alternative non-lock-
down measures. A further counter-factual analysis is carried out to reveal how the extent of
population flow relaxation response to the strengthen of the non-lock-down measures.
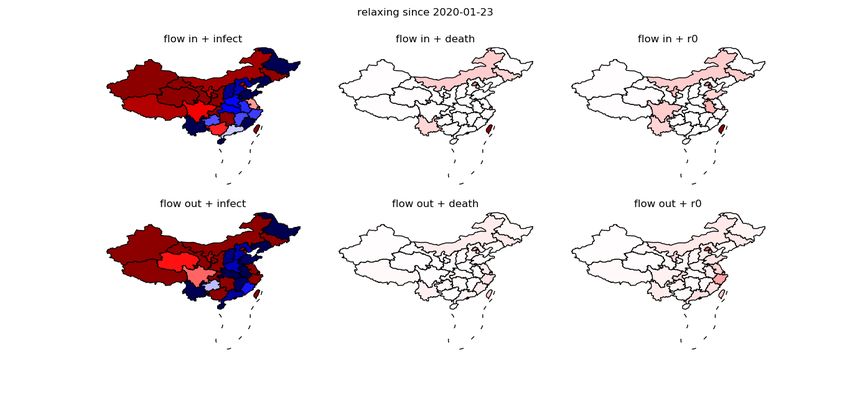
Fig. 6-8 sketches the substitutability between the two classes of non-lock-down measures
(their effect and executive strength are quantified by γk s and θj s respectively) and the relax-
ation ratios of lock-down under three targets since three starting dates. As in the previous
section, the relaxation ratios are aggregated according to the flow-in and -out direction on
the province level and averaged over all time after the corresponding starting date. The
first line subplots of Fig. 6-8 give the substitutability of the province-level γs (horizontal
axis) versus the flow-out(left)/flow-in(right) relaxation ratios (vertical axis); the second line
presents the substitutability between the province-level θs (horizontal axis) and the the flow-
out(left)/flow-in(right) relaxation ratios (vertical axis). The colored straight lines in each
subplot correspond to the OLS-fitted line to the scatters with the same colors where the
color is used to distinguish the three starting dates. From Fig. 6-8, it is straightforward that
13Figure 5: One set of optimal relaxation solutions to city-level travel ban since Jan. 23, Feb. 2 and Feb. 10, 2020
there exists a gradually substitutable relationship between the non-lock-down measures by
the flow-out region (represented by θs) and the relaxation ratios. In addition, the substi-
tutability between the θs and the flow-out relaxation ratios is stronger than between that
14and the flow-in relaxation ratios, this can be explained by that the θs is designed to capture
the effect of such measures as setting health check-point in the high-way entrance, rail sta-
tions and airports. The main function of these measures is to reduce the potential infectious
risk of flow-out population, therefore, they are more straightforwardly replacing the func-
tion of locking down all people within the city no matter whether they are healthy or not.
In contrast, their effect on the flow-in relaxation ratios is via an indirect way. Compared
to the substitutability of θs, there seems not to exist the gradual substitutability between
the γs and relaxation ratios. This is partially caused by the fact that the γs represent the
effect of the conditional quarantine measures executed by flow-in destinations and applied
to suspected infectious cases and those travellers coming from out-town. These quarantine
measures are not directly linked with the cross-regional population-flows and therefore affect
the infection connection matrix W in an additive way. Compared to the multiplicative con-
nection between θs and W, the additive connection makes substitutability of γs less direct.
It is still impressive that most of the scatters in the second line subplots are clustered on the
left of a vertical boundary line (x ≡ c for some c < 0) and a dense subset of these scatters
are gathered around this boundary. In fact, this boundary phenomenon implies a much more
stringent substitutability. That is, an universally bottom line exists such that the strength
of flow-in non-lock-down measures cannot go below this line, otherwise it would squeeze the
potential to relax the population flow intensity.
Through comparison across the target types and starting dates, it is found that for
different targets, the degree of θ’s substitutability is increasing in the order of controlling
infection, R0 and death. In particular, for the target of controlling infection number, there
almost does not exist substitutability between θs and relaxation for the starting date Jan. 23,
2020 (reflected as the flat red line in the second line plots of Fig. 7), which once again verifies
the necessity of lock-down in the early stage. The order of substitutability is consistent with
the order of easiness in relaxing population flow analyzed in the previous section, implying
the relative easiness in the realization of different targets. For different starting date, the
degree of substitutability of the θs and γs is increasing for the later starting time, such as
Feb. 2 and 10, 2020, which is reflected as (for θs) a greater absolute slopes of the green and
blue lines than that of the red line in the second line plots of all three figures, and (for γs)
that the blue lines lie above green lines that lie above the red lines in the first line plots
of Fig. 7 and 8. The increasing substitutability along with time support the story that
the lock-down measure is effective in controlling the fast growth of infection number and
the induced burden to the local healthcare system, which makes lock-down beneficial in the
early stage of the explosion of community infection when there is no enough time left for
figuring out all unknown infectious sources and no sufficient medical resources to conduct
treatment. The lock-down in this stage can help save time for the effective reaction to the
virus in the next stage and the adoption of more subtly designed prevention measures in
the future. On the other hand, once if the explosion of community infection had been well
contained and the total number of infectious cases were stablized, substitutability between
lock-down and the other measures comes up, and it is proper to gradually turn lock-down
to the other mild measures. Such a transition of containment measures agrees with the idea
15discussed in Harris (2020); Pueyo (2020).
The next figure 9 presents the geographic distribution of relaxation ratios of flow-in and
-out populations for different targets and different starting dates. The coloring scheme is ex-
actly the same as that in Fig. 5. Comparing Fig. 9 with Fig. 5, it is quite surprising that for
the starting date Feb. 2 and Feb. 10, 2020, almost all provinces (including Hubei province)
in China can significantly relax their travel ban and lock-down policies, the relaxation ratios
are almost uniformly greater than 20% for both the flow-in and flow-out direction, and for
both the targets of controlling total infection number and death number. For the target
of R0 , the optimal relaxation ratios are a bit smaller than the other two targets, and the
flow-out population flow of Hubei province cannot be relaxed even for the latest starting
date Feb. 10, 2020.
For the starting date Jan. 23, 2020, the optimal relaxation ratio does not change much
compared to the later starting date for the target of controlling the death number of R0 , but
a huge difference exist for the containment target of infection number. If we counter-factually
started the relaxation since Jan. 23, 2020, there is no global relaxation arrangement without
increasing the infection number for some provinces and some time after Jan. 23, 2020. This
conclusion is similar to that drawn from Fig. 5, it once again proves the robust necessity of
lock-down in the early spreading stage of COVID-19.
It is remarkable to highlight the difference in the absolute size of relaxation ratios between
the existence and non-existence of adjustment to the stringency of non-lock-down measures
since Feb. 2, 2020. In the later situation, the value of relaxation ratios is almost uniformly
twice greater that that in the former situation. This fact implies the existence of a bet-
ter combination of various control measures during the China’s anti-COVID-19 movement.
That is the execution of lock-down for a very short period since Jan. 23, 2020 (e.g. one
week) in order to save time for stablizing the infection number and meanwhile preparing for
the transition to the other milder measures, such as the conditional quarantine and health
check-points. Then gradually relax the degree of lock-down since Feb. 02, 2020 through
substituting with an increasingly stringent execution of the other non-lock-down measures.
Such a quick lock-down strategy, compared to the 1-month+ lock-down that was actually
carried out in the real time line, have the least harm to the economy while can reach the
same effect on mitigating the outbreak of COVID-19.
4. Discussion & Conclusion
In this study, we propose a non-parametric network-based SIR model (NP-Net-SIR) to
study the cross-regional outbreak of COVID-19, within which the special epidemic character-
istics of COVID-19, such as the long incubation period and asymptomatic infection channel,
are easily encoded. The non-parametric nature of NP-Net-SIR saves it from suffering the
presumed liner dependence between COVID-19 outbreak and the inter-regional population
flow, which might lead to over-estimate of the real effect of city lock-down. The low accuracy
of outbreak data before the mid of Feb. 2020 imposes a major technical challenge to those
studies based on statistic inference from the early outbreak. To resolve the data issue, we
16Figure 6: Substitutability between lock-down and non-lock-down measures given R0 target
Figure 7: Substitutability between lock-down and non-lock-down measures under controlling the total infectious cases
apply the graph-Laplacian regularization from semi-supervised learning to identify and train
NP-Net-SIR model which turns out robust under poor data quality condition.
By the trained model, we analyze the connection between population flow and the cross-
regional infection network, based on which a set of counter-factual analysis is carried out
to study the necessity of lock-down and substitutability between lock-down and the other
containment measures. The main findings of this study include: 1) except for the very
17Figure 8: Substitutability between lock-down and non-lock-down measures under controlling the total dead cases
early stage of outbreak and the population flow out of the epicenter Wuhan and Hubei
province, there does not exist strong linear connection between population flow and cross-
regional infection connection, indicating that the lock-down may not be the key measure
to contain the COVID-19; 2) strong substitutability exists between the lock-down and non-
lock-down-typed containment measures, between different containment targets, and between
the lock-down of different regions; 3) in the earliest stage (starting from Jan. 23, 2020) the
lock-down of the epicenter, Hubei, is indispensable, while the indispensability is by and
large attributed to the geographically unbalanced impact of the COVID-19 outbreak and
the cross-regional inequality in terms of the public awareness of the COVID-19, healthcare
resources and the implementation of containment measures; 4) after the impact of COVID-19
got equalized inter-regionally (e.g. after Feb. 2, 2020), the lock-down had already been able
to be relaxed substantially while the same containment effect can be achieved; 5) when the
other containment measures are implemented stringently, the relaxation degree of population
flow can be even enlarged.
Our findings support that the lock-down may not be the optimal strategy in containing
the outbreak of COVID-19 except for the early stage, there exist alternatives that have less
negative impact on the social-economic development. But the effectiveness of the alternative
measures requires a subtly designed prevention system which should admit the regional dif-
ference and the temporal adjustment in the containment measures according to the particular
situations for different regions and different time periods. The discussion in this paper has
certain guiding and practical significance for the normalization of the epidemic prevention,
the resumption of production and economic activities from lock-down, and the containment
strategy design of other countries in the same epidemic situation.
Although the analysis of this paper is retrospective and based on that all the data of
18Figure 9: One set of optimal relaxation solutions to lock-down since Jan. 23, Feb. 2 and Feb. 10, 2020 under the existence of
adjustable non-lock-down measures
COVID-19 have been available, which is not possible for the decision time at Jan. 23 and
the early Feb., 2020, it is still meaningful to retrospect the potential optimal controlling
19strategy. This is because even by now, China is still facing a high risk of the “second-wave”
outbreak. The choice of both feasible and effective containment measures is still a critical
but open question, while many countries in the world currently still struggle with how to
prevent the outbreak of COVID-19. Our study can provide some hints on this choice. First,
the China’s experience and the strict lock-down measure turns out not only sufficient (Fang
et al., 2020; Li et al., 2020; Prem et al., 2020; Qiu et al., 2020; Tian et al., 2020; Tuite et al.,
2020) for mitigating the virus spread, but may also be the only effective way to cool down
the explosion of community infection at least in the early spreading stage. But afterward, it
shouldn’t be stuck in the lock-down status for long which is neither meaningful for control
the virus nor good for the economic recovery. In contrast, a set of non-lock-down-typed
alternative measures should be quickly prepared and actively executed so as to substitute
the lock-down which, as long as being strictly executed, can lead to as effective control of the
virus as the lock-down can do. Meanwhile, without the collaboration of the non-lock-down-
typed measures, such as the conditional quarantine, the purely lock-down may also fail to
mitigate the COVID-19, as what happened in Italy, Spain, and New York, USA.
Acknowledgement:
This work was partially supported by the Ministry of Education in China Project of Hu-
manities and Social Sciences under Grant No. 20YJC790176, and the Fundamental Research
Funds for the Central Universities under Grant No. 2242020S30024.
References
Anderson, R.M., Heesterbeek, H., Klinkenberg, and Hollingsworth, T.D. Comment How
will country-based mitigation measures influence the course of the COVID-19 epidemic?
2019(20), 1-4.
Atkeson, A.G. What will be the economic impact of COVID-19 in the US? Rough estimates
of disease scenarios. Federal Reserve bank of Minneapolis, Staff Report 595, 2020.
Barro, R.J., Ursa, J.F. and Weng, J. The coronavirus and the great influenza pandemic:
Lessons from the Spanish Flu for the coronaviruss potential effects on mortality and eco-
nomic activity. National Bureau of Economic Research, No. w26866, 2020.
Bootsma, M.C., and Ferguson, N.M. The effect of public health measures on the 1918
influenza pandemic in US cities, Proceedings of the National Academy of Sciences, 104(18),
7588-7593, 2007.
Chen, S., Li, Q., Gao, S., Kang, Y. and Shi, X. Mitigating COVID-19 outbreak via high
testing capacity and strong transmission-intervention in the United States. medRxiv, 2020.
Chinazzi, M., Davis, J.T., Ajelli, M., et al. The effect of travel restrictions on the spread of
the 2019 novel coronavirus (COVID-19) outbreak. Science, 2020.
20Cohen, J., and Kupferschmidt, K. Strategies shift as coronavirus pandemic looms. Science,
367, pp962-963, 2020.
Efimov, and Ushirobira, R. On an interval prediction of COVID-19 development based on a
SEIR epidemic model. 2020.
Fang H., Wang L. and Yang Y. Human Mobility Restrictions and the Spread of the Novel
Coronavirus (2019-nCoV) in China. National Bureau of Economic Research, 2020.
Ferguson, N., Laydon, D., Nedjati Gilani, G., et al. Report 9: Impact of non-pharmaceutical
interventions (NPIs) to reduce COVID19 mortality and healthcare demand. Authors
website, Imperial College London, 2020.
Garfin D.R., Silver R.C. and Holman E.A. The novel coronavirus (COVID-2019) outbreak:
Amplification of public health consequences by media exposure. Health Psychology, 2020.
Golstein E.G. Theory of convex programming. American Mathematical Soc., 2008.
Halder, N., Kelso, J. K., and Milne, G. J. Cost-Effective Strategies for Mitigating a Future
Influenza Pandemic with H1N1 2009 Characteristics. PLoS One, 2011.
Harris D. How to Flatten the Curve on Coronavirus. The New York Times, 2020.3.27. URL:
https://www.nytimes.com/article/flatten-curve-coronavirus.html
Heymann, D.L. and Shindo, N. COVID-19: what is next for public health? The Lancet,
395(10224), 542-545, 2020.
Iwasaki A. and Grubaugh N.D. Why does Japan have so few cases of COVID19?. EMBO
Molecular Medicine, 12(5): e12481, 2020.
Jorda, O., Singh, S. R. and Taylor, A.M. Longer-run economic consequences of pandemics.
National Bureau of Economic Research, No. w26934, 2020.
Keeling M.J. and Rohani P. Modeling infectious diseases in humans and animals. Princeton
University Press, 2011.
Kelso, J.K., Halder, N., Postma, M.J. and Milne, G.J. Economic analysis of pandemic
influenza mitigation strategies for five pandemic severity categories. BMC public health,
13(1), 2020.
Li R., Pei S., Chen B., Song Y., Zhang T., Yang W. and Shaman J. Substantial undocu-
mented infection facilitates the rapid dissemination of novel coronavirus (SARS-CoV2).
Science, 2020.
Liu Q., Wu S., Wang L. and Tan T. Predicting the next location: A recurrent model with
spatial and temporal contexts. In Thirtieth AAAI conference on artificial intelligence,
2016.
21Mizumoto, K., Kagaya, K., Zarebski, A., and Chowell, G. Estimating the asymptomatic
proportion of coronavirus disease 2019 (COVID-19) cases on board the Diamond Princess
cruise ship. Yokohama, Japan, 2020.
Park S., Choi G.J. and Ko H. Information technologybased tracing strategy in response to
COVID-19 in South Koreaprivacy controversies. JAMA, 2020.
Pike, W. and Saini, V. An international comparison of the second derivative of COVID-19
deaths after implementation of social distancing measures. medRxiv, 2020.
Prem K, Liu Y, Russell T W, et al. The effect of control strategies to reduce social mixing
on outcomes of the COVID-19 epidemic in Wuhan, China: a modelling study. The Lancet
Public Health, 2020.
Pueyo, T. Coronavirus: The hammer and the dance. URL https://medium.
com/@tomaspueyo/coronavirus-the-hammer-and-the-dance-be9337092b56.
Qiu Y., Chen X. and Shi W. Impacts of Social and Economic Factors on the Transmission of
Coronavirus Disease 2019 (COVID-19) in China. Journal of Population Economics, 2020.
Shaw R., Kim Y. and Hua J. Governance, technology and citizen behavior in pandemic:
Lessons from COVID-19 in East Asia. Progress in disaster science, 2020.
Shen Z., Wang W., Fan Y., Di Z. and Lai Y. Reconstructing propagation networks with
natural diversity and identifying hidden sources. Nature communications, 5: 4323, 2014.
Tian H., Liu Y., Li Y. and others The impact of transmission control measures during the
first 50 days of the COVID-19 epidemic in China. Science, 2020.
Tuite, A.R., Fisman, D. and Greer, A.L. Mathematical modelling of COVID-19 transmission
and mitigation strategies in the population of Ontario, Canada. CMAJ, 2020.
Wang, C., Liu, L., Hao, X., et al. Evolving epidemiology and impact of non-pharmaceutical
interventions on the outbreak of coronavirus disease 2019 in Wuhan, China. medRxiv,
2020.
Wang D., Hu B., Hu C., and et al. Clinical characteristics of 138 hospitalized patients with
2019 novel coronavirus–infected pneumonia in Wuhan, China. JAMA, 2020.
Zhang, Y., Jiang, B., Yuan, J., and Tao, Y. The impact of social distancing and epicenter
lockdown on the COVID-19 epidemic in mainland China: A data-driven SEIQR model
study. medRxiv, 2020.
Zhou X. and Belkin M. Semi-supervised learning by higher order regularization. Proceedings
of the Fourteenth International Conference on Artificial Intelligence and Statistics, 892–
900, 2011.
22Zou, L., Ruan, F., Huang, M., et al. SARS-CoV-2 viral load in upper respiratory specimens
of infected patients. New England Journal of Medicine, 382(12), 1177-1179, 2020.
Appendix A. Training of NP-Net-SIR model
The non-parametric network set-up makes our NP-Net-SIR model essentially a special
class of recurrent neural network (RNN), namely the temporal RNN (Liu et al., 2016) with
the temporality coming from the time dependent neural network W(t). The total amount of
infections n(t), due to its unobservable nature, corresponds to the hidden layer of the RNN,
while the documented infections m(t) corresponds to the output layer. Due to the lack of
extra input to the NP-Net-SIR, the input layer is degenerated to 0. Given the observation of
the sequence of documented infections Mo = {Mti : i = 1, . . . , n; t1 < · · · < tn } and a proper
regularized loss function, the standard back-propagation method applies to estimate the set
of unknown temporal parameters {W(ti ), n(ti ), r(ti ), pI (j, ti ), pB (j, ti ) : i = 1, . . . , n; j =
1, . . . , incub}. Due to the discreteness of the observation time, the continuity condition
for these temporal parameters can be converted to a graph-Laplacian regularization with
the grid graph on real line (Zhou and Belkin, 2011), which is asymptotically equivalent
to require, under the high-frequent observation, these temporal parameters are continuous,
differentiable and have square-integrable derivatives. In our special case, the graph-Laplacian
regularization can be written in the following form:
n−1
X n−1
X
2
R(W, r, pB , pI ) =kW(tn )k + kW(ti+1 ) − W(ti )k + kr(ti+1 ) − r(ti )k2 +
i=1 i=1
n−1 incub
(A.1)
X X
kpB (j, ti+1 ) − pB (j, ti )k2 + kpI (j, ti+1 ) − pI (j, ti )k 2
i=1 j=1
where we artificially set the boundary W(tn+1 ) ≡ 0 so that the summation of hidden networks
W up to the supscript n implies the sparse requirement on the W(ti )’s which is standard
to avoid over-fitting.
For loss function, in addition to the standard square-sum error between the observed
Mti s and the estimated m(ti )s, we add an extra penalty to the error function in order to fix
the data pollution issue in the early stage of COVID-19 outbreak. In particular, we define
the following indicator function:
(
m − M if t ≥ t∗ or m > M
It∗ (t, m, M ) = , (A.2)
0 else
the meaning of (A.2) is that there is a cut-off time point t∗ before which the documented
infection number tends to under-estimate the real spreading trend. Therefore, if the esti-
mated number m exceeds the reported M we think the estimates reflect the true case and
don’t treat it as an error, while if the estimated is less than the reported, which indicates a
severe under-estimate to the true case, the error is calculated as usual. After t∗ , it is thought
23that all hidden infectious cases that should be documented and published have already been
reported, then the reported cases agree with the real trend. In this paper, we set t∗ as the
date, Feb. 12, 2020, when Wuhan local government reported 13,000+ inventory infectious
cases that were not in record before. Then the loss function can be written as the following
form:
n X
X k
L(Mo , m, n, W, r, pB , pI ) = k(Mti ,j −mj (ti ))∗It∗ (ti , mj (ti ), Mti ,j )k2 +R(W, r, pB , pI ),
i=1 j=1
(A.3)
where the loss depends on the hidden infection number n through the observed infection
number m via model (1).
Note that the RNN nature of the model (1) makes the infection number n(t), m(t)
generated from n(s), m(s) for s < t, then by the back-propagation algorithm, the model (1)
is fitted in a reversed order, i.e. the parameter values of n(s), W(s), pI (·, s), pB (·, s) and
r(s) for previous period s are essentially fitted from the later observations m(t) with t > s.
The back-ward fitting direction together with the function (A.2) presents a way to utilize the
label data m(t) at time t > t∗ to generate label of infection number for those un-labeled time
s with s ≤ t∗ , such a trick of utilizing partially labeled data is standard in semi-supervised
learning (Zhou and Belkin, 2011), we borrow it here to address the inaccurate data issue for
the early stage.
To estimate the parameters, we minimize the loss function with respect to parameters
and also subject to the default range restrictions that are the following:
0 ≤ Wkl (ti ) ≤ 1, ∀k, l, i
r(t ) ≥ 0,
i ∀i
(A.4)
p B (j, ti ), pI (j, ti ) ≥ 0, ∀j, i
P P
j pB (j, ti ) = j pB (j, ti ) = 1, ∀i
The quadratic nature of the square-sum loss function guarantees that even if the penalty
(A.2) is added, the resulting loss function (A.3) is still continuously differentiable, standard
gradient descending solvers are applicable.
Appendix B. Training algorithm
Training model (1) is equivalent to solving the optimization problem in (A.3) under
the constraints (A.4). The classical gradient-descending-based solution for RNN usually
assumes no constraint. Therefore, some modifications are needed. In the following, we
propose a sequential modification to the classical backward propagation training algorithm
for neural network model. To facilitate the introduction of the sequential algorithm, we
temporally assume the temporal RNN is no longer temporal, but a static RNN, i.e. all the
temporal parameters W, pB , pI and r are no longer dependent on t. Also suppose that
24You can also read