Demographic perspectives on the rise of longevity - PNAS
←
→
Page content transcription
If your browser does not render page correctly, please read the page content below
PERSPECTIVE
PERSPECTIVE
Demographic perspectives on the rise of longevity
James W. Vaupela,b,1, Francisco Villavicencioc, and Marie-Pier Bergeron-Bouchera,b
Edited by Douglas S. Massey, Princeton University, Princeton, NJ, and approved December 6, 2020 (received for review October
29, 2020)
This article reviews some key strands of demographic research on past trends in human longevity and
explores possible future trends in life expectancy at birth. Demographic data on age-specific mortality are
used to estimate life expectancy, and validated data on exceptional life spans are used to study the
maximum length of life. In the countries doing best each year, life expectancy started to increase around
1840 at a pace of almost 2.5 y per decade. This trend has continued until the present. Contrary to classical
evolutionary theories of senescence and contrary to the predictions of many experts, the frontier of
survival is advancing to higher ages. Furthermore, individual life spans are becoming more equal, reducing
inequalities, with octogenarians and nonagenarians accounting for most deaths in countries with the
highest life expectancy. If the current pace of progress in life expectancy continues, most children born
this millennium will celebrate their 100th birthday. Considerable uncertainty, however, clouds forecasts:
Life expectancy and maximum life span might increase very little if at all, or longevity might rise much
faster than in the past. Substantial progress has been made over the past three decades in deepening
understanding of how long humans have lived and how long they might live. The social, economic, health,
cultural, and political consequences of further increases in longevity are so significant that the develop-
ment of more powerful methods of forecasting is a priority.
| | |
forecasts life expectancy life span equality maximum life span mortality |
The Past and Present of Longevity without disease. Although a disease process may ap-
Fixed Frontier of Survival. How much can human life pear to be the cause of death, the actual cause is loss
span be extended? This is a top scientific question of the organism’s ability to maintain homeostasis” (ref.
today (1)—and has been a topic of great interest at 5, p. 131).
least since the exploits of Gilgamesh almost 5,000 y Throughout the 20th century, there were many
ago (2). Around 350 B.C., Aristotle provided a per- unsuccessful attempts at estimating the ultimate limit
suasive, pessimistic answer. He compared the “vital to human life expectancy; researchers and institutions
heat” of life to a fire that was burning down (3, 4). The such as the United Nations and the World Bank pro-
fire could be put out prematurely by throwing sand or vided estimates that were surpassed, often within a
water on it—which was analogous to death from an few years of publication (6). Even today, some scholars
epidemic or in war. Or the fire could die down still argue that life expectancy at birth is unlikely to
naturally—which was analogous to old-age mortality. ever exceed 85 y in any country (5, 7–9). A contro-
Premature mortality could be reduced, but the natural versial article from 2016 claimed evidence of a limit to
length of life could not be extended. This concept of a human life span at about 115 y of age (10, 11).
fixed frontier of survival was the dominant idea about One argument for a limit to human life span is that
longevity from 350 B.C. until recently. A highly cited evolution does not care about old age because older
article published in 1980 restated similar ideas to women are postreproductive and older men have few
Aristotle’s: “The inevitable result is natural death, even children. To some extent, older people help children
a
Danish Centre for Demographic Research, University of Southern Denmark, 5230 Odense, Denmark; bInterdisciplinary Center on Population
Dynamics, University of Southern Denmark, 5230 Odense, Denmark; and cDepartment of International Health, Bloomberg School of Public Health,
Johns Hopkins University, Baltimore, MD 21205
Author contributions: J.W.V. designed research; J.W.V., F.V., and M.-P.B.-B. performed research; J.W.V. and M.-P.B.-B. contributed new reagents/
analytic tools; F.V. and M.-P.B.-B. analyzed data; and J.W.V., F.V., and M.-P.B.-B. wrote the paper.
The authors declare no competing interest.
This article is a PNAS Direct Submission.
Downloaded by guest on November 12, 2021
This open access article is distributed under Creative Commons Attribution-NonCommercial-NoDerivatives License 4.0 (CC BY-NC-ND).
1
To whom correspondence may be addressed. Email: jvaupel@sdu.dk.
Published February 10, 2021.
PNAS 2021 Vol. 118 No. 9 e2019536118 https://doi.org/10.1073/pnas.2019536118 | 1 of 10France Japan Table 1. Current age (2017) and age of equivalent mortality
100 50 y ago (1967)
Equivalent age in 1967
95
Females Males
90
United United
85
Age France Japan Sweden States France Japan Sweden States
50 41 35 40 44 40 37 34 42
80 60 51 46 54 53 51 49 51 52
Age
Sweden USA 70 60 56 62 63 58 59 61 59
100
80 70 68 73 74 68 69 72 71
90 84 80 85 85 84 82 87 84
95
Mortality measured as the probability of death at a given age in 2017 and
90 compared with the age with the same probability of death in 1967 using data
from the HMD (26).
85
80 there were dramatic improvements (25). For Swedish women, the
1980 1990 2000 2010 1980 1990 2000 2010
Year risk of death at age 85 has been cut from about 17% in 1950 to 7%
in 2018 (26, 27). There was similar progress for men, and at ages
RMI
90 and 95 for both women and men (25–27).
−0.04 −0.02 0.00 0.02 0.04
This finding has been replicated for many countries (28, 29)
Fig. 1. Average rates of mortality improvement (RMI) in the and is supported by the most recent data from the HMD (26).
preceding 10 y at ages 80–100: French, Japanese, Swedish, and US Fig. 1 shows the average annual improvements in age-specific
females, 1980–2017. Calculations by method in ref. 29 using data
from the HMD (26). death rates in the preceding 10 y (29) for French, Japanese,
Swedish, and US females between ages 80 and 100. In Sweden,
progress in mortality is observed between ages 80 and 95, but not
survive and thereby contribute to maximizing the number of off- after, as previously shown (30, 31). However, reductions in death
spring (12), but this effect is small, especially over the long period rates (positive rates of mortality improvement) are observed in
of human evolution when few individuals reached age 70 (13). France and Japan at all ages in most years. In the United States,
Hence, we are not designed to live into advanced old age (8, 14). death rates increased around the year 2000, but decreased before
Evolutionary processes favor genetic variants and physiological the mid-1990s and since the mid-2000s, showing progress at
processes that enhance reproduction and survival at young ages. older ages in recent years. For US females, the risk of death at age
On the other hand, there is no strong evolutionary pressure against 85 decreased from 14% in 1950 to 7% in 2017. Similar progress
genetic variants or physiological processes that have deleterious was also observed at older ages (e.g., from 31 to 22% at age 95).
effects at older ages, especially if these genes or physiological Another example is provided by German unification: Before 1990,
processes have positive effects at younger ages. people in East Germany suffered higher death rates than people
W. D. Hamilton (15), in line with the work of Medawar (16), in West Germany. After unification, the East German disadvan-
Williams (17), and Kirkwood (18), captured this perspective by tage at ages above 65 rapidly disappeared (32). This quasi-
mathematical equations. He concluded that deterioration with experimental evidence demonstrates that even very old people
age was inevitable for all species and that only radical genetic can benefit from improved conditions (33).
changes could extend life spans. In particular, “after a few hun- The improvements in survival at older ages are due to a
dred years of draconian eugenic measures . . . the human lifespan postponement of mortality to older ages. That is, life spans have
might be stretched out just a little . . . say [to] 75 instead of . . . 70.” been extended, and mortality risks have shifted toward higher
Hence, he asserted that research on “extension of active life ages. A recent article on the “Advancing Front of Old-Age Human
seems to me comparable with the alchemists’ search . . . [and] Survival” cogently demonstrates this (34). Table 1 provides an il-
detracts both from unavoidable truth and from realistic social lustration. Note, for example, that in France the probability of
programs” (ref. 15, p. 91). Hamilton’s claim, however, that mor- death at age 70 in 2017 equals the probability of death at age 60
tality increases inexorably with age for all species has been proven for females and 58 for males half a century ago (26). On average,
wrong theoretically (19–23) and empirically (24). for the countries and ages shown in Table 1, over the past 50 y
mortality has been postponed by about a decade.
The Advancing Frontier of Survival. The idea of a fixed frontier The advancing frontier of survival is part of a larger life ex-
of survival is debated. Recent studies show progress in old age pectancy revolution (6). In 1840, Swedish women enjoyed the
survival, weakening the concept of fixed limit, or at least fore- world’s longest life expectancy at birth: 46 y. Over time the world
seeable limit. Until the 1990s, serviceable data on death rates record steadily increased, with different countries taking the lead.
after age 85 were not available, but since then reliable statistics For the last three decades, Japan has been the record holder.*
have been compiled for many countries and over many years,
which contributed to the building of the Human Mortality Data-
*Since 2013, females in Hong Kong have a higher life expectancy than females
base (HMD) (25, 26). Data for Sweden show that before 1950 there
Downloaded by guest on November 12, 2021
in Japan, according to data from HMD (26). However, as Hong Kong is not a
was little progress in reducing mortality for 85-y-old Swedes: country, the comparability of its life expectancy at the country level is
Aristotle was more or less right until then. However, afterward questionable.
2 of 10 | PNAS Vaupel et al.
https://doi.org/10.1073/pnas.2019536118 Demographic perspectives on the rise of longevitywas catching up with best practice, for French females born in
successive decades between the 1880s and the 1920s, life ex-
pectancy rose about 4 to 5 y each decade (26, 40), in contrast
to the almost 2.5 y per decade increase in best-practice life
expectancy (Fig. 2).
Studies of modern hunter-gatherers provide evidence about
the long-term history of human longevity. Various estimates in-
dicate a life expectancy at birth of less than 40 y for these pop-
ulations (41). Studies of parish data from England over the period
1600–1725 show similarly short life expectancies (42) as do the
data from Sweden between 1751 and the 1830s (26). Hence, it
can be concluded that human life expectancy before 1840 gen-
erally fell below 40, and in situations of famine, epidemic, or war,
the value could be much lower. The long-term history of human
life expectancy is a history of high, fluctuating mortality, until the
life expectancy revolution started around 1840, leading to life
expectancies today of more than 80 in many countries (6, 26).
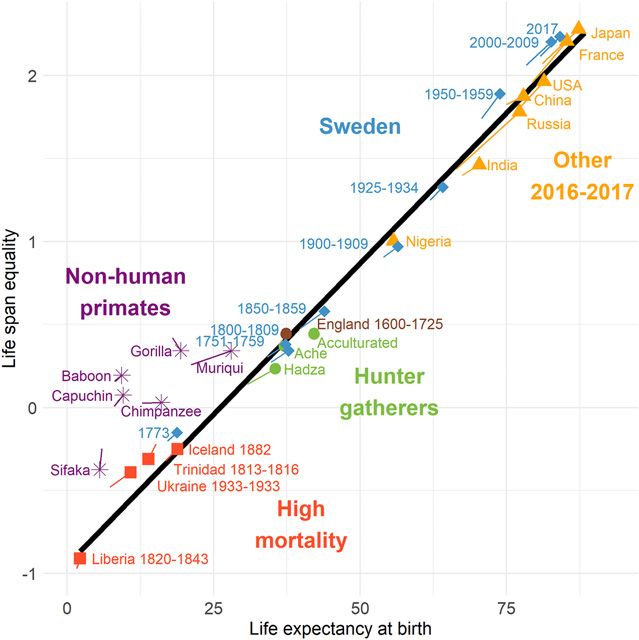
As life expectancy rose, life span equality—how similar life
spans are—increased in lockstep. Seminal analysis by Edwards
and Tuljapurkar (43) demonstrated the importance of studying life
span equality, which is an indicator of population health dispar-
ities and of individual life span uncertainty (44, 45). As life spans
Fig. 2. Best-practice life expectancy at birth, 1840–2017. Adapted became longer on average, they also became increasingly equal,
from ref. 6 using the most recent data from the HMD (26). In all cases, something that has been found to hold on a life span continuum
the values pertain to female life expectancy. Since 2013, Hong Kong over millions of years of primate evolution, in many countries and
females have a higher life expectancy than Japanese females in the
between subgroups in a population (46). Fig. 3 depicts this rela-
HMD, but Hong Kong is not a country.
tionship from historical to modern populations (e.g., Sweden over
time in blue); from high (in red) to low mortality regime (in yellow);
Life expectancy at birth for Japanese women in 2017 was more from hunter-gatherers (in green) to modern societies (in yellow);
than 87 y (26). As a result, from 46 in 1840 to 87 today, best- and even among nonhuman primates (in purple). Intriguingly,
practice life expectancy has almost doubled—rising at a remark- compared with the human populations with low life expectancy,
ably steady pace of almost two and a half years per decade, 3 mo
per year, 6 h per day. Fig. 2 shows the linear increase in the
maximum life expectancy based on the work of Oeppen and
Vaupel (6) and updated to the most recent data in HMD (26). Data
quality issues have been raised regarding some years and coun-
tries used in this graph, especially Norway, 1810–1960, and New
Zealand, 1876–1930. Using data from more sources and years and
after removing the problematic country-years, Vallin and Meslé
(35) provided a more nuanced look and found that the maximum
life expectancy followed a segmented trend, with a slope of 0.32
between 1885 and 1960 and 0.23 since 1960. The latter segment
is consistent with the slope observed in Fig. 2 since 1840, which
persists with the addition of the most recent data. Particular
countries followed more erratic trajectories than the straight-line
best-practice increase, as illustrated for French and US women in
Fig. 2. US life expectancy has stagnated in recent years, due to a
rise in premature mortality and “deaths of despair” below age 65,
including accidental poisoning, such as misuse of opioids and
fentanyl (36, 37). Still, at older ages, US mortality has been de-
clining in recent years (37), as shown in Fig. 1.
As Jonathan Swift observed, everyone wants to live long, but
no one wants to be old. As life expectancy rises, what is hap-
pening to health at older ages? Studies have shown mixed results
Fig. 3. The continuum of life expectancy at birth and life span
about whether the extra years of life are being lived in good health equality in human populations. Adapted from the original figure by
(38, 39) and no definite answer has been reached. Fernando Colchero in ref. 46 to more recent data in refs. 26 and 116.
If period life expectancy over time increases 3 mo per year, Life span equality is measured by the logarithm of the inverse of life
then life expectancy for people born in successive years increases table entropy (47–49) and defined as lnðeo =e† Þ, where eo is life
expectancy at birth, and e† is an indicator of life span disparity (46,
even more rapidly—because as a baby gets older, the person
Downloaded by guest on November 12, 2021
50). The lengths of the tadpoles represent the difference between
benefits from the progress being made over time (40). For in- females and males in the population, with the head being the females
stance, in part because of this effect and in part because France and the tale the males.
Vaupel et al. PNAS | 3 of 10
Demographic perspectives on the rise of longevity https://doi.org/10.1073/pnas.2019536118the nonhuman primates have higher levels of life span equality. observed plateaus at a level of about 50% per year of the annual
Life span equality is low when some individuals live much longer probability of death after age 105 in Italy (54) and after age 110 in
than average. This is the case for the human populations with low a group of countries (55, 56): If the mortality plateau exists, the
life expectancy: Some individuals live to 80. In contrast, few if any maximum life span will be determined by the number of people
of the nonhuman primates survived past age 50 (ref. 46, figure 1). reaching that plateau, which is likely to increase as more people
The relation between high life expectancy and life span attain advanced ages. Moreover, the analysis of exceptional life
equality is attributable to reductions in premature mortality. “The spans using extreme value theory does not support the existence
countries that have the highest life expectancy today are those of any limit (57).
which have been most successful at postponing the premature
deaths that contribute to early-life disparity” (ref. 44, p. 4). The The Future of Longevity
measure of life span equality used in Fig. 3 is based on the con- By projecting the historical pace of progress into the future, it is
cept of life table entropy, first developed by Leser (47) and further possible to estimate the age that at least 50% of babies born in
explored by Demetrius (48) and Keyfitz (49). Measures based on some country in some year will attain. Such forecasts can be found
the coefficient of variation or the Gini coefficient yield the same in the study by Christensen et al. (38) and show that most children
lockstep pattern, and the change in life expectancy from 1 y to the born in the last two decades in countries with high life expectancy
next closely tracks the annual change in life span equality (50). will, if past progress continues, celebrate their 100th birthday.
The increase in life expectancy in the countries doing best has Very long lives are the likely destiny of children alive today, pro-
also been accompanied by an increase in maximum life span—the vided life expectancy continues to increase at the historical pace
oldest age attained as verified by reliable data. Fig. 4 shows a of more than 2 y per decade. These forecasts depend, however,
roughly linear rise of maximum life span of about 1.5 mo (0.12 y) on substantial improvements being made in reducing death rates
per year, lower than the 3-mo per year increase in maximum life at high ages. An important question is whether such improve-
expectancy, but still remarkable. The unbroken record of Jeanne ments will happen.
Calment who died 122 y old in 1997 is interpreted by some as Among researchers who are willing to speculate about the
indicating that the limit to human life span has been reached. future of life expectancy, there are, broadly speaking, three views
Such an interpretation, however, is misleading. Between 1899 and (58): 1) Some argue that life expectancy will rise more slowly than
2014, the mean interrecord time was around 11.9 y, with three in the past, perhaps approaching a limit that is not much greater
records lasting for more than 20 y (including Calment’s) and the than the current best-practice level, with some chance that life
longest lasting record being a little over 52 y (51). A study by expectancy will fall (14); 2) others think that life expectancy will
Lenart et al. (52) estimates that there was only a 20% chance that continue to rise and mortality to decline at the historical pace
Calment’s record would have been broken between 1997 and for the next several decades, and perhaps longer (59, 60); 3)
2017. Using a different analytical strategy, Medford and Vaupel finally, some futurologists predict that life expectancy will rise
suggest that “there was a 75% chance of observing a new record substantially faster than this because of major biomedical
in the time since the last one so it is somewhat surprising that the breakthroughs (61).
record still holds. However, 20.7 y is still quite low when com- Most demographers, actuaries, and gerontologists appear to
pared to the most durable record, which lasted 52 y” (ref. 51, p. 6). think that the future will be somewhere between the first and
The data in Fig. 4 and ancillary data on exceptional life spans (53) second scenarios. Although some think that the second view is
do not support the claim that the maximum attainable life span more plausible, many support the first and a few are open to the
has been reached (10, 11). This claim is also inconsistent with third. Why is there such a wide range of forecasts among experts
on life expectancy?
It can be expected that the future of longevity will be different
from the past—but it is not known how different. Since 1840, the
country with the highest life expectancy has shifted from Sweden
to Japan, and a different country—perhaps Singapore or Spain
(62)—might become the leader in the future. The causes of death
against which progress has been made have shifted from infec-
tious to chronic diseases (63). Before 1950, the rise in life expec-
tancy was largely fueled by reductions in infant, child, and young
adult mortality. Today, the rise is largely attributable to declines in
death rates after age 65, and especially after age 80 when the
majority of deaths now occur in the most developed countries
(38, 64).
What kinds of mortality improvements might occur in the fu-
ture? Experts know a great deal about the past but have difficulty
foreseeing events in the future, especially the surprising kinds of
events that have occurred so often in the past but were unfore-
seen and even unforeseeable.
• More effective public health strategies might be devised (per-
Fig. 4. Linearly increasing age of the world’s oldest person. Adapted haps as a consequence of the COVID-19 pandemic) that could
from a figure by Jonas Schöley—inspired by a graph by Robert D.
improve health, e.g., by reducing the spread of infectious dis-
Downloaded by guest on November 12, 2021
Young (https://grg.org/sc/graphs/wop2.png)—using data from ref.
117. Additional studies of supercentenarians and the world´s oldest ease, controlling obesity and drug abuse, and slowing smoking
persons are found in ref. 53. initiation (65).
4 of 10 | PNAS Vaupel et al.
https://doi.org/10.1073/pnas.2019536118 Demographic perspectives on the rise of longevity• In the next decade or two, substantial progress might be made as the asymptote was approached. However, there is evidence
in reducing the incidence of cancer and in treating it. Various that this strategy has consistently produced forecasts that are too
diseases, including cancer, multiple sclerosis, and HIV, might low (6, 60, 74). Despite repeated failure, many mortality experts
be treated by enhanced immune therapies (66). continue to use their judgments to make forecasts. Judgments
• There is evidence that over recent decades dementia has been and scenarios used to forecast fertility, migration, and national
postponed by roughly 2 to 4 y per decade (67), and this trend and global population sizes have also often been wrong. Booth
might continue. argues that “[b]oth the patent inability of demographers to fore-
• The new initiative of “precision medicine” aims to develop al- see demographic change and the rigidity of the scenario-based
ternative treatments that are optimal for people with various approach contributed to the assertion that traditional population
genetic makeups (68). Such therapies might substantially re- projections are merely ‘what-if’ illustrations” (ref. 75, p. 550).
duce mortality. Furthermore, recent breakthroughs in A cogent argument can be made that the first step in making a
CRISPR technology might lead to strategies for replacing longevity forecast should be to extrapolate historical data. “Al-
deleterious genes a person might have with variants that though imperfect, the appeal of extrapolation lies in the long-
decrease disease risks. term stability of the historical mortality decline, which can be at-
• Extensive research on reconstructing or regenerating tissues tributed to the complex character of the underlying process. This
and organs, such as reconstructing skin or regenerating heart combination of stability and complexity should discourage us
tissue damaged by a heart attack, might lead to better treat- from believing that singular interventions or barriers will sub-
ment and perhaps, in several decades, even to strategies for stantially alter the course of mortality decline in the future” (ref.
rejuvenating tissues and organs. 76, p. 397).
• Research on nanotechnology might eventually lead to the de- The future may be turbulent but so was the past. Consider the
velopment of new tools for the manipulation of submicroscopic 20th century, marked by two world wars, the Spanish flu, the as-
particles to repair damage or to destroy pathogens or cancer- cent and retreat of fascism and communism, the great depression,
ous cells (69, 70). or the AIDS epidemic, all tragic events that did not undermine the
• Most significantly, but perhaps less likely, research on the basic increasing trend in life expectancy (Fig. 2). With the novel COVID-
biology of aging might lead to interventions that slow down the 19 illness, for instance, new scenarios may arise, but it is still un-
rate of aging (71). For example, breakthroughs might be certain how the pandemic will affect longevity in the future: Al-
achieved such that it would take 2 y for a person to suffer the though it may have a short-term impact on life expectancy similar
deterioration that older people currently experience in 1 y: that to the Spanish flu in 1918, its effects could be small or even
is, roughly speaking, it would take 2 y to grow 1 y older. positive in the longer term thanks to behavioral and policy
changes. Health improvements in the future may be slowed by
On the other hand, it is not difficult to imagine developments
deleterious trends (obesity), but health improvements in the past
that would slow or even reverse the rise of life expectancy. Eco-
were also slowed by deleterious trends (the rise of cigarette
nomic growth in the future might be slower than in the past. There
smoking). The future may bring biomedical breakthroughs in
might be less money available for the prevention and treatment of
preventing and treating cancer, dementia, and perhaps senes-
disease. Because of slower economic growth and because of
cence; the past was also marked by remarkable advances in re-
competing needs—such as the cost of pensions—the resources
ducing mortality from infectious and cardiovascular diseases.
available for biomedical research might decline. New diseases
Change in life expectancy is a complicated function of change
worse than AIDS might emerge. Wars might break out. An in-
in age-specific mortality (77). The number of deaths at some age
creasing epidemic of obesity, or other behavioral risk factors (e.g., and time depends on each death—and each death results from a
overdose), might severely damage health (36, 72). The biomedical complicated mix of many factors—proximate, contributing, and
breakthroughs adumbrated above might not occur. It might not underlying causes including the lingering legacies of past be-
be possible to reduce mortality after age 100. haviors, exposures, and biomedical advances (78). Influences on
This last risk is perhaps the most significant (73). As noted mortality include economic, social, and political conditions, ge-
earlier, progress in increasing life expectancy since 1950 has netics, events in utero and early childhood, educational levels,
resulted from a postponement of mortality, such that 70- and diet, smoking and other aspects of personal behavior, epidemics,
80-y-olds have the mortality risk of people a decade younger half public health interventions, the quality of health care, the devel-
a century ago (Table 1). There is evidence that the pace of opment of more effective pharmaceutical products, improve-
progress in reducing death rates for nonagenarians is accelerating ments in medical treatments and surgical procedures, and
(Fig. 1). There appears, however, to be little change in death rates revolutionary biomedical breakthroughs (79–81). Using changes
after age 100. Perhaps improvements among centenarians will in risk factors and economic and epidemiological trends to help
become more apparent as people reach age 100 in better states make forecasts is appealing, but difficult as their future values and
of health because of progress at younger ages. It is also possible, their immediate and delayed relationships with mortality and with
however, that it will not be feasible to substantially reduce cen- each other are often imperfectly understood, making their use in
tenarian mortality. If so, life expectancy will not rise to 100. forecasting problematic (60). Simple extrapolative approaches of
past trends have generally been more compelling, given the
The Present and Future of Forecasting Longevity historical regularities (60, 76, 82). Reasons why the future might be
Until recently, most forecasts of life expectancy were based on a better or worse than the past or more uncertain can be consid-
judgment about its ultimate limit, which was assumed to be not ered, but adjustments should be made with caution.
much higher than current best-practice life expectancy (6, 40).
Values of life expectancy from the present into the future were Extrapolative Methods to Forecast Life Expectancy. Extrapo-
Downloaded by guest on November 12, 2021
interpolated between present life expectancy and the assumed lative methods are often being used to forecast life expectancy
limit, with faster increases in the near future and slowing increases based on historical data on age-specific death rates. Alho (83) and
Vaupel et al. PNAS | 5 of 10
Demographic perspectives on the rise of longevity https://doi.org/10.1073/pnas.2019536118Lee and Carter (84) played key roles in developing such methods, France Japan
which have three major advantages: 1) They extrapolate empirical 102.8
data that often show long-term regularities; 2) they are more 100
97.2
objective; and 3) they produce probability distributions of future
life expectancy rather than simple point estimates. The method 91.7 91.3
90
5.5 11.4
suggested by Lee and Carter in 1992 (84) is the most commonly
known, and an array of somewhat similar approaches has been
80
developed (60, 85–88). These methods generally assume that the
Life expectancy at birth
age-specific pace of decline in death rates will persist into the
future, sometimes with some modest acceleration. Because death 70
rates at advanced ages have declined at a slower pace than death Sweden USA
rates at younger ages, the methods generally yield what most
experts believe, namely that life expectancy will rise more slowly 100
in the future. 95.9
94.1
Alternative models have been suggested to forecast mortality. 90 89.4
Methods similar to Lee and Carter’s (84), but using the age dis- 6.5 85.7
tributions of deaths rather than death rates, reduce forecast bias 8.4
by allowing the pace of mortality decline to accelerate over time 80
(89). A direct approach is to forecast life expectancy by extrapo-
lating historical data on life expectancy (6). Some pioneering re- 70
search has been done on this approach that takes advantage of 1965 2017 2070 1965 2017 2070
the remarkable regularity of time trends in best-practice life ex- Year
pectancy (59, 90). If best-practice life expectancy is forecast line- Lee−Carter CoDA−coherent Official
arly, then the gap between it and life expectancy for a given Li−Lee e0 extrapolation Best practice
population can be forecast using data on gaps in the past. Age- CoDA Double−gap
specific death rates can be forecast by exploiting the strong re-
Fig. 5. Female life expectancy at birth, historical levels, and forecasts
lationship between life expectancy and the pattern of age-specific 2018–2070, with lowest and highest value in 2070 and their
mortality (91, 92). difference indicated. The linear trend in best-practice life expectancy
This use of the best-practice life expectancy in forecasting is is shown as a dashed line. The best-practice estimates for 2018–2070
are extrapolations of the 1840–2017 linear trend. Forecasts for the
part of a broader approach that recognizes that mortality trajec-
period 2018–2070 with time-series data for 1960–2017 from the
tories are not independent between populations. Methods have HMD (26). Forecasts and prediction intervals (Table 2) are computed
been developed to integrate this coherence between populations using six models (84, 85, 89, 90) or extracted from official national
in the forecasts (85, 89, 90), generally assuming that population- forecast (96–99).
specific life expectancies are converging toward an average or
toward best practice.
In addition, Fig. 5 shows the official national forecasts for each
It is important to note that extrapolative approaches are not
selected country (96–99). The methods and assumptions between
assumption-free. Each model is based on specific assumptions
country vary (100). For example, Japan’s official forecast is based
about future mortality, e.g., constant rate of improvement, con-
on a Lee–Carter model combined with a model that shifts mor-
vergence toward a benchmark, etc. These models are also often tality curves to advanced ages, using a fitting period from 1970
sensitive to different factors or choices made by the forecasters, (rather than from 1960 as in our forecasts), to reflect the changes in
such as the length of the fitting period, the indicator used, or mortality that gradually slowed down in recent years (98). Sweden
if a coherent model is used, to the choice of the reference also uses a variant of the Lee–Carter model for their forecasts (97).
populations (93–95). The official forecasts for France are based on a mixture of expert
Fig. 5 shows forecasts of life expectancy for females in France, opinions and extrapolation (99). For the United States, ultimate
Japan, Sweden, and the United States up until 2070, using six average annual percentage reductions in death rates are assumed
extrapolative methods: 1) the Lee–Carter approach (84) and 2) its by age groups and causes of death. Starting from annual reduc-
coherent version based on the work of Li and Lee assuming that tions in central death rates observed in recent years, these annual
population-specific trends are converging toward an average (85); reductions transition rapidly toward the ultimate annual percent-
3) forecasts based on the extrapolation of death distributions (a age reductions assumed by 2043 (96). The official forecasts are
method known as CoDA) and 4) its coherent version assuming that generally lower (except for France) than the extrapolative ap-
population-specific trends are converging toward an average (89); proaches presented in Fig. 5, either because of assumptions or
5) direct extrapolation of life expectancy at birth and 6) its co- judgements, or the use of a fitting period yielding slower mortality
herent version forecasting the gap between the best-practice improvements.
and the population-specific trends (known as the “double-gap” The life expectancy value and 95% prediction intervals (or
method) (90).† high–low variants for official forecasts) in 2050 and 2070 are
shown in Table 2 for both sexes. The calculation of credible pre-
diction intervals is necessary to assess the uncertainty around the
†
The model is slightly different from that of Pascariu et al. (90) as a drift term is point estimates. The future is uncertain and so are the forecasts.
not used in the autoregressive integrated moving average (ARIMA) model to
Prediction intervals measure the precision of a forecast and how
Downloaded by guest on November 12, 2021
forecast the gap between the best-practice and population-specific trends.
This approach was chosen to prevent population-specific trends from indefi- rapidly this precision decreases in the more distant future (101).
nitely diverging from the best practice. The 95% prediction intervals in Table 2 widen over time and
6 of 10 | PNAS Vaupel et al.
https://doi.org/10.1073/pnas.2019536118 Demographic perspectives on the rise of longevityTable 2. Forecasts of life expectancy at birth with prediction intervals, 2050 and 2070
Lee–Carter Li–Lee CoDA CoDA-coherent eo extrapol. Double gap Official forecast
Females
France
2050 89.6 (88.2, 91.0) 89.8 (88.1, 91.1) 92.6 (91.4, 93.8) 92.2 (91.1, 93.4) 92.5 (88.3, 96.6) 92.8 (90.1, 95.6) 90.3 (88.3, 93.0)
2070 91.7 (89.9, 93.2) 92.0 (90.2, 93.3) 95.7 (94.4, 96.8) 95.2 (94.0, 96.5) 96.9 (91.5, 102.3) 97.2 (93.7, 100.3) 93.0 (90.0, 96.0)
Japan
2050 93.8 (90.7, 95.9) 91.1 (88.2, 93.2) 97.3 (94.8, 99.4) 94.0 (91.2, 97.7) 96.9 (87.3, 106.8) 92.9 (90.2, 95.8) 90.4 (89.4, 91.4)
2070 96.6 (93.8, 98.6) 92.9 (90.0, 95.3) 100.6 (98.5, 102.3) 96.7 (93.2, 100.4) 102.8 (90.5, 115.4) 96.3 (92.8, 99.5) 91.3* (90.2, 92.5)
Sweden
2050 87.9 (85.7, 89.7) 89.3 (88.0, 90.6) 89.3 (87.9, 90.8) 90.6 (89.8, 91.7) 89.4 (86.2, 92.4) 91.4 (89.7, 93.3) 87.5 NA
2070 89.7 (87.3, 91.6) 91.5 (90.2, 92.9) 92.0 (90.4, 93.4) 93.7 (92.4, 95.3) 92.6 (88.7, 96.4) 95.9 (93.6, 98.1) 89.4 NA
United States
2050 84.9 (83.6, 86.0) 87.4 (85.2, 89.2) 86.4 (84.5, 88.6) 90.0 (87.6, 92.5) 86.2 (79.8, 92.2) 88.7 (86.7, 90.5) 84.2 (82.7, 85.9)
2070 86.8 (85.2, 88.1) 90.3 (87.9, 92.1) 89.4 (86.9, 92.3) 94.1 (91.6, 96.5) 89.2 (80.9, 97.0) 93.1 (90.7, 95.4) 85.7 (83.6, 88.0)
Males
France
2050 84.4 (82.5, 86.1) 84.6 (82.8,86.1) 87.8 (86.6, 89.2) 87.2 (85.9, 89.0) 87.2 (82.6, 92.3) 88.1 (83.4, 93.7) 86.8 (84.5, 89.5)
2070 86.9 (84.8, 88.8) 87.1 (85.2, 88.8) 91.8 (90.5, 93.1) 91.0 (89.2,92.8) 92.0 (86.2, 98.7) 92.6 (86.4, 99.2) 90.1 (87.1, 93.1)
Japan
2050 87.3 (85.0, 89.4) 85.6 (83.7,87.3) 91.2 (88.5, 94.2) 88.3 (85.9, 92.9) 89.6 (80.4, 99.3) 87.8 (82.8, 92.9) 84.0 (83.0, 85.0)
2070 90.2 (87.9, 92.2) 87.9 (85.7, 89.6) 95.4 (92.4, 97.8) 91.7 (88.0, 96.8) 94.7 (83.2, 107.2) 91.2 (84.1, 97.7) 85.0* (83.8, 86.1)
Sweden
2050 84.8 (81.5, 87.5) 85.3 (83.9,86.0) 85.6 (84.8, 86.4) 87.1 (86.7, 87.6) 86.7 (80.5, 93.7) 88.7 (83.5, 94.2) 85.2 NA
2070 86.8 (82.9, 89.5) 87.6 (86.0, 89.1) 88.3 (87.6, 89.1) 90.3 (89.6, 91.4) 90.3 (82.7, 98.9) 93.1 (86.3, 100.3) 87.2 NA
United States
2050 80.9 (79.0, 82.6) 82.8 (80.2, 83.4) 82.8 (80.9, 84.5) 85.7 (84.1, 87.5) 83.0 (78.1, 87.8) 84.5 (79.2, 89.4) 80.1 (78.2, 82.2)
2070 83.4 (81.0, 85.2) 86.0 (83.4, 88.1) 86.7 (84.1, 89.0) 90.5 (88.7, 92.5) 87.1 (80.6, 93.2) 89.2 (82.0, 95.2) 82.0 (79.3, 84.7)
Forecasts for the period in 2050 and 2070 with time-series data for 1960–2017 from the HMD (26). Forecasts and prediction intervals are computed using six
models (84, 85, 89, 90) or extracted from official national forecast (96–99). For the life expectancy extrapolation, the double-gap model, and the official forecasts, the
age-specific death rates are derived with methods from ref. 92.
*The official population forecast for Japan ends in 2065.
overlap. The methods produce different forecasts and prediction • How can cohort effects be incorporated in longevity forecasts
intervals. The range of forecast values reflects the uncertainty (104, 105)?
about future life expectancy trends. • Extensive data over age, time, population, and sex are avail-
Prediction intervals are generally calculated based on fitting able on proximate, underlying, and contributing causes of
errors. A model, however, that fits the data well is not the same as death. A wealth of information is also available on various as-
a model that predicts well. The fit of a model can always be im- pects of individuals’ health over age and time. How can this
proved with additional parameters. Instead of using fitting errors, information be used to improve mortality forecasts?
historical forecast errors can be used. The forecaster choses a date • As mortality patterns are explained by different behavioral, ep-
in the past, forecasts from it to a date in the more recent past, and idemiological, and biological factors, better ways to integrate
compares the forecast with what actually happened to evaluate morbidity and biology into mortality models should
the model’s accuracy and to calculate prediction intervals be explored.
(102, 103). • Extreme value theory could be used to study patterns and
The best performing model varies across populations and time trends of survival among the pioneers on the advancing frontier
periods, making model selection problematic. Assessing whether of survival—those older than 100 or 110 (57, 106).
progress in mortality at older ages, when most deaths occur, will • Populations are heterogeneous. The frail tend to die first. This
stay constant or will accelerate is of crucial importance in selecting is related to tempo effects on mortality (107). Some innovative
the appropriate forecast model. The models, including the na- research suggests that it might be feasible to model heteroge-
tional forecasts, produce very different forecasts at high ages. For neity in forecasting models (108).
example, the lowest death rate forecast by 2070 for the age group • How can information on life span equality be integrated to im-
90–99 is between 1.7 (United States) and 4.7 (Japan) times lower prove or evaluate forecasts (109)?
than the highest forecast. Note that the linear best-practice life • More research is necessary to improve methods for estimating
expectancy trend from 1840 to 2017 rises close to 100 by 2070. the uncertainty around population forecasts. The 95% predic-
tion interval should capture the true value of life expectancy
Some Future Directions in Longevity Forecasting. Other strat- 95% of the time. This can be checked by using data over some
egies than those presented in Fig. 5 and Table 2 exist or could be interval in the past to forecast life expectancy at some subse-
developed. Directions for research include the following options quent time in the past. If this is done repeatedly, with different
for better exploiting empirical data about trends in the past. intervals and perhaps different populations, then x% of the
Downloaded by guest on November 12, 2021
• The causes of the linear rise in best-practice life expectancy forecasts should fall into the estimated x% prediction interval—
since 1840 are not well understood. and 100 − x% should fall outside.
Vaupel et al. PNAS | 7 of 10
Demographic perspectives on the rise of longevity https://doi.org/10.1073/pnas.2019536118• Forecasts are used to estimate future needs and assess poli- probability and timing of research advances that result, say, in
cies, e.g., estimate future pension costs. More research should interventions that slow the rate of aging (115).
be done on analyzing the impact of forecast errors on these The ongoing and unprecedented rise of longevity over the
estimates and to develop better ways to communicate the im- past two centuries is so remarkable that the future of longevity
pact of uncertainty (101).
may be similarly rich in unexpected developments (13). The future
• Other methods for mortality forecasting are also being devel-
will almost certainly be surprising, but it might be possible to
oped, including microsimulation (110) and Bayesian population
projections (111, 112). Bayesian approaches have gained inter- anticipate some general trends. The social, economic, health,
est in the last decade, in part thanks to the Bayesian probabi- cultural, and political consequences of further increases in lon-
listic projections adopted by the United Nations since the 2012 gevity are of such significance that the development of more
revision of the World Populations Prospects (113, 114). powerful methods of forecasting is a priority.
In addition to the development of more powerful strategies for
Data Availability. Code, data, and readme file have been depos-
exploiting empirical data on past health and mortality trends, re-
ited in Github (https://github.com/panchoVG/RiseOfLongevity-
search is also needed on how to take better advantage of the
knowledge of experts. As noted above, experts have been PNAS2021).
abysmally poor at assessing limits to human life expectancy. It
might, however, be possible to make structured use of expert Acknowledgments
We thank Erwin Tan, Jesús-Adrián Alvarez, Annette Baudisch, Kaare Christen-
judgments to develop forecasts based on alternative scenarios sen, Fernando Colchero, Ilya Kashnitsky, Marius Pascariu, and Jonas Schöley for
about future economic, political, and social conditions. Further- input. This research was supported by the AXA Research Fund, AARP, and the
more, experts might provide useful information about the National Institute on Aging at NIH (Grant P01 AG031719).
1 J. Couzin, How much can human life span be extended? Science 309, 83 (2005).
2 A. R. George, The Epic of Gilgamesh: The Babylonian Epic Poem and Other Texts in Akkadian and Sumerian (Penguin, London, 2002).
3 Aristotle, “On length and shortness of life” in The Complete Works of Aristotle: The Revised Oxford Translation, J. Barnes, Ed. (Princeton University Press,
Princeton, 1984), vol. 1, pp. 740–744.
4 Aristotle, “On youth, old age, life and death, and respiration” in The Complete Works of Aristotle: The Revised Oxford Translation, J. Barnes, Ed. (Princeton
University Press, Princeton, 1984), vol. 1, pp. 745–763.
5 J. F. Fries, Aging, natural death, and the compression of morbidity. N. Engl. J. Med. 303, 130–135 (1980).
6 J. Oeppen, J. W. Vaupel, Demography. Broken limits to life expectancy. Science 296, 1029–1031 (2002).
7 S. J. Olshansky, B. A. Carnes, C. Cassel, In search of Methuselah: Estimating the upper limits to human longevity. Science 250, 634–640 (1990).
8 B. A. Carnes, S. J. Olshansky, A realist view of aging, mortality, and future longevity. Popul. Dev. Rev. 33, 367–381 (2007).
9 S. J. Olshansky, B. A. Carnes, Inconvenient truths about human longevity. J. Gerontol. A Biol. Sci. Med. Sci. 74, S7–S12 (2019).
10 X. Dong, B. Milholland, J. Vijg, Evidence for a limit to human lifespan. Nature 538, 257–259 (2016).
11 A. Lenart, J. W. Vaupel, Questionable evidence for a limit to human lifespan. Nature 546, E13–E14 (2017).
12 K. Hawkes, Grandmothers and the evolution of human longevity. Am. J. Hum. Biol. 15, 380–400 (2003).
13 J. W. Vaupel, Biodemography of human ageing. Nature 464, 536–542 (2010).
14 S. J. Olshansky, B. A. Carnes, A. Désesquelles, Prospects for human longevity. Science 291, 1491–1492 (2001).
15 W. D. Hamilton, “Live now, pay later: The moulding of senescence by natural selection” in Narrow Roads of Gene Land, W. D. Hamilton, Ed. (Freeman, New
York, 1996), vol. 1, chap. 3, pp. 85–128.
16 P. B. Medawar, An Unsolved Problem of Biology (Lewis, London, 1952).
17 G. C. Williams, Pleiotropy, natural selection, and the evolution of senescence. Evolution 11, 398–411 (1957).
18 T. B. Kirkwood, Evolution of ageing. Nature 270, 301–304 (1977).
19 J. W. Vaupel, A. Baudisch, M. Dölling, D. A. Roach, J. Gampe, The case for negative senescence. Theor. Popul. Biol. 65, 339–351 (2004).
20 A. Baudisch, Hamilton’s indicators of the force of selection. Proc. Natl. Acad. Sci. U.S.A. 102, 8263–8268 (2005).
21 A. Baudisch, Inevitable Aging? Contributions to Evolutionary-Demographic Theory (Springer, Berlin, 2008).
22 A. Baudisch, J. W. Vaupel, Evolution. Getting to the root of aging. Science 338, 618–619 (2012).
23 K. W. Wachter, S. N. Evans, D. Steinsaltz, The age-specific force of natural selection and biodemographic walls of death. Proc. Natl. Acad. Sci. U.S.A. 110,
10141–10146 (2013).
24 O. R. Jones, A. Scheuerlein et al., Diversity of ageing across the tree of life. Nature 505, 169–173 (2014).
25 J. W. Vaupel, H. Lundstrom, “Longer life expectancy? Evidence from Sweden of reductions in mortality rates at advanced ages” in Studies in the Economics of
Aging, D. A. Wise, Ed. (University of Chicago Press, Chicago, 1994), pp. 79–102.
26 University of California, Berkeley; Max Planck Institute for Demographic Research, Rostock, Human Mortality Database (HMD). https://www.mortality.org/.
Accessed 27 March 2020.
27 Statisics Sweden, Statistical database. http://www.statistikdatabasen.scb.se/pxweb/en/ssd/. Accessed 23 February 2020.
28 V. Kannisto, J. Lauritsen, A. R. Thatcher, J. W. Vaupel, Reductions in mortality at advanced ages: Several decades of evidence from 27 countries. Popul. Dev. Rev.
20, 793–810 (1994).
29 R. Rau, E. Soroko, D. Jasilionis, J. W. Vaupel, Continued reductions in mortality at advanced ages. Popul. Dev. Rev. 34, 747–768 (2008).
30 A. Medford, K. Christensen, A. Skytthe, J. W. Vaupel, A cohort comparison of lifespan after age 100 in Denmark and Sweden: Are only the oldest getting older?
Demography 56, 665–677 (2019).
31 K. Modig, T. Andersson, J. Vaupel, R. Rau, A. Ahlbom, How long do centenarians survive? Life expectancy and maximum lifespan. J. Intern. Med. 282, 156–163
(2017).
32 J. W. Vaupel, J. R. Carey, K. Christensen, It’s never too late. Science 301, 1679–1681 (2003).
33 T. C. Vogt, F. A. Kluge, Can public spending reduce mortality disparities? Findings from East Germany after reunification. J. Econ. Ageing 5, 7–13 (2015).
34 W. Zuo, S. Jiang, Z. Guo, M. W. Feldman, S. Tuljapurkar, Advancing front of old-age human survival. Proc. Natl. Acad. Sci. U.S.A. 115, 11209–11214 (2018).
35 J. Vallin, F. Meslé, The segmented trend line of highest life expectancies. Popul. Dev. Rev. 35, 159–187 (2009).
36 J. Y. Ho, A. S. Hendi, Recent trends in life expectancy across high income countries: Retrospective observational study. BMJ 362, k2562 (2018).
Downloaded by guest on November 12, 2021
37 E. M. Stein, K. P. Gennuso, D. C. Ugboaja, P. L. Remington, The epidemic of despair among white Americans: Trends in the leading causes of premature death,
1999–2015. Am. J. Public Health 107, 1541–1547 (2017).
8 of 10 | PNAS Vaupel et al.
https://doi.org/10.1073/pnas.2019536118 Demographic perspectives on the rise of longevity38 K. Christensen, G. Doblhammer, R. Rau, J. W. Vaupel, Ageing populations: The challenges ahead. Lancet 374, 1196–1208 (2009).
39 H. Beltrán-Sánchez, S. Soneji, E. M. Crimmins, Past, present, and future of healthy life expectancy. Cold Spring Harb. Perspect. Med. 5, a025957 (2015).
40 V. M. Shkolnikov, D. A. Jdanov, E. M. Andreev, J. W. Vaupel, Steep increase in best-practice cohort life expectancy. Popul. Dev. Rev. 37, 419–434 (2011).
41 M. Gurven, H. Kaplan, Longevity among hunter-gatherers: A cross-cultural examination. Popul. Dev. Rev. 33, 321–365 (2007).
42 E. A. Wrigley, R. S. Davies, J. Oeppen, R. Schofield, English Population History from Family Reconstitution 1580–1837 (Cambridge University Press, Cambridge,
UK, 1997).
43 R. D. Edwards, S. Tuljapurkar, Inequality in life spans and a new perspective on mortality convergence across industrialized countries. Popul. Dev. Rev. 31,
645–674 (2005).
44 J. W. Vaupel, Z. Zhang, A. A. van Raalte, Life expectancy and disparity: An international comparison of life table data. BMJ Open 1, e000128 (2011).
45 A. A. van Raalte, I. Sasson, P. Martikainen, The case for monitoring life-span inequality. Science 362, 1002–1004 (2018).
46 F. Colchero et al., The emergence of longevous populations. Proc. Natl. Acad. Sci. U.S.A. 113, E7681–E7690 (2016).
47 C. E. V. Leser, Variations in mortality and life expectation. Population Studies 9, 67–71 (1955).
48 L. Demetrius, Demographic parameters and natural selection. Proc. Natl. Acad. Sci. U.S.A. 71, 4645–4647 (1974).
49 N. Keyfitz, Applied Mathematical Demography (Wiley, New York, 1977).
50 J. M. Aburto, F. Villavicencio, U. Basellini, S. Kjærgaard, J. W. Vaupel, Dynamics of life expectancy and life span equality. Proc. Natl. Acad. Sci. U.S.A. 117,
5250–5259 (2020).
51 A. Medford, J. W. Vaupel, Human lifespan records are not remarkable but their durations are. PLoS One 14, e0212345 (2019).
52 A. Lenart, J. M. Aburto, A. Stockmarr, J. W. Vaupel, “The human longevity record may hold for decades: Jeanne Calment’s extraordinary record is not evidence
for an upper limit to human lifespan” in Exceptional Lifespans, H. Maier, B. Jeune, J. W. Vaupel, Eds. (Springer, Cham, Switzerland, 2021), pp. 49–55.
53 H. Maier, B. Jeune, J. W. Vaupel, Eds., Exceptional Lifespans (Springer, Cham, Switzerland, 2021).
54 E. Barbi, F. Lagona, M. Marsili, J. W. Vaupel, K. W. Wachter, The plateau of human mortality: Demography of longevity pioneers. Science 360, 1459–1461 (2018).
55 J. Gampe, “Human mortality beyond age 110” in Supercentenarians, H. Maier, J. Gampe, B. Jeune, J.-M. Robine, J. W. Vaupel, Eds. (Springer, Berlin, 2010), pp.
219–230.
56 J. Gampe, “Mortality of supercentenarians: Estimates from the updated IDL” in Exceptional Lifespans, H. Maier, B. Jeune, J. W. Vaupel, Eds. (Springer, Cham,
Switzerland, 2021), chap. 3, pp. 29–35.
57 H. Rootzén, D. Zholud, Human life is unlimited—but short. Extremes 20, 713–728 (2017).
58 K. G. Manton, E. Stallard, H. D. Tolley, Limits to human life expectancy: Evidence, prospects, and implications. Popul. Dev. Rev. 17, 603–637 (1991).
59 T. Torri, J. W. Vaupel, Forecasting life expectancy in an international context. Int. J. Forecast. 28, 519–531 (2012).
60 H. Booth, L. Tickle, Mortality modelling and forecasting: A review of methods. Annals of Actuarial Science 3, 3–43 (2008).
61 A. De Grey, M. Rae, Ending Aging: The Rejuvenation Breakthroughs That Could Reverse Human Aging in Our Lifetime (St. Martin’s Press, London, 2007).
62 K. J. Foreman et al., Forecasting life expectancy, years of life lost, and all-cause and cause-specific mortality for 250 causes of death: Reference and alternative
scenarios for 2016–40 for 195 countries and territories. Lancet 392, 2052–2090 (2018).
63 A. R. Omran, The epidemiologic transition: A theory of the epidemiology of population change. 1971. Milbank Q. 83, 731–757 (2005).
64 F. Meslé, J. Vallin, Transition sanitaire: Tendances et perspectives. Med. Sci. (Paris) 16, 1161–1171 (2000).
65 J. P. Pierce, V. M. White, S. L. Emery, What public health strategies are needed to reduce smoking initiation? Tob. Control 21, 258–264 (2012).
66 K. Naran, T. Nundalall, S. Chetty, S. Barth, Principles of immunotherapy: Implications for treatment strategies in cancer and infectious diseases. Front. Microbiol.
9, 3158 (2018).
67 E. Stallard, Update on the LTC morbidity improvement study. Long Term Care News 36, 23–27 (2014).
68 G. R. Gameiro, V. Sinkunas, G. R. Liguori, J. O. C. Auler-Júnior, Precision medicine: Changing the way we think about healthcare. Clinics (S~ ao Paulo) 73, e723
(2018).
69 C. L. Ventola, The nanomedicine revolution: Part 1: Emerging concepts. P&T 37, 512–525 (2012).
70 C. L. Ventola, The nanomedicine revolution: Part 2: Current and future clinical applications. P&T 37, 582–591 (2012).
71 B. K. Kennedy et al., Geroscience: Linking aging to chronic disease. Cell 159, 709–713 (2014).
72 S. J. Olshansky et al., A potential decline in life expectancy in the United States in the 21st century. N. Engl. J. Med. 352, 1138–1145 (2005).
73 S. Horiuchi, J. R. Wilmoth, Deceleration in the age pattern of mortality at older ages. Demography 35, 391–412 (1998).
74 J. M. Alho, B. D. Spencer, Error models for official mortality forecasts. J. Am. Stat. Assoc. 85, 609–616 (1990).
75 H. Booth, Demographic forecasting: 1980 to 2005 in review. Int. J. Forecast. 22, 547–581 (2006).
76 J. R. Wilmoth, The future of human longevity: A demographer’s perspective. Science 280, 395–397 (1998).
77 T. F. Wrycza, A. Baudisch, How life expectancy varies with perturbations in age-specific mortality. Demogr. Res. 27, 365–376 (2012).
78 M. Wensink, R. G. Westendorp, A. Baudisch, The causal pie model: An epidemiological method applied to evolutionary biology and ecology. Ecol. Evol. 4,
1924–1930 (2014).
79 S. H. Preston, The changing relation between mortality and level of economic development. Popul. Stud. (Camb.) 29, 231–248 (1975).
80 S. H. Preston, The changing relation between mortality and level of economic development. Population Studies, Vol. 29, No. 2, July 1975. Int. J. Epidemiol. 36,
484–490 (2007).
81 K. Christensen, J. W. Vaupel, Determinants of longevity: Genetic, environmental and medical factors. J. Intern. Med. 240, 333–341 (1996).
82 J. R. Wilmoth, Demography of longevity: Past, present, and future trends. Exp. Gerontol. 35, 1111–1129 (2000).
83 J. M. Alho, Stochastic methods in population forecasting. Int. J. Forecast. 6, 521–530 (1990).
84 R. D. Lee, L. R. Carter, Modeling and forecasting US mortality. J. Am. Stat. Assoc. 87, 659–671 (1992).
85 N. Li, R. Lee, Coherent mortality forecasts for a group of populations: An extension of the Lee-Carter method. Demography 42, 575–594 (2005).
86 H. Booth, R. J. Hyndman, L. Tickle, P. De Jong, Lee-Carter mortality forecasting: A multi-country comparison of variants and extensions. Demogr. Res. 15,
289–310 (2006).
87 R. Lee, T. Miller, Evaluating the performance of the Lee-Carter method for forecasting mortality. Demography 38, 537–549 (2001).
88 T. Bengtsson, N. Keilman, Eds., Old and New Perspectives on Mortality Forecasting (Springer, Cham, Switzerland, 2019).
89 M.-P. Bergeron-Boucher, V. Canudas-Romo, J. Oeppen, J. W. Vaupel, Coherent forecasts of mortality with compositional data analysis. Demogr. Res. 37,
527–566 (2017).
90 M. D. Pascariu, V. Canudas-Romo, J. W. Vaupel, The double-gap life expectancy forecasting model. Insur. Math. Econ. 78, 339–350 (2018).
91 H. Ševčı́ková, N. Li, V. Kantorová, P. Gerland, A. E. Raftery, “Age-specific mortality and fertility rates for probabilistic population projections” in Dynamic
Demographic Analysis, R. Schoen, Ed. (Springer, 2016), pp. 285–310.
92 M. D. Pascariu, “Modelling and forecasting mortality,” PhD thesis, University of Southern Denmark, Odense (2018).
93 M.-P. Bergeron-Boucher, S. Kjærgaard, J. Oeppen, J. W. Vaupel, The impact of the choice of life table statistics when forecasting mortality. Demogr. Res. 41,
1235–1268 (2019).
94 F. Janssen, A. Kunst, The choice among past trends as a basis for the prediction of future trends in old-age mortality. Popul. Stud. (Camb.) 61, 315–326 (2007).
M.-P. Bergeron-Boucher et al., “Alternative forecasts of Danish life expectancy” in Developments in Demographic Forecasting, N. Neilman, S. Mazzuco, Eds.
Downloaded by guest on November 12, 2021
95
(The Springer Series on Demographic Methods and Population Analysis, Springer, 2020), vol. 49, chap. 7, pp. 131-151.
Vaupel et al. PNAS | 9 of 10
Demographic perspectives on the rise of longevity https://doi.org/10.1073/pnas.2019536118You can also read