Ontogenetic Change in Skull Morphology and Mechanical Advantage in the Spotted Hyena (Crocuta crocuta)
←
→
Page content transcription
If your browser does not render page correctly, please read the page content below
JOURNAL OF MORPHOLOGY 271:353–365 (2010)

Ontogenetic Change in Skull Morphology and
Mechanical Advantage in the Spotted Hyena
(Crocuta crocuta)
Jaime B. Tanner,1,2* Miriam L. Zelditch,3 Barbara L. Lundrigan,1,4 and Kay E. Holekamp1,4
1
  Department of Zoology, Michigan State University, East Lansing, Michigan 48824
2
  Organismic and Evolutionary Biology Program, University of Massachusetts, Amherst, Massachusetts 01003
3
  Museum of Paleontology, University of Michigan, Ann Arbor, Michigan 48109
4
  Michigan State University Museum, Michigan State University, East Lansing, Michigan 48824

ABSTRACT Weaning represents a challenging transi-           weanling mammals may be still immature at the
tion for young mammals, one particularly difficult for       time of nutritional independence (Wainwright and
species coping with extreme conditions during feeding.      Reilly, 1994; Monteiro et al., 1999; Herrel and
Spotted hyenas (Crocuta crocuta) experience such            Gibb, 2006). For carnivorous mammals, the func-
extreme conditions imposed by intense feeding competi-
                                                            tional challenges associated with weaning may be
tion during which the ability to consume large quanti-
ties of food quickly is highly advantageous. As adult       especially demanding because these animals usu-
spotted hyenas have massive skulls specialized for dur-     ally feed on uncooperative and unpredictable prey,
ophagy and can feed very rapidly, young individuals are     and they must often also cope with fierce competi-
likely at a competitive disadvantage until that special-    tors. Newly weaned individuals should be handi-
ized morphology is completely developed. Here we docu-      capped compared to adults due to their smaller
ment developmental changes in skull size, shape, and        size and inexperience, and therefore selection is
mechanical advantage of the jaws. Sampling an ontoge-       expected to minimize the length of this transition
netic series of Crocuta skulls from individuals ranging     period by favoring the individuals who achieve
in age from 2 months to 18 years, we use linear meas-       adult feeding performance maxima at the youngest
urements and geometric morphometrics to test hypothe-
                                                            ages. However, the period of morphological devel-
ses suggesting that size, limited mechanical advantage
of the jaws, and/or limited attachment sites for jaw        opment often determines how early in life animals
muscles might constrain the feeding performance of          can achieve performance maxima (Carrier, 1996).
juveniles. We also examine skull development in relation    Therefore, trade-offs might be expected between
to key life history events, including weaning and repro-    the time required during ontogeny to develop a
ductive maturity, to inquire whether ontogeny of the        feeding apparatus with adult capabilities on the
feeding apparatus is slower or more protracted in this      one hand, and the functional capabilities of adult
species than in carnivores not specialized for durophagy.   morphology on the other. Such trade-offs may be
We find that, although mechanical advantage reaches          especially pronounced in species that possess
maturity in hyenas at 22 months, adult skull size is not    highly specialized morphology, or face particularly
achieved until 29 months of age, and skull shape does
                                                            challenging feeding environments.
not reach maturity until 35 months. The latter is nearly
2 years after mean weaning age, and more than 1 year           Ecomorphologists often approach questions
after reproductive maturity. Thus, skull development in     about performance limits by studying the func-
Crocuta is indeed protracted relative to that in most       tional capacities of organisms that live in extreme
other carnivores. Based on the skull features that con-     environments (Wainwright, 1994). Spotted hyenas
tinue to change and to provide additional muscle attach-
ment area, protracted development may be largely due          Contract grant sponsor: National Science Foundation; Contract
to development of the massive musculature required by       grant numbers: IBN 0113170, IBN 0343381, IOB 0618022, IOS
durophagy. These findings may ultimately shed light on       0819437; Contract grant sponsor: The American Society of Mam-
the adaptive significance of the unusual ‘‘role-reversed’’   malogists.
pattern of female dominance over males in this species.
J. Morphol. 271:353–365, 2010. Ó 2009 Wiley-Liss, Inc.        *Correspondence to: Jaime B. Tanner, Darwin Fellow, Organismic
                                                            and Evolutionary Biology Program, University of Massachusetts,
                                                            319 Morrill S, Amherst, MA 01003-9297.
KEY WORDS: ontogeny;       geometric   morphometrics;       E-mail: jtanner@bio.umass.edu
growth curves; mechanical advantage; jaw morphology
                                                            Received 21 May 2009; Revised 15 July 2009;
                                                            Accepted 12 August 2009
INTRODUCTION
                                                            Published online 27 October 2009 in
   The ability to obtain and process food is essen-         Wiley InterScience (www.interscience.wiley.com)
tial for survival, but the functional abilities of          DOI: 10.1002/jmor.10802

Ó 2009 WILEY-LISS, INC.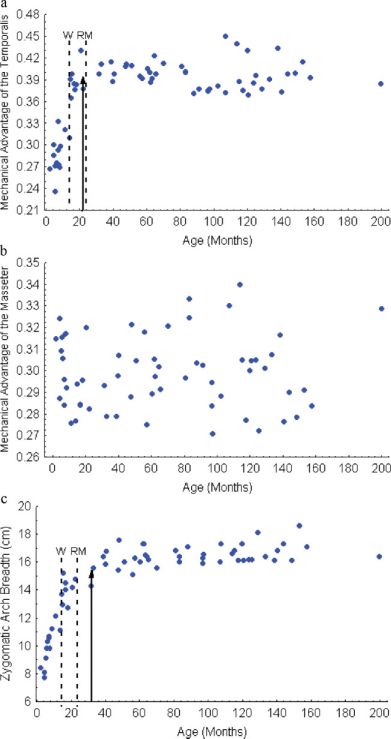
354                                         J.B. TANNER ET AL.
(Crocuta crocuta) must simultaneously cope with        to many other gregarious carnivores, little or no
two types of extreme conditions during feeding.        provisioning of young by adults occurs among spot-
First, adult spotted hyenas have a highly duropha-     ted hyenas (Holekamp and Smale, 1990; Mills,
gous diet that involves cracking and consumption       1990). Therefore, without maternal assistance dur-
of large bones. Second, the intense feeding compe-     ing feeding competition, individual feeding success
tition characteristic of spotted hyenas represents     after weaning in this species is likely to be directly
an extreme environment in which individuals            limited by morphology. However, to date, a com-
must be able to consume large quantities of food       prehensive analysis of ontogenetic change in the
very quickly. Because food-intake affects growth       feeding apparatus has not been undertaken in any
and limits reproductive success in this species        hyaenid.
(Frank et al., 1995; Hofer and East, 1996; Hole-          Small changes in morphology can have profound
kamp et al., 1996), feeding performance should         effects on an animal’s functional capabilities
have profound effects on juvenile survival. Fur-       (Koehl, 1996). Feeding speed increases rapidly
thermore, mortality is high among juvenile spotted     during the early life of the spotted hyena, but does
hyenas, with less than half of all cubs surviving to   not plateau until well after reproductive maturity
adulthood (Frank et al., 1995; Watts, 2007). There-    (Binder and Van Valkenburgh, 2000; Tanner, 2007;
fore, selection should favor rapid achievement of      Watts et al., 2009). Earlier workers proposed that
feeding performance maxima among juvenile hye-         feeding speed among juvenile mammals is con-
nas after weaning. However, past studies have          strained by their relatively small size, their weak
suggested that juvenile spotted hyenas feed far        chewing muscles, and poor mechanical advantage
more slowly than adults, even long after weaning       of their jaws (Biknevicius, 1996; Binder and Van
(Biknevicius, 1996; Binder, 1998; Binder and Van       Valkenburgh, 2000). Here, we collect morphological
Valkenburgh, 2000; Watts et al., 2009).                data from an ontogenetic series of skulls of known-
   Adult spotted hyenas are capable of very rapid      age spotted hyenas to test hypotheses suggesting
feeding and can consume over 1.3 kg of meat and        specifically that feeding speed in youngsters may
bone per minute (Kruuk, 1972). The skull of an         be constrained by skull size, skull shape, and/or
adult spotted hyena is highly modified to satisfy       mechanical advantage of the jaw adductor
the performance demands of bone cracking. Like         muscles. We also compare patterns of morphologi-
other bone-cracking members of the Hyaenidae, as       cal change in the skull before and after weaning.
well as extinct percrocutids and borophagine can-      Finally, we consider skull development in relation
ids, adult spotted hyenas possess a number of mor-     to key life history events in this and other carni-
phological characteristics that enhance their abil-    vore species to inquire whether the ontogeny of
ity to generate and sustain bite forces of great       the feeding apparatus is slow or protracted in spot-
magnitude. These adaptations for durophagy             ted hyenas when compared with carnivores not
include a robust and simplified dentition, large jaw    specialized for durophagy.
adductor muscles, a pronounced sagittal crest, a
vaulted forehead, wide bi-zygomatic arch breadth,
increased cortical thickness of the dentary bone,
and large body size (Van Valkenburgh, 2007). Fur-      MATERIALS AND METHODS
thermore, all extant bone-cracking hyaenids have       Samples
an unusually long lactation period relative to other      We sampled an ontogenetic series of 68 Crocuta crocuta
carnivores, lasting over 1 year and extending to 24    skulls, comprised of individuals ranging in age from 2 months
months in some cases (Kruuk, 1972; Mills, 1990;        to 18 years, housed at the Michigan State University Museum
Holekamp et al., 1996; Wagner, 2006; Watts et al.,     (Fig. 1, Table 1). Most originated from a study population of
                                                       spotted hyenas monitored since 1979 (Frank, 1986) in the
2009). This suggests that ontogenetic development      Masai Mara National Reserve in southwestern Kenya, but the
of the specialized morphology of bone-cracking         youngest specimen, a two-month-old, was obtained from a cap-
forms might require more time than in other spe-       tive colony of spotted hyenas at UC Berkeley. For 37 of the
cies, and thus end late relative to key life history   specimens, including all subadults and cubs, age at death was
                                                       known to 67 days because these individuals were born into the
milestones.                                            study population, and their birth dates could thus be estimated
   In contrast to most other carnivores, including     based on the appearance of cubs when first observed above
all other extant bone-cracking hyaenids, spotted       ground (Holekamp et al., 1996). For all other individuals, we
hyenas are highly gregarious. The size of their        estimated age to 66 months, based on canine height and occlu-
social groups, called clans, can exceed 80 individu-   sal wear on the surface of the third lower premolar, as
                                                       described by Van Horn et al. (2003). Mean age at weaning in
als (Kruuk, 1972). Each clan is structured by a lin-   the source population was 14 months, with a range of 7.5–24
ear dominance hierarchy, with social rank of each      months (Holekamp et al., 1996). The cause of death was known
individual determining its priority of access to       for 73% of the specimens used in the study either from direct
food. The challenges posed by weaning in spotted       observations or from characteristics of each carcass at the time
                                                       of collection. Of all deaths of known causes, 88% were killed ei-
hyenas may thus be exacerbated not only by dur-        ther by lions or by humans (usually speared by local villagers
ophagy but also by intense feeding competition         or roadkill). Only one individual was known to have died from
with conspecifics. It is noteworthy that, in contrast   starvation as a cub after its mother had died. Thus our sample

Journal of Morphology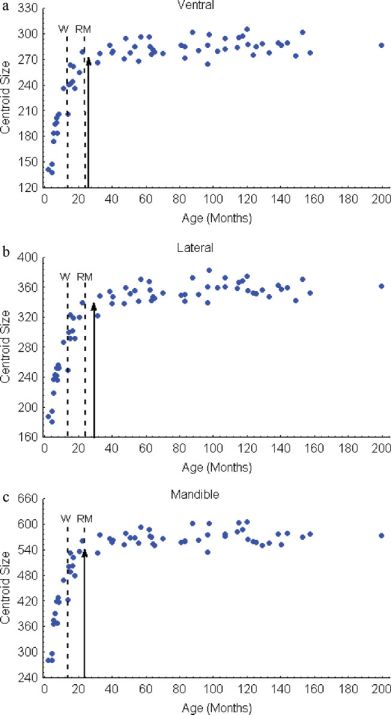
SKULL DEVELOPMENT IN SPOTTED HYENAS                                                          355

                   Fig. 1. Photographs of Crocuta skulls illustrating changes in size and shape throughout de-
                 velopment (a) frontal view (from left to right) at 3 months, 20 months, and 11 years of age, and
                 (b) lateral view at 3 months (left) and 11 years.

was not biased toward individuals that failed to thrive, as mor-    days by the same observer (JBT) and data for each individual
tality was unrelated to skull form.                                 were averaged. For the ventral view, bilaterally homologous
                                                                    coordinates were also reflected across the midline (specified by
                                                                    a baseline extending from landmark 1 to landmark 7, Fig. 2),
Ontogenetic Shape Change                                            and averaged, because the coordinates were not independent of
                                                                    each other.
   To quantify changes in skull form, we used 2D landmark-            Landmarks were superimposed to remove variation in scale,
based geometric morphometrics. We analyzed three views of the       position, and orientation by a generalized least-squares Pro-
skull: the ventral cranium, lateral cranium, and lateral mandi-     crustes superimposition (Rohlf and Slice, 1990). An additional
ble (landmarks are shown in Fig. 2 and described in Table 2).       nuisance parameter must be removed when superimposing
Images of the cranium in ventral view were obtained by orient-      semi-landmarks because their spacing is biologically arbitrary;
ing specimens with the palate parallel to the photographic          superimposition of semi-landmarks was done by estimating the
plane. Images of the lateral cranium were obtained by orienting     tangent to the curve for each semi-landmark, then sliding it
the skull with the sagittal plane parallel to the photographic      towards the normal of this tangent, minimizing the Procrustes
plane, and those of the lateral view of the mandible were           distance from the mean shape. Currently, there are two main
obtained by orienting the long axis of the dentary parallel to      methods for sliding semi-landmarks: the first minimizes the
the photographic plane. Because cranial sutures are completely      bending-energy of the thin-plate spline (Green 1996; Bookstein
fused in adult hyenas (Schweikher, 1930) and because there are      1997; Gunz et al., 2005) and the second minimizes the Pro-
few landmarks on the mandible, semi-landmarks were included         crustes distance from the mean shape (Sampson et al., 1996;
in our analyses of the lateral cranium and mandible (Fig. 2 and     Andresen et al., 2000; Bookstein et al., 2002). We used the sec-
Table 2). In lateral view, semi-landmarks were positioned at the    ond because the Procrustes distance is the metric underlying
intersection of the curving perimeter of the skull and equiangu-    the general theory of shape. According to this method, the tan-
lar rays of a circle, defined by three landmarks (6, 11, 13), with   gent to the curve at each semi-landmark is estimated. Then
the rays extending from landmark 11. These rays were calcu-         each semi-landmark is slid toward the normal of its respective
lated using MakeFan (Sheets, 2003) and the semi-landmarks           tangent, minimizing the overall difference from the reference.
along with the landmarks were digitized using tpsDig 2.10           Following superimposition, the coordinates of semi-landmarks
(Rohlf, 2005). On the mandible, evenly spaced points were digi-     can be used in any conventional shape analysis, provided that
tized along the outline between base landmarks (1 and 10, 5         statistical tests take into account that they have only one
and parallel to 11, 6 and 7, 8 and 9, and 9 and 12) using tpsDig    degree of freedom. Superimposition of semi-landmarks was
2.10. Each photograph was digitized three times on separate         done in SemiLand (Sheets, 2003).

                                                                                                         Journal of Morphology
356 J.B. TANNER ET AL.
TABLE 1. List of Michigan State University Museum skull shape for each given size to produce a bootstrap replica of
specimens used in this study the original data set. Two ontogenetic vectors are derived
from a pair of these bootstrap sets, and the angle between
Catalog Catalog them is calculated. Should the observed angle between phases
number Age (mos) number Age (mos) exceed the 95% confidence interval of the two within-phase
ranges, the difference is judged statistically significant. As
36093 2.00 36558 57.19 sample sizes here varied for different ages, the analysis was
36089 4.37 35857 61.83 carried out in terms of the distribution of bootstrapped data
36088 4.40 36074 62.40 sets at comparable sample sizes.
36087 5.13 36550 63.13
36166 5.47 36168 64.39
36579 6.13 36553 65.27
36086 7.00 36160 70.04 Mechanical Advantage and Muscle Size
36159 7.00 36570 80.87
36157 7.20 36163 82.97 One method traditionally used to assess feeding ability in
36075 7.23 36079 83.09 mammals is to model the jaw as a lever and then calculate
36155 7.53 36569 87.80 mechanical advantage of the feeding apparatus (Radinsky,
36085 8.00 36009 91.22 1981; Greaves, 1983; 1985; Thomason, 1991; Smith, 1993).
35863 8.57 35854 96.57 Using this approach, relative bite force can be inferred by
35861 10.00 35853 96.71 estimating both the mechanical advantage of the primary
36010 11.13 36165 97.40
36549 13.80 36161 102.50
36090 14.37 35856 107.00
36578 15.00 37464 107.17
36167 15.27 37465 113.98
36162 16.73 36083 115.20
36081 16.87 36551 117.50
36577 18.00 37466 119.85
37463 20.53 36566 120.65
35859 22.23 36580 123.65
36576 31.60 36084 125.23
36556 32.93 36008 128.87
36156 38.58 35852 133.16
36082 39.85 36094 138.36
36164 40.35 36552 140.35
35858 47.33 36011 143.83
36581 47.97 36080 148.58
36567 50.83 36571 153.00
36568 53.47 36078 157.53
35855 55.90 36077 199.73
To analyze ontogenetic change in shape, we regressed shape
on age using the log-transform of age because most shape
change occurs early in ontogeny. We tested the statistical sig-
nificance of the relationship between shape and age using a
generalized Goodall’s F test (Rohlf, 2005), which measures the
ratio of explained to unexplained variation in units of Pro-
crustes distance. As well as analyzing the relationship
between shape and age over the entire life span, we subdi-
vided our sample into two life-history phases, pre- and post-
weaning, to determine whether changes in skull shape before
and after weaning might be functionally important. For each
phase, linear regressions were performed on the subgroups of
skulls either older or younger than 14 months of age, gener-
ating vectors describing ontogenetic trajectories for each life
history stage. We then determined whether those ontogenetic
trajectories differ. When the trajectories point in the same
direction, the angle between them is 0.0 degrees, so to deter-
mine whether the difference between the vectors is statisti-
cally significant, we tested the null hypothesis that the
observed angle could have been produced by two independent
samplings of a single ontogenetic phase. That was done by
estimating the distribution of angles that could be obtained
from repeated sampling of the ontogeny of a single popula-
tion. The expected shape at each size is estimated from the
multivariate regression equation and residuals are calculated
for each individual; each specimen thus yields a multidimen-
sional set of residuals representing its deviation from the Fig. 2. Landmarks digitized in each view used in the study,
expected shape for its size. The complete set of residuals is (*) indicates a semi-landmark in the lateral cranium or mandi-
bootstrapped as a single unit, thus preserving the covariance ble view. Bilaterally homologous landmarks in the ventral view
structure among variables. The set of residuals (drawn at were reflected and averaged for analyses. See Table 2 for land-
random with replacement) is added to the expected value of mark descriptions.
Journal of MorphologySKULL DEVELOPMENT IN SPOTTED HYENAS 357
TABLE 2. Description of landmarks and the in-lever of the masseter as the distance from the
mandibular condyle to the middle of the ventral masseteric
Ventral landmarks depression. The out-levers for both the temporalis and masseter
1 Juncture between incisors on the premaxilla were measured as the distance from the mandibular condyle to
2, 3 Premaxilla-maxilla suture where it intersects the bite point. The third lower premolar was used as the bite
the medial edge of the canine point in this study because that is the main tooth used for bone
4, 5 Posterior-most point of the incisive foramen cracking in this species (Van Valkenburgh, 1988; Werdelin,
6 Posterior-most premaxilla-maxilla suture on the palate 1989). Zygomatic arch breadth at the widest point on the skull
7 Anterior-most point on the foramen magnum was used to estimate jaw adductor size.
8, 9 Palatal foramen
10 Maxilla-palatine midline suture
11 Midline suture between the left and right palatine Age at Maturity
12, 13 Maxilla-palatine suture on the posterior
edge of the palate To determine the age at which skull size, shape, mechanical
14, 15 Medial edge of the maxilla-jugal suture advantage, and zygomatic arch breadth reach maturity, we
16, 17 Lateral edge of the jugal-squamosal suture used nonlinear growth models. Several models were fitted to
18, 19 Anterior lateral edge of the glenoid fossa the data and assessed for their relative goodness-of-fit using the
20, 21 Medial edge of the glenoid process Aikaike Information Criterion (AIC). For all the measures
22, 23 Medial edge of the jugular foramen obtained here (size, shape, mechanical advantage, and zygo-
24, 25 Anterior edge of the external auditory meatus matic arch breadth), the model having the highest AIC weight
26, 27 Lateral and anterior edge of the basisphenoid was the monomolecular model (following Gaillard et al., 1997):
Lateral landmarks
1 Anterior point of the I3 xðtÞ ¼ Af1 expKðt0 tÞ g
2 Anterior point of the canine
3 Posterior point of the canine where x(t) is the measurement of interest at time t, A is the as-
4 Anterior point on the infraorbital foramen ymptotic adult value, K is the rate of approach to adult value,
5 Upper-most point of the lacrimal foramen and t0 is the age at which growth begins (Gaillard et al., 1997;
6 Tip of the post-orbital process Zelditch et al., 2003). We report age at maturity as the esti-
7 Upper edge of the jugal-squamosal suture mated age at which the variable reaches 95% of its asymptotic
8 Ventral edge of the jugal–squamosal suture value. Data for individuals above the 95% breakpoint were sub-
9 Posterior edge of the premaxilla-jugal suture sequently regressed on age a second time to ensure that age
10 Poster-most point of the pterygoid had no further significant impact on the measurement of inter-
11 Upper-most point on the external auditory meatus est. Evaluation of growth models and estimation of parameters
12 Upper-most point on the occipital condyle were done using GrowChoice (Sheets, 2003).
13 Posterior point on the nuchal crest
14 Anterior-most point on the nasal-premaxilla suture
15–19 Semi-landmark (*)
Mandible landmarks
1 Anterior point on I4
2 Anterior point on the canine
3 Posterior edge of the canine
4 Upper edge of the mental foramen
5 Dorsal apex of the curve on the coronoid process
6 Posterior edge of the coronoid process
7 Anterior edge of the mandibular condyle
8 Posterior edge of the mandibular condyle
9 Dorsal tip of the articular process
10 Posterior edge of the mandibular symphysis
11 Dorsal edge of the masseteric fossa
12 Ventral apex of the curve of the dentary
13–39 Semi-landmark (*)
*Indicated as (*) in Figure 2.
masticatory muscles (the temporalis and masseter) and the
size of those muscles (Radinsky, 1981; Hildebrand, 1984;
Binder, 1998). Adductor muscle size is traditionally estimated
by the maximal width across the zygomatic arches; the in-le-
ver arm length is measured as the distance separating muscle
insertion points and the jaw joint, and the out-lever (moment
arm of resistance) is measured by the distance from the jaw
joint to the bite point on the mandible (Radinsky, 1981; Gittle-
man and Van Valkenburgh, 1997; Binder, 1998). Over ontog-
eny, as the lengths of temporalis and masseteric lever arms
increase relative to the length of the resistance arm, mechani-
cal advantage increases (Hurov et al., 1988; Gittleman and Fig. 3. Deformation grid showing ontogenetic changes from
Van Valkenburgh, 1997). a linear regression of shape on log(age) in the ventral view. The
Following Radinsky (1981), mechanical advantage was calcu- landmarks have been back reflected for ease of interpretation.
lated here as the in-lever divided by the out-lever, with the Vectors show the direction and magnitude of change from the
in-lever of the temporalis measured as the distance from the youngest to the oldest specimens after centroid size is scaled to
dorsal tip of the coronoid process to the mandibular condyle, the same size for each specimen.
Journal of Morphology358 J.B. TANNER ET AL.
posterodorsal expansion of nuchal and occipital
crests. Ontogenetic change in the mandible is also
statistically significant (Goodall’s F74,4440 5 30.656,
P < 0.01); the dominant features here are the rela-
tive expansion of the angular process and a
marked anterodorsal reorientation of the coronoid
process, resulting in a more vertical orientation of
this process in adults than in juveniles (see
Fig. 5).
The trajectories of pre- and post-weaning ontoge-
nies of cranial shape differ significantly from one
another for both ventral and lateral views; the
angle between pre- and post-weaning phases (89.18
for ventral; 118.58 for lateral) is much larger than
the angles within each phase (49.28, 56.98 for ven-
tral; 24.58, 37.88 for lateral). Before weaning,
change in ventral view is characterized primarily
by relative lengthening of the zygomatic arches
and palate along the anteroposterior axis and nar-
Fig. 4. Deformation grid showing ontogenetic changes from rowing of the basicranium (Goodall’s F28,364 5
a linear regression of shape on log(age) in the lateral view. Vec- 5.76, P < 0.01, Fig. 6a). After weaning, the zygo-
tors show the direction and magnitude of change from the
youngest to the oldest specimens after centroid size is scaled to
matic arches continue to lengthen along the ante-
the same size for each specimen. roposterior axis; there is a marked increase in rel-
ative bi-zygomatic arch breadth, as well as a slight
relative lengthening of the medial palate (Goodall’s
As a measure of skull size, we used centroid size, the square F28,1428 5 9.44, P < 0.01, Fig. 6b). In lateral view,
root of the summed squared distances from each landmark to
the geometric center of the object (Bookstein, 1996; Zelditch
over the pre-weaning phase, the braincase
et al., 2004). As a measure of the maturity of skull shape, we becomes much less bulbous, and there is an
used the Procrustes distance between a specimen and the aver- increase in the length of the rostrum relative to
age for the youngest age class (Zelditch et al., 2003); this dis- other skull dimensions (Goodall’s F34,442 5 16.98,
tance is approximately the square root of the summed square P < 0.01, Fig. 7a). After weaning, the dominant
distances between homologous landmarks. We used this proce-
dure to quantify the rate of shape maturation because more changes are the relative lengthening of the zygo-
conventional methods require that species (or ontogenetic matic arches along the anteroposterior axis and
phases) have the identical trajectory for shape (e.g., Alberch development of the sagittal and nuchal crests
et al., 1979) or else subdivide the inherently multidimensional (Goodall’s F34,1734 5 15.03, P < 0.01, Fig. 7b).
data of shape into a collection of one-dimensional parameters
that are analyzed one at a time (McKinney and McNamara,
1991). Our approach is based upon a suggestion made by Gould
(1977), namely to measure the rate of change in shape by the
distance traveled along a species-specific trajectory of shape.
Although a large Procrustes distance between an individual
and the average juvenile shape could mean that the individual
is oddly shaped rather than mature, there were no major out-
liers in our sample.
RESULTS
Change in Shape throughout Ontogeny
Statistically significant and visually dramatic
ontogenetic changes in ventral skull shape occur
between 2 months and 18 years of age (Goodall’s
F28,1764 5 41.23, P < 0.01, Fig. 3). Ontogenetic
change in ventral shape is dominated by a relative
increase in bi-zygomatic arch breadth and length-
ening of the zygomatic arches along the anteropos-
terior axis. Ontogenetic change in lateral shape is
also statistically significant (Goodall’s F34,2142 5
33.042, P < 0.01). This view (see Fig. 4) similarly Fig. 5. Deformation grid showing ontogenetic changes from
a linear regression of shape on log(age) in the lateral view of
captures the relative lengthening of the zygomatic the mandible. Vectors show the direction and magnitude of
arches along the anteroposterior axis. In addition, change from the youngest to the oldest specimens after centroid
the cranial profile appears to flatten owing to the size is scaled to the same size for each specimen.
Journal of MorphologySKULL DEVELOPMENT IN SPOTTED HYENAS 359
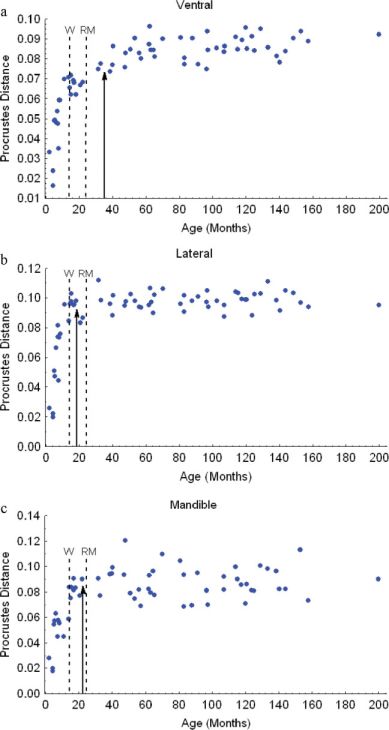
continues to increase until 33 months of age
(Fig. 10c).
Skull Maturity in Relation to Life History
Milestones
Data documenting age at full skull maturity are
available for only six carnivore species other than
the spotted hyena (Table 3). Most of these studies
used traditional linear morphometric measure-
ments rather than geometric morphometrics. They
suggest considerable variation in the relative tim-
ing of reproductive maturity and skull maturity.
Of the seven species, the spotted hyena, male po-
lar bear (sometimes), and brown bear exhibit the
most protracted skull development, with adult
morphology not achieved until well after reproduc-
tive maturity.
DISCUSSION
Patterns of Skull Development
Skull size, skull shape, and mechanical advant-
age of the temporalis muscles change dramatically
as spotted hyenas mature. A summary timeline of
these changes, shown in relation to both chrono-
logical age and life history milestones, is presented
in Figure 11. Although age at maturity for skull
size and shape varies among the three views (ven-
tral, lateral, and mandible), we indicate for each
only the age at maturity for the view that matures
Fig. 6. Deformation grids showing ontogenetic change from latest. It is notable that all the skull parameters
a linear regression of shape on log(age) in the ventral view; (a)
from 2 months until weaning (14 months), and (b) from wean- analyzed here reach maturity well after weaning.
ing until 18 years.
Age at Maturity
Skull size reaches 95% of its asymptotic value
around the time of reproductive maturity or
shortly thereafter in the ventral, lateral, and man-
dible views (26, 29, and 24 months, respectively;
Fig. 8). For skull shape, change is initially rapid in
all three views, but the rate diminishes more grad-
ually in ventral than in the other views (see Fig.
9). Lateral view shape reaches 95% of its asymp-
totic value by 18 months, the mandible by 23
months, but the ventral skull not until 35 months
of age.
Mechanical Advantage and Muscle Size
Mechanical advantage of the temporalis
(Fig. 10a) increases rapidly before leveling off at
22 months of age, shortly before reproductive ma-
turity. In contrast, there is no clear pattern of
Fig. 7. Deformation grids showing ontogenetic change from
ontogenetic change in mechanical advantage of the a linear regression of shape on log(age) in the lateral view; (a)
masseter (Fig. 10b). Change in zygomatic arch from 2 months until weaning (14 months), and (b) from wean-
breadth, reflecting the size of the jaw musculature, ing until 18 years.
Journal of Morphology360 J.B. TANNER ET AL.
surprising given that changes in lateral shape af-
ter 18 months are clearly apparent on visual
inspection, particularly in the region of the sagittal
crest. This apparent contradiction may be due to
distortion caused by projecting a 3D image onto a
2D photographic plane. In ventral view, cranial
shape does not reach 95% of the asymptotic value
until 35 months, and the features that dominate
ontogenetic change are both associated with masti-
catory musculature: bi-zygomatic arch breadth and
length of the zygomatic arches along the antero-
posterior axis.
Fig. 8. Growth curves for skull centroid size for the (a) ven-
tral, (b) lateral cranium, and (c) lateral mandible view. Arrows
indicate 95% of asymptotic values based on the monomolecular
equation. Dotted lines indicate the average ages at weaning (W)
and reproductive maturity (RM). [Color figure can be viewed
in the online issue, which is available at www.interscience.
wiley.com.]
Furthermore, although rates of change in centroid
size, Procrustes distance, and linear skull meas-
urements all slow after puberty, most continue to
change even after hyenas are reproductively
mature. Not surprisingly, we found that mandible
size, mandible shape, and mechanical advantage of
the temporalis muscle reach maturity in close tem-
poral association, at 24, 23, and 22 months of age,
respectively; this is later than maturity of cranial Fig. 9. Growth curves for skull shape (procrustes distance)
for the (a) ventral, (b) lateral cranium, and (c) lateral mandible
shape in lateral view, which reaches 95% of its as- view. Other symbols are as in Fig. 8. [Color figure can be
ymptotic value by 18 months. The relatively early viewed in the online issue, which is available at www.interscience.
termination of shape change in the lateral view is wiley.com.]
Journal of MorphologySKULL DEVELOPMENT IN SPOTTED HYENAS 361
Before cubs become nutritionally independent of
their mothers, the most pronounced shape
changes involve relative lengthening of the ros-
trum and reshaping of the cranium to produce a
less bulbous profile. The lengthening of the ros-
trum and palate likely reflect tooth eruption and
the acquisition of adult dentition that occurs
before weaning. After weaning, shape change is
most pronounced in regions of the skull associ-
ated with adductor muscle mass and area of
insertion. Specifically, the zygomatic arches
expand, and both the sagittal and nuchal crests
develop.
The primary parameter commonly measured for
biomechanical analyses of the jaw is mechanical
advantage, which increases when moment arm
length increases relative to that of the out-lever.
During ontogeny, both in-levers and out-levers
increase with increasing overall size, but if the
length of the in-lever increases faster than that of
the out-lever, mechanical advantage of the associ-
ated jaw musculature also increases. Our data
show that mechanical advantage of the masseter
does not increase over the course of spotted hyena
ontogeny, indicating isometric growth of the two
lever arms (Fig. 10b). In contrast, mechanical
advantage of the temporalis increases sharply over
ontogeny, with adult form not reached until 22
months of age. The temporalis is by far the larger
of the two main adductor muscles in Crocuta as it
is in other carnivores.
Mediation of Feeding Performance
Previous studies have assessed ontogenetic vari-
ation in bite force among captive spotted hyenas
and other mammals (Binder and Van Valken-
burgh, 2000; Thompson et al., 2003), and bite force
measures are certainly ecologically relevant for
bone-cracking animals like spotted hyenas.
Although the lever ratios for the temporalis in the
Fig. 10. Growth curves for (a) mechanical advantage of the hyena’s jaw cease changing by 22 months of age,
temporalis, (b) mechanical advantage of the masseter, and (c)
zygomatic arch breadth. Other symbols are as in Fig. 8. [Color we would expect bite force to increase for nearly
figure can be viewed in the online issue, which is available at another year, coincident with increasing zygomatic
www.interscience.wiley.com.] arch breadth and associated muscle mass. Bite
force, however, is only one of a suite of perform-
ance measures associated with feeding. Gape and
Even the skull features that mature earliest do feeding speed also influence carnivore feeding per-
so well after weaning. On average, spotted hye- formance. Absolute jaw length dictates gape,
nas in our free-living study population are which determines the size of bones that individu-
weaned at 14 months of age (Holekamp et al., als can effectively crack open (Binder, 1998; Binder
1996), so like other bone-cracking hyaenids, these and Van Valkenburgh, 2000). The increase in rela-
animals are weaned quite late relative to other tive length of the rostrum and mandible seen here
carnivores (Gittleman, 1989; Watts et al., 2009). during preweaning hyena development should
Despite the long lactation period, newly weaned enhance this aspect of feeding performance. Fur-
spotted hyenas are still far from adult size and thermore, an increase in jaw length reflects the
shape (Figs. 8 and 9). Furthermore, we document replacement of dentition, which also has implica-
distinctly different patterns of change in skull tions for both bite force (Binder, 1998) and feeding
shape before versus after weaning (Figs. 6 and 7). speed (Tanner, 2007).
Journal of Morphology362 J.B. TANNER ET AL.
TABLE 3. A comparison of age at skull maturity relative to age at reproductive maturity for a number of carnivoran species
Age at Age at Age at
Age at reproductive first skull
weaning maturity breeding maturity
Species (months) (years) (years) (years) Sources
Spotted hyenas 8–24 2 2 3 Present study (Watts, 2007)
(Crocuta crocuta)
Spotted seal 0.5–1 4–5 ? 5 (Atkinson, 1997) (Mizuno and
(Phoca largha) Ohtaishi, 2002)
Sea otter 6–8 $3–5 3–5 2 (Krkosek et al, 2007)
(Enhydra lutris) #5–7 (Tinker et al., 2006)
(Hattori et al., 2003)
Polar bear 16–28 5 5 $5 (Bechshøft et al., 2008)
(Ursus maritimus) #3–10 (Derocher and Stirling, 1998)
Brown bear 18–30 $2–5 4 101 (Mano and Tsubota, 2002)
(Ursus arctos) #3–4 (Zedrosser et al., 2007)
(Ohdachi et al., 1992)
Coyote 1.2–1.6 0.8 0.8–1.9 0.42 (Bekoff and Gese, 2003)
(Canis latrans) (LaCroix et al,
unpublished data)
Black-backed Jackal 1.8–2.3 0.9 2 0.3–0.5 (Walton and Joly, 2003)
(Canis mesomelas) (Lombard, 1971)
All studies except for this study and that of LaCroix et al. used traditional linear morphometric measurements.
Feeding speed is expected to be a critical more thoroughly defined by the geometric morpho-
determinant of performance in spotted hyenas, metric analyses (Figs. 6 and 7), which indicate not
because these animals compete intensively with only an increase in zygomatic breadth after wean-
conspecifics over kills. We recently tested feeding ing but also a relative anteroposterior lengthening
speed in known-age individuals by timing con- of the zygomatic arches (see Fig. 3), and develop-
sumption of a standardized soft food object, and ment of the sagittal and nuchal crests (see Fig. 4),
found that wild spotted hyenas do not achieve all of which should provide more muscle attach-
adult performance levels until 34 months of age ment area for the adductor muscles. Both the tem-
(Watts et al., 2009). This is only 1 month before
skull shape reaches maturity, but long after skull
size and mechanical advantage of the temporalis
muscle reach adult values (see Fig. 11). This differ-
ence in timing between functional maturity and
the maturity of skull size suggests that skull size
cannot account for low feeding speeds after
29 months of age. Similarly, mechanical advantage
of the temporalis muscles, which is known to affect
feeding performance in other mammals (e.g., Des-
sem and Druzinsky, 1992; Thompson et al., 2003),
can only potentially account for low feeding speeds
among hyenas younger than 22 months old.
The only hypothesis consistent with our data is
that juvenile feeding speed is largely constrained
after puberty by aspects of skull form that limit
the mass of adductor muscles. With increasing
muscle mass and changes in muscle architecture,
both bite force and feeding speed should increase
even with mechanical advantage held constant.
Changes in hyena skull morphology after weaning
are dominated by an increase in the size of the
space through which the masseter and temporalis
muscles pass and an expansion of attachment
areas for those muscles. This is apparent from the
absolute increase in zygomatic arch breadth Fig. 11. A timeline illustrating the ages at maturity for mor-
(Fig. 10c), which presumably corresponds to phological measures in relation to major life history events (in
increasing size of the jaw adductor muscles. It is capital letters).
Journal of MorphologySKULL DEVELOPMENT IN SPOTTED HYENAS 363
poralis and masseter are importantly involved in intensive feeding competition characteristic of this
jaw closure and bite force generation in all mam- species, we have hypothesized that constrained de-
mals, but the unusually large size of the tempora- velopment of the feeding apparatus among juve-
lis in Crocuta (Tanner et al., 2008) suggests that niles, occurring in an environment characterized
this muscle plays a disproportionately large role in by intensive feeding competition, may have shaped
feeding among bone-cracking hyaenids. the evolution of female dominance (Watts et al.,
2009). Extant Crocuta evolved only 200,000–
990,000 years ago from ancestors specialized for
Evolutionary Implications of Protracted
scavenging and durophagy (Lewis and Werdelin,
Skull Development
2000). Trade-offs associated with development of a
Feeding performance is expected to improve dur- craniodental morphology competent for durophagy
ing ontogeny as juvenile mammals shift from a rel- may have generated strong selection pressures
atively easy diet comprised mainly of milk, to one during Crocuta’s recent evolutionary shift to feed-
that is more challenging after weaning. Weaned ing in large groups on live prey, favoring not only
juvenile hyenas compete for the same food resour- rapid development of the morphological tools
ces as those consumed by adults. However, when needed to cope with difficult foods but also favor-
competing with adults at ungulate kills, where the ing large, aggressive mothers able to help their
ability to feed rapidly confers huge energetic bene- cubs during competitive feeding (Watts et al.,
fits, juveniles are clearly severely disadvantaged. 2009). Although none of the other species included
The developmental transition from a juvenile skull in Table 3 experience intensive feeding competi-
with a feeding apparatus ill-suited for a duropha- tion, evidence of delayed maturation in Crocuta
gous diet, to an adult skull highly specialized for relative to that in carnivores that do experience
durophagy, continues until 35 months of age, intense feeding competition on a regular basis
which is nearly 2 years after nutritional independ- would suggest that aggressiveness and social dom-
ence from the mother (see Fig. 11). This is not only inance have been favored in female spotted hyenas
long after weaning but also long after spotted hye- to help their offspring compensate for their poorly-
nas reach reproductive maturity at 24 months (see developed feeding abilities long after weaning. To
Fig. 11). The longest lifespan we have ever docu- be able to crack open large bones with their jaws
mented among wild spotted hyenas is 18 years in adulthood, it appears the price paid by spotted
and the mean expected lifespan for females alive hyenas has been delayed achievement of feeding
at puberty is 12 years (Watts, 2007). Thus, 15–25% performance maxima until long after weaning and
of the lifespan may pass in this species before the puberty.
feeding apparatus is fully mature. Postcranial
measurements from this population of spotted hye-
nas reach maturity before sexual maturity at an ACKNOWLEDGMENTS
average of 22 months of age (Swanson et al., We are grateful to the Kenyan Ministry of Edu-
unpublished data). Thus protracted development cation, Science, and Technology, Office of the Presi-
of the skull relative to that of the postcranial anat- dent; the Narok County Council; the Senior War-
omy further suggests that there are selective pres- den of the Masai Mara National Reserve; the
sures on the specialized skulls of these animals. National Museums of Kenya; and the Kenyan
There appears to be a trade-off between selection Wildlife Service for their permission to collect the
on juveniles to achieve mature feeding capabilities specimens used here, and for their cooperation and
as early as possible and the relatively long period support. We also are indebted to Don Swiderski,
of time necessary to develop the specializations of Terri McElhinny, Melissa Gallego, Laura Abraczin-
the skull required to crack open and consume skas, and Paula Hildebrandt for their help on this
bones of large diameter. Unfortunately, comparable project. We also thank three anonymous reviewers
data on skull maturation are available for very who provided valuable feedback and suggestions
few carnivore species. Those data suggest that pro- on a previous version of this manuscript. The
tracted development of the skull occurs not only in methods used in this study are included in our
spotted hyenas but also in some bears (Table 3). Animal Research Protocol AUF 07/08-099-00,
Spotted hyenas are unique among carnivores, which was approved most recently on June 4, 2008
and highly unusual among mammals, in that they by the Institutional Animal Care and Use Commit-
exhibit female dominance over males. Maternal tee at Michigan State University (MSU).
investment in this species is enormous when com-
pared with that seen in most carnivores (Hofer
and East, 1995, 1993; Holekamp et al., 1996; Watts LITERATURE CITED
et al., 2009). In light of the highly specialized
Alberch P, Gould SJ, Oster GF, Wake DB. 1979. Size and shape
bone-cracking morphology in these animals, their in ontogeny and phylogeny. Paleobiology 5:296–317.
prolonged period of offspring dependence, the Andresen PR, Bookstein FL, Conradsen K, Ersbøll B, Marsh J,
protracted development of their skulls, and the Kreiborg S. 2000. Surface-bounded growth modeling applied
Journal of Morphology364 J.B. TANNER ET AL.
to human mandibles. IEEE Trans Med Imaging 19:1053– Hattori K, Burdin AM, Suzuki M, Ohtaishi N. 2003. Age-related
1063. change and allometry of skull and canine of sea otters, Enhy-
Atkinson S. 1997. Reproductive biology of seals. Rev Reprod dra lutris. J Vet Med Sci 65:439–447.
2:175–194. Herrel A, Gibb AC. 2006. Ontogeny of performance in verte-
Bechshøft TØ, Sonne C, Rigét FF, Wiig Ø, Dietz R. 2008. Differ- brates. Physiol Biochem Zool 79:1–6.
ences in growth, size and sexual dimorphism in skulls of East Hildebrand M. 1984. Analysis of Vertebrate Structure. New
Greenland and Svalbard polar bears (Ursis maritimus). Polar York: Wiley.
Biol 31:945–958. Hofer H, East M. 1995. Population dynamics, population size,
Bekoff M, Gese EM. 2003. Wild mammals of North America: and the commuting system in Serengeti spotted hyenas. In:
Biology, management, and conservation. In: Feldhamer GA, Sinclair ARE, Arcese P, editors. Serengeti II: Dynamics, Man-
Thompson BC, Chapman JA, editors. Coyote (Canis latrans). agement, and Conservation of an Ecosystem. Chicago: Uni-
Baltimore, Maryland: John Hopkins University Press. versity of Chicago Press. pp 332–363.
pp 467–481. Hofer H, East ML. 1993. The commuting system of Serengeti
Biknevicius AR. 1996. Functional discrimination in the mastica- spotted hyaenas: How a predator copes with migratory prey.
tory apparatus of juvenile and adult cougars (Puma concolor) III. Attendance and maternal care. Anim Behav 46:575–589.
and spotted hyenas (Crocuta crocuta). Can J Zool 74:1934– Hofer H, East ML. 1996. The components of parental care and
1942. their fitness consequences: A life history perspective. Verh
Binder WJ. 1998. Functional Aspects of Tooth and Jaw Develop- Dtsch Phys Ges Zool 89. 2:149–164.
ment in Large Carnivores, PhD Dissertation, University of Holekamp KE, Smale L. 1990. Provisioning and food sharing by
California, Los Angeles. lactating spotted hyenas. Crocuta crocuta (Mammalia: Hyae-
Binder WJ, Van Valkenburgh B. 2000. Development of bite nidae). Ethology 86:191–202.
strength and feeding behaviour in juvenile spotted hyenas Holekamp KE, Smale L, Szykman M. 1996. Rank and reproduc-
(Crocuta crocuta). J Zool 252:273–283. tion in the female spotted hyaena. J Reprod Fertil 108:229–
Bookstein FL. 1996. Combining the tools of geometric morpho- 237.
metrics. In: Marcus LF, Corti M, Loy A, Naylor GJ, Slice DE, Hurov J, Henry-Ward W, Phillips L, German R. 1988. Growth
editors. Advances in Morphometrics. New York: Plenum allometry of craniomandibular muscles. tendons, and bones in
Press. pp 131–151. the laboratory rat (Rattus norvegicus): relationships to oromo-
Bookstein FL. 1997. Landmark methods for forms without land- tor maturation and biomechanics of feeding. Am J Anat
marks: Morphometrics of group differences in outline shape. 182:381–394.
Med Image Anal 1:97–118. Koehl MAR. 1996. When does morphology matter? Ann Rev
Bookstein FL, Streissguth AP, Sampson PD, Connor PD, Barr Ecol Syst 27:501–542.
HM. 2002. Corpus callosum shape and neuropsychological Krkosek M, Lauzon-Guay J, Lewis MA. 2007. Relating dispersal
deficits in adult males with heavy fetal alcohol exposure. and range expansion of California sea otters. Theor Popul
Neuroimage 15:233–251. Biol 71:401–407.
Carrier, DR. 1996. Ontogenetic limits on locomotion perform- Kruuk H. 1972. The spotted hyena: a study of predation and
ance. Physiol Zool 69:467–488. social behavior. Chicago, Illinois: University of Chicago Press.
p 335.
Derocher AE, Stirling I. 1998. Maternal investment and factors
Lewis ME, Werdelin L. 2000. The evolution of spotted hyenas
affecting offspring size in polar bears (Ursus maritimus).
(Crocuta). I U C N Hyaena Specialist Group Newsletter 7:34–
J Zool Soc Lond 245:253–260.
36.
Dessem, D, Druzinsky RE. 1992. Jaw-muscle activity in ferrets,
Lombard LJ. 1971. Age determination and growth curves in the
Mustela putorious furo. J Morph 213:275–286.
black-backed jackal. Canis mesomelas Schreber, 1775 (Carni-
Frank LG. 1986. Social organization of the spotted hyaena (Cro- vora: Canidae). Ann Transvaal Mus 27:135–181.
cuta crocuta). I. Demography. Anim Behav 34:1500–1509.
Mano T, Tsubota T. 2002. Reproductive characteristics of brown
Frank LG, Holekamp KE, Smale L. 1995. Dominance, demogra- bears on the Oshima peninsula, Hokkaido, Japan. J Mamm
phy, and reproductive success of female spotted hyenas. In: 83:106–1034.
Sinclair ARE, Arcese P, editors. Serengeti II: Dynamics, Man- McKinney ML, McNamara KJ. 1991. Heterochrony: The Evolu-
agement, and Conservation of An Ecosystem. Chicago, Illi- tion of Ontogeny. Plenum Press: New York.
nois: University of Chicago Press. pp 364–384.
Mills MGL. 1990. Kalahari Hyaenas: Comparative Behavioral
Gaillard JM, Pontier D, Allainé D, Loison A, Herve JC, Heiz- Ecology of Two Species. London: Unwin Hyman. p 303.
mann A. 1997. Variation in growth form and precocity at Mizuno AW, Ohtaishi N. 2002. Cranial features of the spotted
birth in eutherian mammals. Proc R Soc Lond B 264:859– seal. Phoca largha, in the Nemuro Strait, considering age
868. effects. J Vet Med Sci 64:137–144.
Gittleman JL. 1989. Carnivore Behavior, Ecology and Evolu- Monteiro LR, Lessa LG, Abe AS. 1999. Ontogenetic variation in
tion. Ithaca, New York: Cornell University Press. skull shape of Thrichomys apereoides (Rodentia: Echimyidae).
Gittleman JL, Van Valkenburgh B. 1997. Sexual dimorphism in J Mamm 80:102–111.
the canines and skulls of carnivores: Effects of size, phylog- Ohdachi S, Aoi T, Mano T, Tsubota T. 1992. Growth, sexual
eny, and behavioural ecology. J Zool 242:97–117. dimorphism, and geographical variation of skull dimensions
Gould SJ. 1977. Ontogeny and Phylogeny. Harvard Univ. Press: of the brown bear Ursus arctos in Hokkaido. J Mamm Soc
Cambridge, Massachusetts. Japan 17:27–47.
Greaves WS. 1983. A functional analysis of carnassial biting. Radinsky LB. 1981. Evolution of skull shape in carnivores. I.
Biol J Linn Soc 20:353–363. Representative modern carnivores. Biol J Linn Soc 15:369–
Greaves WS. 1985. The mammalian postorbital bar as a tor- 388.
sion-resisting helical strut. J Zool 207:125–136. Rohlf FJ. 2005. tpsDig 2.10. NY: Stony Brook.
Green WDK. 1996. The thin-plate spline and images with curv- Rohlf FJ, Slice DE. 1990. Extensions of the Procrustes method
ing features. In: Mardia,KV, Gill CA, Dryden IL, editors. for the optimal superimposition of landmarks. Syst Zool
Image Fusion and Shape Variability. Leeds: University of 39:40–59.
Leeds Press.pp 79–87. Sampson PD, Bookstein FL, Sheehan H, Bolson EL. 1996.
Gunz P, Mitteroecker P, Bookstein FL. 2005. Semilandmarks in Eigenshape analysis of left ventricular outlines from contrast
three dimensions. In: Slice DE, editor. Modern Morphometrics ventriculograms. In: Marcus LF, Corti M, Loy A, Naylor GJP,
in Physical Anthropology. New York: Kluwer Academic/Ple- Slice DE, editors. Advances in Morphometrics. New York:
num Publishers. pp 73–98. Nato ASI Series, Series A: Life Science. pp 131–152.
Journal of MorphologySKULL DEVELOPMENT IN SPOTTED HYENAS 365
Schweikher FP. 1930. Ectocranial suture closure in the hyae- Van Valkenburgh B. 2007. Deja vu: The evolution of feeding
nas. Am J Anat 45:443–460. morphologies in the Carnivora. Integr Comp Biol 47:147–163.
Sheets DH. 2003. IMP-Integrated Morphometrics Package. Buf- Wagner AP. 2006. Behavioral ecology of the striped hyaena
falo, NY: Department of Physics, Canisius College. (Hyaena hyaena), PhD Dissertation, Montana State Univer-
Smith KK. 1993. The form of the feeding apparatus in terres- sity, Bozeman.
trial vertebrates: Studies of adaptation and constraint. In: Wainwright PC. 1994. Functional morphology as a tool in ecologi-
Hanken J, Hall BK, editors. The Skull. Chicago: University of cal research. In: Wainwright PC, Reilly SM, editors. Ecological
Chicago Press. pp 150–185. Morphology. Chicago: University of Chicago Press. pp 42–59.
Tanner JB. 2007. Behavioral and morphological development in Wainwright PC, Reilly SM, editors. 1994. Ecological Morphol-
a female-dominated species, the spotted hyena (Crocuta croc- ogy. Chicago: University of Chicago Press.
tuta), PhD Dissertation, Michigan State University, East Walton LR, Joly DO. 2003. Canis mesomelas. Mammalian Spe-
Lansing, MI. cies. Am Soc Mamm 715:1–9.
Tanner JB, Dumont ER, Sakai ST, Lundrigan BL, Holekamp Watts HE. 2007. Social and ecological influences on survival
KE. 2008. Of Arcs and Vaults: The Biomechanics of Bone- and reproduction in the spotted hyena, Crocuta crocuta, PhD
cracking in the Spotted Hyena (Crocuta crocuta). Biol J Linn Dissertation, Michigan State University, East Lansing, MI.
Soc 95:246–265. Watts HE, Tanner JB, Lundrigan BL, Holekamp KE. 2009. Post-
Thomason JJ. 1991. Cranial strength in relation to estimated weaning maternal effects and the evolution of female domi-
biting forces in some mammals. Can J Zool 69:2326–2333. nance in the spotted hyena. Proc R Soc Lond B 276:2291–2298.
Thompson EN, Biknevicius AR, German R. 2003. Ontogeny of Werdelin L. 1989. Constraint and adaptation in the bone-cracking
feeding function in the gray short-tailed opossum Monodel- canid Osteoborus (Mammalia: Canidae). Paleobiology 15:387–401.
phis domestica: empirical support for the constrained model Zedrosser A, Støen O, Saebø S, Swenson JE. 2007. Should I
of jaw biomechanics. J Exp Bio 206:923–932. stay or should I go? Natal dispersal in the brown bear. Anim
Tinker MT, Doak DF, Estes JA, Hatfield BB, Staedler MM, Bod- Behav 74:369–376.
kin JL. 2006. Incorporation of diverse data and realistic com- Zelditch ML, Lundrigan BL, Sheets HD, Garland T Jr.
plexity into demographic estimation procedures for sea otters. 2003. Do precocial mammals develop at a faster rate? A
Ecol App 16:2293–2312. comparison of rates of skull development in Sigmodon
Van Horn RC, McElhinney TL, Holekamp KE. 2003. Age esti- fulviventer and Mus musculus domesticus. J Evol Biol
mation and dispersal in the spotted hyena (Crocuta crocuta). 16:708–720.
J Mamm 84:1019–1030. Zelditch ML, Lundrigan BL, Garland T Jr. 2004. Developmental
Van Valkenburgh B. 1988. Incidence of tooth breakage among regulation of skull morphology. I. Ontogenetic dynamics of
large, predatory mammals. Am Nat 131:291–302. variance. Evol Dev 6:194–206.
Journal of MorphologyYou can also read