Impact Factor volatility to a single paper: A comprehensive analysis
←
→
Page content transcription
If your browser does not render page correctly, please read the page content below
Impact Factor volatility to a single paper: A comprehensive
                                                                          analysis

                                                                                  Manolis Antonoyiannakisa,b
                                         a Department   of Applied Physics & Applied Mathematics, Columbia University, 500 W. 120th St., Mudd 200, New York,
                                                                                                  NY 10027
                                                           b American Physical Society, Editorial Office, 1 Research Road, Ridge, NY 11961-2701

                                                                                      ORCID: 0000-0001-6174-0668
arXiv:1911.02533v2 [cs.DL] 24 Feb 2020

                                         Abstract
                                             We study how a single paper affects the Impact Factor (IF) by analyzing data from 3,088,511
                                         papers published in 11639 journals in the 2017 Journal Citation Reports of Clarivate Analytics.
                                         We find that IFs are highly volatile. For example, the top-cited paper of 381 journals caused their
                                         IF to increase by more than 0.5 points, while for 818 journals the relative increase exceeded 25%.
                                         And one in 10 journals had their IF boosted by more than 50% by their top three cited papers.
                                         Because the single-paper effect on the IF is inversely proportional to journal size, small journals
                                         are rewarded much more strongly than large journals for a highly-cited paper, while they are pe-
                                         nalized more for a low-cited paper, especially if their IF is high. This skewed reward mechanism
                                         incentivizes high-IF journals to stay small, to remain competitive in rankings. We discuss the im-
                                         plications for breakthrough papers appearing in prestigious journals. We question the reliability
                                         of IF rankings given the high IF sensitivity to a few papers for thousands of journals.
                                         Keywords: Science of Science, Impact Factor, Volatility, Citation Distributions, Bibliostatistics

                                         1. Introduction & Motivation

                                             The effect of a journal’s scale (i.e., size) on its citation average cannot be overstated. Recently,
                                         we showed (Antonoyiannakis, 2018) that citation averages, such as IFs, are scale-dependent
                                         in a way that drastically affects their rankings, and which can be understood and quantified
                                         via the Central Limit Theorem: For a randomly formed journal           √ of scale n, the range of its IF
                                         values (measured from the global citation average) scales as 1/ n. While actual journals are not
                                         completely random, the Central Limit Theorem explains to a large extent their IF–scale behavior,
                                         and allows us to understand how the balance in IF rankings is tipped in two important ways: (a)
                                         Only small journals can score a high IF; and (b) large journals have IFs that asymptotically
                                         approach the global citation average as their size increases, via regression to the mean.
                                             At a less quantitative level, the scale-dependence of citation averages has been noted earlier,
                                         by Amin & Mabe (2004), Campbell (2008), and Antonoyiannakis & Mitra, (2009). Yet it is
                                         almost always neglected in practice. Journal size is thus never accounted or controlled for in
                                         Impact Factor rankings, whether by standardization of citation averages (a rigorous approach;

                                             Email address: ma2529@columbia.edu ()
                                         Preprint submitted to Quantitative Science Studies                                               February 26, 2020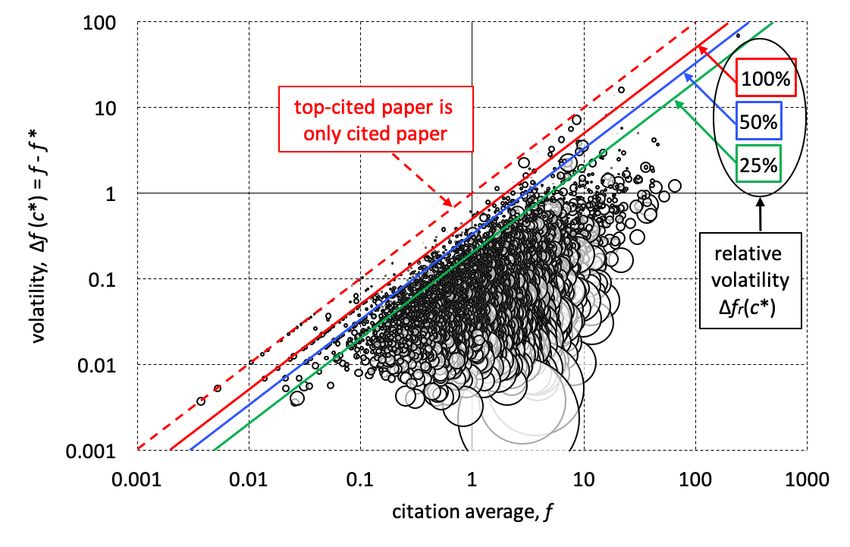
see Antonoyiannakis, 2018), or by the grouping of journals in size categories, much like their
grouping in subject categories, a procedure widely accepted due to different citation practices
across subjects of research. Instead, Impact Factors for journals of all sizes are lumped together
in rankings such as the Journal Citation Reports (JCR) or the Impact Factor Quartile rankings
of Clarivate Analytics, or in ad hoc lists of competitively ranked journals used by faculty hir-
ing and tenure committees, etc. The problem spills over into university rankings and even in
national rankings of citation indicators, which generally do not control for the size of a cohort
(department, research field, etc.) in comparing citation averages.
     Perhaps the best demonstration of how sensitive citation averages are to scale is to study
how they are affected by a single paper. Usually, we take it for granted that averages are scale-
independent. However, underlying this certainty is the assumption that a sum over n terms grows
(more or less) linearly with scale n. In most cases, this assumption is valid. But for research
papers in scholarly journals the assumption can break down, because the huge variation in annual
citations per paper—from 0 to several thousand—can cause the average to spike abruptly and
grow non-linearly when a highly cited paper is published in a small journal. And while this
effect dies out with increasing scale, it routinely plagues IF rankings, because most scholarly
journals are small enough that the effect is present. In short, we need to dispel the notion that
size-normalization is equivalent to size-independence for citation averages.
     So, how volatile are Impact Factors, and other citation averages in general? A single research
article can tip the balance in university rankings (Waltman et al., 2011; Bornmann & Marx, 2013)
and even affect national citation indicators (Aksnes & Sivertsen, 2004) when citation averages
are used, due to the skewed nature of citation distributions. It is also known that in extreme
situations, a single paper can strongly boost a journal’s IF (Rossner, Van Epps & Hill, 2007;
Dimitrov, Kaveri & Bayry, 2010; Moed et al., 2012; Foo, 2013; Milojević, Radicchi & Bar-Ilan,
2017). More recently, Liu et al. (2018) studied the effect of a highly-cited paper on the IF of four
different-sized journals in particle physics and found that “the IFs of low IF and small-sized jour-
nals can be boosted greatly from both the absolute and relative perspectives.” While cautionary
remarks have been raised recently at the assumption of size-independence of citation averages
(Antonoyiannakis, 2018; Leydesdorff, Bornmann & Adams, 2019; Lyu & Shi, 2019; Prathap,
2019; Cope & Kalantzis, 2014), the overwhelming majority of researchers, bibliometricians, ad-
ministrators, publishers, and editors continue to use them without realizing or acknowledging the
problem.
     In this paper, we show how pervasive the scale sensitivity of citation averages is, by analyzing
the volatility of Impact Factors to a single paper for all 11639 journals listed in the 2017 JCR.
Our paper is structured as follows. First, we introduce the volatility index as the IF change,
∆ f (c)—or relative change, ∆ fr (c)—when a single paper cited c times is published by a journal
of Impact Factor f and size N. Second, we study theoretically how ∆ f (c) depends on c, f , and
N, and obtain analytic expressions for the volatility in the general case but also for two special
cases: when the new paper is cited well-above or well-below the journal average. We discuss
the implications for editorial decisions from the perspective of improving a journal’s position
in IF rankings. Third, we analyze data from the 11639 journals in the 2017 JCR. We provide
summary statistics for the journals’ IF volatility to their own top-cited paper. We discuss the
implications for publishing breakthrough papers in high-profile journals. We also discuss the
reliability of IF rankings, and provide recommendations for more meaningful and statistically
viable comparisons of journals’ citation impact.
     The high volatility values from real-journal data demonstrate that ranking journals by IFs
constitutes a non-level playing field, since, depending on size, the IF gain of publishing an
                                                   2
equally cited paper can span up to 4 orders of magnitude across journals. It is therefore criti-
cal to consider novel ways of comparing journals based on solid statistical grounds.
2. How a single paper affects the IF: An example from four journals
We are now ready to analyze the effect of a single paper on a journal’s IF. Initially, let the
journal have an IF equal to f1 , which is the ratio of C1 citations to the biennial publication count
N1 . The additional paper causes the IF denominator to increase by 1, and the nominator by c.
Before we study the general case, let us first consider one example, to get an idea of what is
going on. In Table 1 we list four journals whose sizes range from 50 to 50,000, but their IFs are
the same. The numbers are fictitious but realistic: As one can confirm from the JCR, there are
journals with size and IFs sufficiently close to the values in the table.
Journal Size Citations Initial IF New paper Final IF ∆ f (c) ∆ fr (c)
N1 C1 f1 c f2 f2 − f1 ( f2 − f1 )/ f1
A 50 150 3 100 4.902 1.902 63.4 %
B 500 1500 3 100 3.194 0.194 6.45 %
C 5,000 15,000 3 100 3.019 0.019 0.65 %
D 50,000 150,000 3 100 3.002 0.0019 0.06 %
Table 1: A hypothetical but realistic scenario. Four journals, A, B, C, and D, have the same IF but different sizes, when
they each publish a paper that brings them c = 100 citations. The IF gain spans 4 orders of magnitude—both in absolute,
∆ f (c), and relative, ∆ fr (c), terms—since it depends not only on the additional paper, but also on the size of each journal.
Journal B is 10 times larger than A. When a highly-cited paper (c = 100) is published by
A, the IF changes by ∆ f (100) = 1.902. When the same paper is published by B, the change is
ten times smaller, i.e., ∆ f (100) = 0.194. Therefore, to compete with journal A—to obtain the
same IF increase ∆ f (c)—journal B needs to publish 10 equally highly cited papers. Likewise,
for every paper of c = 100 that A publishes, C needs to publish 100 equally cited papers to obtain
the same IF increase. And for every paper of c = 100 that journal A publishes, journal D needs
to publish 1000 equally cited papers to compete.
To sum up, the IF increase is inversely proportional to journal size. Publication of the same
highly cited paper in any of the journals A, B, C, or D, produces widely disparate outcomes, as
the corresponding IF increase spans four orders of magnitude, from 0.0019 to 1.902. With such
a high sensitivity to scale, the comparison of IFs of these four journals is no level playing field:
Small journals disproportionately benefit from highly cited papers.
The above example considers a highly cited paper. As we will shortly see, there is a sufficient
number of highly cited papers to cause hundreds of journals every year to jump up considerably
in IF rankings due to one paper. And even further: There are many journals of sufficiently small
size and small IF that even a low- or moderately-cited paper can produce a big increase in their
IF. Therefore, IF volatility due to a single paper (or a handful of papers, in the more general case)
is a much more common pattern than is widely recognized. Which is why this behavior of IFs
goes beyond academic interest. To understand this fully, let us now consider the general case.
3. How a single paper affects the IF: The general case. Introducing the IF volatility index.
The initial IF is
C1
f1 = , (1)
N1
3so that when the new paper is published by the journal, the new IF becomes
C1 + c
f2 = . (2)
N1 + 1
The change (volatility) in the IF caused by this one paper is then
C1 + c C1
∆ f (c) ≡ f2 − f1 = − , (3)
N1 + 1 N1
so that
c − f1 c − f1
∆ f (c) = ≈ , (4)
N1 + 1 N1
where the approximation is justified for N1
1, which applies for all but a few journals that
publish only a few items per year. So, the IF volatility, ∆ f (c), depends both on the new paper
(i.e., on c) and on the journal (size N1 , and citation average f1 ) where it is published.
We can also consider the relative change in the citation average caused by a single paper,
which is probably a more pertinent measure of volatility. For example, if a journal’s IF jumps
from 1 to 2, then this is bigger news than if it jumped from 20 to 21. The relative volatility is
f2 − f1 c − f1 c − f1 c − f1
∆ fr (c) ≡ = ≈ = , (5)
f1 f1 (N1 + 1) f1 N1 C1
where, again, the approximation is justified when N1
1. The above equation can be further
simplified for highly cited papers (c
f1 ) as
c
∆ fr (c) ≈ , when c
f1 . (6)
C1
Let us now return to ∆ f (c) and make a few remarks.
(a) For c > f1 , the additional paper is above-average with respect to the journal, and there is
a benefit to publication: ∆ f (c) > 0 and the IF increases, i.e., f2 > f1 .
(b) For c < f1 , the new paper is below-average with respect to the journal, and publishing it
invokes a penalty: ∆ f (c) < 0 as the IF drops, i.e., f2 < f1 .
(c) For c = f1 , the new paper is average, and publishing it makes no difference in the IF.
(d) The presence of N1 in the denominator means that the benefit or penalty of publishing an
additional paper decays rapidly with journal size. This has dramatic consequences.
Let us now consider two special cases of interest:
â CASE 1. The new paper is well above average relative to the journal, i.e., c
f1 . Here,
c − f1 c c
∆ f (c) = ≈ ≈ , (7)
N1 + 1 N1 + 1 N1
where the last step is justified since in realistic cases we have N1
1. The volatility ∆ f (c)
depends on the paper itself and on the journal size. The presence of N1 in the denominator
means that publishing an above-average paper is far more beneficial to small journals than to
large journals. For example, a journal A that is ten times smaller than a journal B will have a ten
times higher benefit upon publishing the same highly cited paper, even if both journals had the
same IF to begin with! The editorial implication here is that it pays for editors of small journals
to be particularly watchful for high-performing papers. From the perspective of competing in
4IF rankings, small journals have two conflicting incentives: Be open to publishing risky and
potentially breakthrough papers on the one hand, but not publish too many papers lest they lose
their competitive advantage due to their small size.
For c
N1 , we get ∆ f (c) ≈ 0 even for large c. So, when large journals publish highly cited
papers, they have a tiny benefit in their IF. For example, when a journal with N1 = 2000 publishes
a paper of c = 100, the benefit is a mere ∆ f (100) = 0.05. For a very large journal of N1 = 20000,
even an extremely highly cited paper of c = 1000 produces a small gain ∆ f (1000) = 0.05.
But for small and intermediate values of N1 , the value of ∆ f (c) can increase appreciably.
This is the most interesting regime for journals, which tend to be rather small: Recall that “90%
of all journals publish 250 or fewer citable items annually” (Antonoyiannakis, 2018).
â CASE 2. The new paper is well below average relative to the journal, i.e., c
f1 . (For
journals of, say, f1 ≤ 2, the condition c
f1 implies c = 0.) Here,
c − f1 f1 f1
∆ f (c) = ≈− ≈− , (8)
N1 + 1 N1 + 1 N1
since in realistic cases we have N1
1. The penalty ∆ f (c) depends now only on the journal
parameters (N1 , f1 ), and it is greater for small-sized, high-IF journals. The editorial implication
is that editors of small and high-IF journals need to be more vigilant in pruning low-performing
papers than editors of large journals. Two kinds of papers are low-cited, at least in the IF citation
window: (a) archival, incremental papers, and (b) some truly ground-breaking papers that may
appear too speculative at the time and take more than a couple years to be recognized.
For f1
N1 , we get ∆ f (c) ≈ 0. Very large journals lose little by publishing low-cited papers.
The take-home message from the above analysis is two-fold. First, with respect to increasing
their IF, it pays for all journals to take risks. Because the maximum penalty for publishing below-
average papers (≈ f1 /N1 ) is smaller than the maximum benefit for publishing above-average
papers (≈ c/N1 ), it is better for a journal’s IF that its editors publish a paper they are on the fence
about, if what is at stake is the possibility of a highly influential paper. Some of these papers may
reap high citations to be worth the risk: recall that c can lie in the hundreds or even thousands.
However, the reward for publishing breakthrough papers is much higher for small journals.
For a journal’s IF to seriously benefit from ground-breaking papers, the journal must above all
remain small, otherwise the benefit is much reduced due to its inverse dependence with size. To
the extent that editors of elite journals are influenced by IF considerations, they have an incentive
to keep a tight lid on their acceptance decisions and reject many good papers, and even some
potentially breakthrough papers they might otherwise have published. We wonder whether the
abundance of prestigious high-IF journals with small biennial sizes, N2Y < 400, and especially
their size stability over time, bears any connection to this realization. In other words, is “size
consciousness” a reason why high-IF journals stay small? We claim yes. As Philip Campbell,
former Editor-in-Chief of Nature put it, “The larger the number of papers, the lower the impact
factor. In other words, worrying about maximizing the impact factor turns what many might
consider a benefit—i.e. more good papers to read—into a burden.” (Campbell, 2008).
To recap, why are high-IF journals incentivized to stay small to remain competitive in IF
rankings? Because once a journal reaches a high IF, it is much easier to sustain it by staying
small than by expanding in size. Equation 4 explains why. For every above-average paper (of
fixed citation count, for simplicity of argument) published, the IF increases but by a smaller
amount as the journal grows, so the returns diminish. At the same time, for every below-average
paper published the IF drops. With increasing journal size, it gets harder to keep raising the IF
5but easier to slip into a lower IF, since low-cited papers are far more abundant than highly cited
papers. It is a matter of risk.
The incentive for high-IF journals to stay small may disproportionately affect groundbreak-
ing papers, because they entail higher risk. How so? First, it is hard to identify such papers
before publication. Many groundbreaking papers face controversy in the review process and are
misjudged by referees who may be too conservative or entrenched to realize their transformative
potential. Obviously, no editor wishes to publish unrealistic or wrong papers. The editors hedge
their bets, so to speak, and take chances in accepting controversial papers. (Needless to say, this
is where editorial skill and competence, coupled with outstanding and open-minded refereeing,
can make a difference.) But editors of small, high-IF journals can afford fewer risks than editors
of large, moderate-IF journals, as explained in the previous paragraph—which pushes them to
be more conservative and accept a smaller fraction of these controversial papers. Second, even if
it were possible to know the groundbreaking papers beforehand, editors of small, high-IF jour-
nals would still be incentivized by IF arguments to reject some of them, because such papers are
less likely to be top-cited in the 2-year IF window. Indeed, Wang, Veugelers & Stephan (2017)
reported on the increased difficulty of transformative papers to appear in prestigious journals.
They found that “novel papers are less likely to be top cited when using short time-windows,”
and “are published in journals with Impact Factors lower than their non-novel counterparts, ce-
teris paribus.” They argue that the increased pressure on journals to boost their IF “suggests that
journals may strategically choose to not publish novel papers which are less likely to be highly
cited in the short run.” To sum up: If a small journal fine-tunes its risk level and publishes only
some controversial (i.e., potentially groundbreaking) papers, its IF will benefit more, statistically
speaking, than if it published them all.
Why worry about intellectually risky papers? Because they are more likely to lead to major
breakthroughs (Fortunato et. al., 2018.) It was in this spirit that the Physical Review Letters
Evaluation Committee recommended back in 2004 that steps be taken to “educate referees to
identify cutting edge papers worth publishing even if their correctness cannot be definitively
established,” and that “[r]eferee training should emphasize that a stronger attempt be made to
accept more of the speculative exciting papers that really move science forward.” (Cornell et
al., 2004.) Granting agencies have reached a similar understanding. For example, an effort to
encourage risk in research is the NIH Common Fund Program, established in 2004 and support-
ing “compelling, high-risk research proposals that may struggle in the traditional peer review
process despite their transformative potential” (NIH News Release, 2018). These awards “rec-
ognize and reward investigators who have demonstrated innovation in prior work and provide a
mechanism for them to go in entirely new, high-impact research directions.” (Collins, Wilder
& Zerhouni, 2014). Europe’s flagship program for funding high-risk research, the European
Research Council, was established in 2007 and “target[s] frontier research by encouraging high-
risk, high-reward proposals that may revolutionize science and potentially lead to innovation if
successful.” (Antonoyiannakis, Hemmelskamp & Kafatos, 2009).
4. How the IF volatility index ∆ f (c) depends on the parameters f1 , N1 , c.
We now analyze graphically how ∆ f (c) depends on its parameters, namely, the IF of the
journal f1 , the biennial publication count N1 , and the annual citation count c of a single paper.
First, let us briefly comment on the dependence of ∆ f (c) on f1 . Impact Factors f1 range typi-
cally from 0.001–200, but are heavily concentrated in low-to-moderate values (Antonoyiannakis,
2018): The most commonly occurring value (the mode) is 0.5, while 75% of all journals in the
62017 JCR have IF < 2.5. Since our chief aim here is to study the effects of a single paper on
citation averages, we are mostly interested in high c values (c > 100, say), in which case the
effect of f1 on ∆ f (c) or on ∆ fr (c) can be usually ignored, as can be seen from Eq. (7) and Eq.
(6) respectively. For smaller c values relative to f1 , the effect of f1 is to simply reduce the size of
∆ f (c) by some amount, but is otherwise of no particular interest.
Let us now look at the dependence of ∆ f (c) on N1 and c. The journal biennial size N1
ranges from 20–60,000 and is heavily centered at small sizes (Antonoyiannakis, 2018), which
has important implications, as we shall see. As for c, it ranges from 0–5000 in any JCR year, and
its distribution follows a power law characteristic of the Pareto distribution for c ≥ 10 (Table 2).
Citation No. papers cited Citation No. papers cited
threshold, ct at least ct times threshold, ct at least ct times
0 3088511 200 302
1 2138249 300 139
2 1490683 400 80
5 570744 500 56
10 176718 1000 14
20 43030 1500 7
30 18485 2000 6
40 10016 2500 5
50 6222 3000 2
100 1383 4000 0
Table 2: Number of papers cited at least ct times. Publication Years = 2015–2016, Citation Year = 2017. JCR data.
Figure 1 is a 3D surface plot of ∆ f (c) vs. N1 and c, for a fixed f1 = 10. Figure 2 is projection
of Fig. 1 in 2D, i.e., a contour plot, for more visual clarity. The main features of the plots are:
1. For a given c value, ∆ f (c) decreases rapidly with N1 , as expected from Eq. (4), since the
two quantities are essentially inversely proportional for c
f1 .
2. For realistic values of N1 , c, the volatility ∆ f (c) can take high values. For example, for
20 ≤ N1 ≤ 100 and 20 ≤ c ≤ 500 we have 0.5 < ∆ f (c) < 25. Think about it: A single paper can
raise the IF of these journals by several points! This is impressive.
Why are these parameter values realistic? Because small journals abound, while there are
thousands of sufficiently cited papers that can cause an IF spike. Indeed, 25% of the 11639
journals in our data set publish fewer than 68 items biennially (N1 < 68), while 50% of journals
publish fewer than 130 items, and 75% of journals publish fewer than 270 items. The range of
N1 values plotted here (10–500) spans 90% of all journals (Antonoyiannakis, 2018). At the same
time, 6222 papers in our data set were cited at least 50 times, 1383 papers were cited at least 100
times, 302 papers were cited at least 200 times, etc. (Table 2).
As these plots demonstrate, small journals (N1 ≤ 500) enjoy a disproportionate benefit upon
publishing a highly-cited paper, compared to larger journals. Small journals are abundant. Highly
cited papers are relatively scarce, but nevertheless exist in sufficient numbers to cause abrupt IF
spikes for hundreds of small journals.
But an additional effect is also at work here, and it can cause IF spikes for thousands of
journals: a medium-cited paper published in a small and otherwise little-cited journal. Given
the high abundance of medium-cited papers (e.g., more than 176,000 papers in our data set are
cited at least 10 times) and low-IF journals (e.g., 4046 journals have f1 ≤ 1), journals that would
7Figure 1: 3D surface plot of IF volatility ∆ f (c) vs. (biennial) journal size N1 and citation count c of the new paper, for
a journal whose IF was f1 = 10 before publishing the paper. The range of N1 values plotted here covers 90% of all
journals, while 50% of all journals publish ∼ 130 or fewer citable items biennially (Antonoyiannakis, 2018). So, for
thousands of journals a paper cited c ' 100 can cause ∆ f (c) > 1. The IF of the journal has little effect on ∆ f (c) as long
as c
f1 . See Eq. (4).
Figure 2: Same data as in Fig. 1 but in a contour plot. Changes in gray level denote crossing integer values of ∆ f (c) as
shown in the plot. As journal size decreases, the IF volatility ∆ f (c) increases.
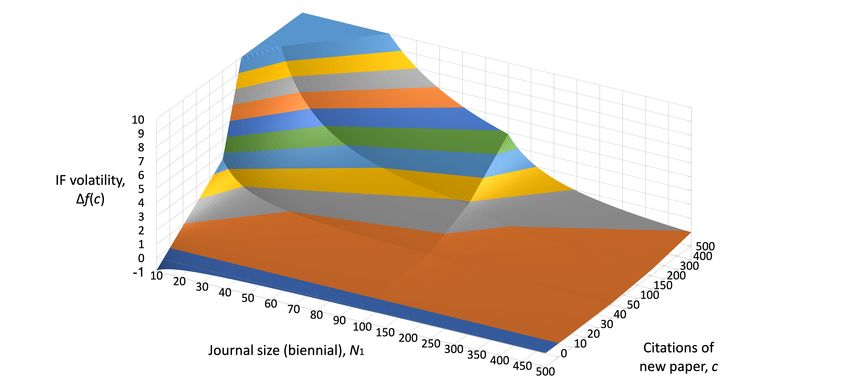
8Figure 3: IF volatility, ∆ f (c∗ ), vs. journal (biennial) size, N2Y , for 11639 journals in the 2017 JCR.
otherwise have had a negligible IF can end up with small or moderate IF. This is a much more
commonly occurring effect than has been realized to date.
5. Systematic study of the volatility index, using data from 11,639 journals.
Now that we understand in theory the IF volatility, let us look at some real journal data. We
have analyzed all journals listed in the 2017 JCR of Clarivate Analytics.
At this point, we could continue to study the effect of a hypothetical paper on the IFs of
actual journals, using JCR data for IFs and journal sizes. For example, we could ask the question,
“How does the IF of each journal change by incorporation of a paper cited c = 100 times?” and
calculate the corresponding volatility ∆ f (100). While such a calculation would be of value, we
adopt a different approach, in order to stay firmly anchored on actual data from both journals
and papers, and avoid hypotheticals. We ask the question “How did the IF (citation average) of
each journal change by incorporation of its most cited paper, which was cited c∗ times in the IF
2-year time-window?” We thus calculate the quantity ∆ f (c∗ ), where c∗ is no longer constant and
set equal to some hypothetical value, but varies across journals.
First, a slight change in terminology to avoid confusion. We wish to study the effect of a
journal’s top-cited paper on its citation average f when its biennial publication count is N2Y . So,
our journal’s initial state has size N1 = N2Y − 1 and citation average f1 , which we will denote as
f ∗ . Our journal’s final state has N2 = N2Y and f2 = f , upon publication of the top-cited paper
that was cited c∗ times. We study how ∆ f (c∗ ) and ∆ fr (c∗ ) behave using JCR data.
9Now, some technical details. The analysis was carried out in the second half of 2018. Among
the 12,266 journals initially listed in the 2017 JCR, we removed the several hundred duplicate
entries, as well as the few journals whose IF was listed as zero or not available. We thus ended up
with a master list of 11639 unique journal titles that received a 2017 IF as of December 2018. For
each journal in the master list we obtained its individual Journal Citation Report, which contained
the 2017 citations to each of its citable papers (i.e., articles and reviews) published in 2015–2016.
We were thus able to calculate the citation average f for each journal, which approximates the IF
and becomes identical to it when there are no “free” or “stray” citations in the numerator—that
is, citations to front-matter items such as editorials, letters to the editor, commentaries, etc., or
citations to the journal without specific reference of volume and page or article number. We
will thus use the terms “IF” and “citation average” interchangeably, for simplicity. Collectively,
the 11639 journals in our master list published 3,088,511 papers in 2015–2016, which received
9,031,575 citations in 2017 according to the JCR. This is our data set.
For the record, for 26 journals the top cited paper was the only cited paper, in which case
f ∗ = 0. Also, for 11 journals none of their papers received any citations, in which case f = f ∗ =
0! (These journals were however allocated an IF, so they did receive citations to the journal and
year, or to their front matter.) None of these 37 journals is depicted in our log-log plots.
In Figs. 3 and 4 we plot the volatility ∆ f (c∗ ) and relative volatility ∆ fr (c∗ ), respectively, vs.
journal size N2Y . In Fig. 5 we plot the volatility ∆ f (c∗ ) vs. the journal citation average, f , in a
bubble plot where bubble size is proportional to journal size. In Fig. 6 we plot the citation count
of the top-cited paper, c∗ , vs. journal citation average, f . In Tables 3 & 4 and 7 & 8 we identify
the top 100 journals in decreasing volatility ∆ f (c∗ ) and relative volatility ∆ fr (c∗ ), respectively.
In Tables 5 and 6 we show the frequency distribution of ∆ f (c∗ ) and ∆ fr (c∗ ), respectively.
Our key findings are as follows.
1. High volatilities are observed for hundreds of journals. For example:
(a) ∆ f (c∗ ) > 0.5 for 381 journals,
(b) ∆ f (c∗ ) > 0.25 for 1061 journals, etc.
Relative volatilities are also high for hundreds of journals. For example:
(c) ∆ fr (c∗ ) > 50% for 231 journals,
(d) ∆ fr (c∗ ) > 25% for 818 journals, etc.
2. If we look at the top few cited papers per journal—as opposed to the single top cited
paper—then the IF sensitivity to a handful of papers becomes even more dramatic. For
instance, the IF was boosted by more than 50% by:
(a) the top two cited papers for 710 journals,
(b) the top three cited papers for 1292 journals,
(c) the top four cited papers for 1901 journals, etc.
So, 10% of journals had their IF boosted by more than 50% by their top three cited papers!
3. Highest volatility values occur for small journals. This agrees with our earlier finding that
smaller journals benefit the most from a highly cited paper. By “small journals” we mean
N2Y ≤ 500. For example, 97 of the top 100 journals ranked by volatility (Tables 3 and
4), and all the top 100 journals ranked by relative volatility (Tables 7 and 8) publish fewer
than 500 papers biennially (N2Y ≤ 500).
4. Above the limit of N2Y ≈ 500, journal size starts to become prohibitively large for a jour-
nal’s IF to profit from highly cited papers. Notice how the maximum values of ∆ f (c∗ ) and
∆ fr (c∗ ) follow a downward trend with journal size above this limit.
10Figure 4: IF relative volatility, ∆ fr (c∗ ) vs. journal (biennial) size, N2Y , for 11639 journals in the 2017 JCR.
5. For some journals, an extremely highly cited paper causes a large volatility ∆ f (c∗ ). Con-
sider the top 2 journals in Table 3. The journal CA-A Cancer Journal for Clinicians pub-
lished in 2016 a paper that was cited 3790 times in 2017, accounting for almost 30% of
its IF citations that year, with a corresponding ∆ f (c∗ ) = 68.3. Without this paper, the
journal’s citation average would have dropped from f = 240.1 to f ∗ = 171.8. Similarly,
the Journal of Statistical Software published in 2015 a paper cited 2708 times in 2017,
capturing 73% of the journal’s citations that year. Without this paper, the journal’s citation
average would have dropped from f = 21.6 to f ∗ = 5.8. Although such extreme volatility
values are rare, they occur every year.
6. A paper need not be exceptionally cited to produce a large IF boost, provided the journal
is sufficiently small. Consider the journals ranked #3 and #4 in Table 3, namely, Living
Reviews in Relativity and Psychological Inquiry. These journals’ IFs were strongly boosted
by their top-cited paper, even though the latter was much less cited (c∗ = 87 and 97,
respectively) than for the top 2 journals. This is because journal sizes were smaller also
(N2Y = 6 and 11). Such occurrences are common, because papers cited dozens of times
are much more abundant than papers cited thousands of times, while there are also plenty
of very small journals. Indeed, within the top 100 journals ranked by volatility (Tables 3
and 4) there are 19 journals whose top-cited paper received fewer than 50 citations and yet
caused a significant volatility ∆ f (c∗ ) that ranged from 1.6 to 4.8. High values of relative
volatility ∆ fr (c∗ ) due to low-cited or moderately-cited papers are even more common. For
75 out of the 100 journals in Tables 7 and 8, the top-cited paper received fewer than 10
citations and yet caused ∆ fr (c∗ ) to range from 90% to 395%.
11Figure 5: IF volatility, ∆ f (c∗ ), vs. citation average, f , for 11639 journals in the 2017 JCR. Bubble size shows journal
size. The dashed line corresponds to the top-cited paper having all the journal’s citations, which occurs for 26 journals.
The three parallel lines labeled “100%”, “50%”, and “25%” denote relative volatility values ∆ fr (c∗ )—i.e., relative IF
boost—caused by the top-cited paper. Thus, data points above the 25% line describe the 818 journals whose top-cited
paper boosted their IF by more than 25%. As expected from the Central Limit Theorem, increasing journal size causes
the volatility to drop (larger bubbles “fall” to the bottom) and the IF to approach the global citation average µ = 2.9.
12Figure 6: Citations of top-cited paper, c∗ , vs. citation average, f , for 11639 journals in the 2017 JCR.
7. High volatilities are observed across the IF range. See Fig. 5. For example, ∆ f (c∗ ) > 0.5
for f ∼ 1 − 40. High relative volatilities (∆ fr (c∗ ) > 25%) are also observed across the IF
spectrum. However, as expected from the Central Limit Theorem, with increasing journal
size the IF approaches the global citation average µ = 2.9, is less sensitive to outliers and
volatility drops: large bubbles “fall” to the bottom.
8. The top-cited paper captures a sizable fraction of the journal’s citations for journals across
the IF range. See Fig. 5. The dashed line with unity slope corresponds to the situation
when the top-cited paper has all the journal’s citations (so that f ∗ = 0 and ∆ f (c∗ ) = f ).
This line can never be reached in a log-log plot of data, although there are 26 journals with
f ∗ = 0 and another 11 journals with f = 0, as we mentioned earlier. But note how many
journals are close to that line and how they extend across the IF range. For example, 818
journals have ∆ fr (c∗ ) > 25% (data points above the green line). Another example: Among
the 142 journals whose top-cited paper captures more than 50% of the journal’s citations,
their IF ranges from f = 0.1 − 21.6 while their size ranges from N2Y = 31 − 477.
9. Broadly speaking, the citation count of the top-cited paper correlates with the IF. See Fig.
6. But note how widely spread the highly cited papers are across journals. For example,
papers with c∗ ≥ 50 appear in many journals of small-to-moderate IF, 0.5 < f < 2.5.
10. Note the parallel lines of negative slope at the bottom left corner of Fig. 3. All these
lines have slope equal to −1 in a log-log plot of ∆ f (c∗ ) vs. N2Y , a feature that is readily
explained from Eq. (4), whence ∆ f (c∗ ) ∼ (c∗ − f ∗ )/N2Y (since N2Y
1 usually). The offset
of the parallel lines is equal to log(c∗ − f ∗ ), which for c∗
f ∗ is roughly equal to log(c∗ ).
Therefore, the ∆ f (c∗ ) data points for all journals whose highest cited paper was cited c∗
13times must fall on the same line, irrespective of their IF, as long as c∗
f ∗ . The parallel
lines are therefore simply lines of increasing c∗ value, starting from c∗ = 1, 2, 3, etc., as we
move from the bottom left to the top right of the figure. When the inequality c∗
f ∗ no
longer holds, a broadening of the parallel lines occurs and they overlap, exactly as we see
in Fig. 3. Because of the highly skewed citation distribution of papers, the parallel lines
become less populated as c∗ increases, i.e., for higher values of ∆ f (c∗ ).
We have studied how a journal’s top-cited paper affects its IF. Could the effect work the other
way around, the journal affecting citations to its papers? If such an effect were strong, the source
journal would have boosted all its papers indiscriminately, and the IF-volatility would be low
for all journals. Therefore, at least for the thousands of journals of high (absolute or relative)
volatility, citations to the top-cited paper are mainly article-driven and not journal-driven.
6. Conclusions
Our paper has two core messages. First, we demonstrate how strongly volatile IFs are to
a single or a few papers, and how frequently this occurs: Thousands of journals are seriously
affected every year. Second, we demonstrate the skewed reward mechanism that affects journals’
IFs disproportionately for an equally-cited paper, depending on journal size.
The above findings corroborate our earlier conclusion (Antonoyiannakis, 2018) that IFs are
scale dependent in that they are particularly volatile for small journal sizes, as explained by the
Central Limit Theorem. This point is pertinent for real journals because 90% of all journals
publish no more than 250 citable items annually, a regime where single-paper effects are at play
as IFs are susceptible to sufficiently highly cited papers, of which there are thousands.
Compared to large journals, small journals have (a) much more to gain by publishing a highly-
cited paper, and (b) more to lose by publishing a little-cited paper. The penalty for a zero-
cited paper can be easily exceeded by the reward of a highly-cited paper. So, in terms of IF, it
pays for a small journal to “fine-tune” its risk level: publish a few potentially groundbreaking
papers, but not too many. This upper limit to how many risky papers an elite, high-IF journal
can publish before it begins to compromise its IF imparts a conservative mindset to the editor:
Reject most but a few of the intellectually risky and innovative submissions, and the journal’s IF
can still benefit massively if some of them pay off. Such an ulterior motive—where the editor is
conscious of the journal’s size while assessing an individual paper at hand—makes it even harder
for transformative papers to appear in elite journals.
The reliability of IF rankings (and citation averages in general) is compromised by the high IF
volatility to a handful of papers, observed for thousands of journals each year. Three examples:
(a) In 2017, the top cited paper of 381 journals raised their IF by 0.5; (b) 818 journals had their
IF boosted by more than 25% by their top cited paper; and (c) one in ten journals (1292 journals)
had their IF boosted by more than 50% by their top three cited papers.
Given this high sensitivity to outliers, does it make sense to compare two journals by their IF?
In our view, such a comparison is at best incomplete and at worst misleading. Why incomplete?
Because unless we know the underlying citation distributions and can thus ascertain that the
averages (IFs) are not swayed by a few outliers, we cannot safely use IFs as representatives of
both journals. And since most journals are small and have highly skewed citation distributions
with outliers, IF comparisons are more often misleading, because under these conditions the
mean (average) is a poor measure of central tendency, as per standard statistical practice (De
14Veaux, Velleman & Bock, 2014, pp. 57–58; Bornmann & Mutz, 2011; Seglen, 1992; Adler,
Ewing & Taylor, 2009; Calver & Bradley, 2009; Wall, 2009).
So, the volatility of IFs is not of academic but of practical interest. It is not an exclusive
feature of a few journals or a statistical anomaly that we can casually brush off, but an everyday
feature inherent in citation averages, affecting thousands of journals each year. It casts serious
doubt on the suitability of the IF as a journal defining quantity, and on the merits of ranking
journals by IF. And it is a direct consequence of the Central Limit Theorem.
It is therefore prudent to consider novel ways of comparing journals based on more solid
statistical grounds. The implications may reach much further than producing ranked lists aimed
at librarians—which was the original objective of Eugene Garfield when he proposed the IF—
and affect research assessment and the careers or scientists.
7. What to do?
Many alternatives to the IF have been proposed to date. Here we share our own recommen-
dations for how to remedy the problem, along three lines of thought.
â 1. Use metrics that are less sensitive to outliers than IFs. At a minimum, use citation medians
instead of citation averages or IFs, as has been proposed by Aksnes & Sivertsen, 2004; Rossner
et al., 2007; Wall, 2009; Calver & Bradley, 2009; Antonoyiannakis, 2015a, 2015b; Ioannidis &
Thombs, 2019.
A median shows the mid-point or “center” of the distribution. When statisticians wish to
describe the typical value of a skewed distribution, they normally report the median (De Veaux,
Velleman & Bock, 2014), together with the interquartile distance (the distance between the 1st
and 3rd quartile) as a measure of the spread. Note that citation distributions are typically highly
skewed, which makes the use of medians more suitable for their description. Citation medians
are far less sensitive to outlier papers and much less susceptible to gaming than citation averages
(IFs). On a practical note, as of 2017, the JCR of Clarivate Analytics list the citation median per
article type (research article and review article) for each journal, facilitating the wide dissemi-
nation of medians. (Cautionary note: On more occasions than we would have liked, the JCR
citation medians contained errors in article type that needed correction before use.)
â 2. Use standardized averages to remove the scale dependence from ‘bare’ citation averages.
A ‘bare’ average is prone to fluctuations from outliers, but the Central Limit Theorem allows
us to standardize it and remove the scale dependence. So, instead of the ‘bare’ citation average
(or IF), f , we have proposed (Antonoyiannakis, 2018) the standardized average, or Φ index:
f − µs
Φ= √ , (9)
σ s / N2Y
where µ s , σ s are the global average and standard deviation of the citation distribution of all
papers in the subject of the journal in question. The quantities µ s and σ s need to be found for
each research subject before a journal’s Φ index can be calculated. For example, if we were to
treat, for simplicity, all 3,088,511 papers published in all journals in 2015–2016 as belonging to
a single subject, then µ = 2.92, σ = 8.12, and we can use Eq. (9) to standardize the citation
average of any journal. Here, f and N2Y are the journal’s citation average (IF) and biennial size,
as usual. The Φ index is readily applicable to all citation averages, for instance in university
rankings. More details will be provided in a forthcoming publication.
â 3. Resist the one-size-fits-all mindset, i.e., the limitations of a single metric. Think of scholarly
journals as distributions of widely varying papers, and describe them as such. In line with this
15thinking, Larivière et al. (2016) suggested that journals display their full citation distribution, a
recommendation adopted by several publishers so far. In a welcome development, the Clarivate
Analytics JCR now display citation distributions for all journals that receive an Impact Factor.
However, plots of citation distributions can be overwhelming in practice (too much information)
and do not allow easy comparison across journals. So, again we turn to statistical practice and
ask how statisticians describe distributions. Typically, they use a 5-number summary of various
percentiles, which is graphically displayed as a box plot and includes outlier information (De
Veaux, Velleman & Bock, 2014; Krzywinski & Altman, 2014; Spitzer et al., 2014). We believe
that use of box plots and, more generally, percentiles (Bornmann, Leydesdorff, & Rüdiger (2013),
leads to responsible, informative, and practical comparisons of citation impact across journals
and other collections of papers.
Funding
This research did not receive any specific grant from funding agencies in the public, commercial,
or not-for-profit sectors.
Note
This is an extended version of an article (Antonoyiannakis, 2019) presented at the 17th Interna-
tional Conference of the International Society for Scientometrics and Informetrics, Rome, Italy.
Acknowledgements
I am grateful to Jerry I. Dadap for stimulating discussions, and to Richard Osgood Jr. for en-
couragement and hospitality. This work uses data from the Web of Science and Journal Citation
Reports (2017) by Clarivate Analytics provided by Columbia University.
Author Contributions
Manolis Antonoyiannakis: Conceptualization, data curation, formal analysis, methodology, writ-
ing.
Competing Interests
The author is an Associate Editor of Physical Review B and Physical Review Research, and a
Bibliostatistics Analyst at the American Physical Society. He is also an Editorial Board member
of the Metrics Toolkit, a volunteer position. He was formerly an Associate Editor of Physical
Review Letters and Physical Review X. The manuscript expresses the views of the author and not
of any journals, societies or institutions where he may serve.
References
Adler, R., Ewing, J., & Taylor, P. (2009). A report from the International mathematical union
(IMU) in cooperation with the International council of industrial and applied mathematics
(ICIAM) and the institute of mathematical statistics (IMS). Statistical Science, 24(1), 1–14.
https://doi.org/10.1214/09-STS285
Aksnes, D. W., & Sivertsen, G. (2004). The effect of highly cited papers on national citation
indicators. Scientometrics, 59, 213–224. https://doi.org/10.1023/B:SCIE.0000018529.58334.eb
Amin, M., & Mabe, M. (2004). Impact factors: Use and abuse. International Journal of
16Environmental Science and Technology, 1, 1–6.
Antonoyiannakis, M., & Mitra, S. (2009). Editorial: Is PRL too large to have an ‘impact’?
Physical Review Letters, 102, 060001. https://doi.org/10.1103/PhysRevLett.102.060001
Antonoyiannakis, M., Hemmelskamp, J., & Kafatos, F. C. (2009). The European Research
Council Takes Flight, Cell, 136, 805–809. https://doi.org/10.1016/j.cell.2009.02.031
Antonoyiannakis, M. (2015a). Median Citation Index vs. Journal Impact Factor. APS March
Meeting. Available from: http://meetings.aps.org/link/BAPS.2015.MAR.Y11.14
Antonoyiannakis, M. (2015b). Editorial: Highlighting Impact and the Impact of Highlighting:
PRB Editors’ Suggestions, Physical Review B, 92, 210001.
https://doi.org/10.1103/PhysRevB.92.210001
Antonoyiannakis, M. (2018). Impact Factors and the Central Limit Theorem: Why citation
averages are scale dependent, Journal of Informetrics, 12, 1072–1088.
https://doi.org/10.1016/j.joi.2018.08.011
Antonoyiannakis, M. (2019). How a Single Paper Affects the Impact Factor: Implications for
Scholarly Publishing, Proceedings of the 17th Conference of the International Society of
Scientometrics and Informetrics, vol. II, 2306–2313. Available from https://bit.ly/32ayyW4
Bornmann, L., Leydesdorff, L., & Rüdiger, M. (2013). The use of percentiles and percentile rank
classes in the analysis of bibliometric data: Opportunities and limits. Journal of Informetrics,
7, 158–165. https://doi.org/10.1016/j.joi.2012.10.001
Bornmann, L., & Marx, W. (2013). How good is research really? - Measuring the citation
impact of publications with percentiles increases correct assessments and fair comparisons.
EMBO REPORTS, 14, 226–230. https://doi.org/10.1038/embor.2013.9
Bornmann, L., & Mutz, R. (2011). Further steps towards an ideal method of measuring
citation performance: The avoidance of citation (ratio) averages in field-normalization.
Journal of Informetrics, 5(1), 228–230. https://doi.org/10.1016/j.joi.2010.10.009
Calver, M. C., & Bradley, J. S. (2009). Should we use the mean citations per paper to
summarise a journal’s impact or to rank journals in the same field? Scientometrics,
81(3), 611–615. https://doi.org/10.1007/s11192-008-2229-y
Campbell, P. (2008). Escape from the impact factor. Ethics in Science and Environmental
Politics, 8, 5–7. https://doi.org/10.3354/esep00078
Collins, F. S., Wilder, E. L., & Zerhouni, E., (2014). NIH Roadmap/Common Fund at 10 years.
Science, 345, (6194), 274–276. https://doi.org/10.1126/science.1255860
Cope, B. & Kalantzis, M. (2014). Changing knowledge ecologies and the transformation of
the scholarly journal, in The Future of the Academic Journal (Second edition), 9–83.
Chandos Publishing, Elsevier Limited. https://doi.org/10.1533/9781780634647.9
Cornell, E., Cowley, S. Gibbs, D., Goldman, M., Kivelson, S., Quinn, H., Seestrom, S., Wilkins,
J., & Ushioda, K. (2004). Physical Review Letters Evaluation Committee Report,
http://publish.aps.org/reports/PRLReportRev.pdf
De Veaux, R. D., Velleman, P. D., & Bock, D. E. (2014). Stats: Data and models (3rd Edition).
Pearson Education Limited.
Dimitrov, J.D., Kaveri, S.V., & Bayry, J. (2010). Metrics: journal’s impact factor skewed by a
single paper. Nature 466, 179. https://doi.org/10.1038/466179b
Foo, J.Y.A. (2013). Implications of a single highly cited article on a journal and its citation
indexes: A tale of two journals. Accountability in Research, 20, 93–106.
https://doi.org/10.1080/08989621.2013.767124
Fortunato, S., Bergstrom, C.T., Borner, K., Evans, J.A., Helbing, D., Milojevic, S., Petersen,
A.M., Radicchi, F., Sinatra, R., Uzzi, B., Vespignani, A., Waltman, L., Wang, D.S.,
17& Barabasi, A.L. (2018). Science of science, Science, 359, 1007.
https://doi.org/10.1126/science.aao0185
Ioannidis, J. P. A., & Thombs, B. D. (2019). A user’s guide to inflated and manipulated
impact factors. European Journal of Clinical Investigation, 49(9), 1–6.
https://doi.org/10.1111/eci.13151
Krzywinski, M., & Altman, N. (2014). Visualizing samples with box plots. Nature Methods, 11,
119–120. https://doi.org/10.1038/nmeth.2813
Larivière, V., Kiermer, V., MacCallum, C.J., McNutt, M., Patterson, M., Pulverer, B.,
Swaminathan, S., Taylor, S., & Curry, S. (2016). A simple proposal for the publication of
journal citation distributions, BioRxiv, 062109. https://doi.org/10.1101/062109
Leydesdorff, L., Bornmann, L., & Adams, J. (2019). The integrated impact indicator revisited
(I3*): A non-parametric alternative to the journal impact factor. Scientometrics, 119,
1669–1694. https://doi.org/10.1007/s11192-019-03099-8
Liu, W.S., Liu, F., Zuo, C., & Zhu, J.W. (2018). The effect of publishing a highly cited paper
on a journals impact factor: A case study of the Review of Particle Physics, Learned
Publishing 31, 261–266. https://doi.org/10.1002/leap.1156
Lyu, G., & Shi, G. (2019). On an approach to boosting a journal’s citation potential.
Scientometrics, 120, 1387–1409. https://doi.org/10.1007/s11192-019-03172-2
Milojević, S., Radicchi, F., & Bar-Ilan, J. (2017). Citation success index – An intuitive pair-wise
journal comparison metric. Journal of Informetrics, 11(1), 223–231.
https://doi.org/10.1016/j.joi.2016.12.006
Moed, HF, Colledge, L, Reedijk, J, Moya-Anegon, F, Guerrero-Bote, V, Plume, A, & Amin, M.
(2012). Citation-based metrics are appropriate tools in journal assessment provided that they
are accurate and used in an informed way. Scientometrics, 92, 367–376.
https://doi.org/10.1007/s11192-012-0679-8
NIH News Release, (2018). 2018 NIH Director’s awards for High-Risk, High-Reward
Research program announced,
https://www.nih.gov/news-events/news-releases/2018-nih-directors-awards-high-risk-high-reward-
research-program-announced.
Prathap, G. (2019). Scale-dependent stratification: A skyline-shoreline scatter plot.
Scientometrics, 119, 1269–1273. https://doi.org/10.1007/s11192-019-03038-7
Rossner, M., Van Epps, H., & Hill, E. (2007). Show me the data. Journal of Cell Biology, 179,
1091–1092. http://jcb.rupress.org/content/179/6/1091
Seglen, P. O. (1992). The skewness of science. Journal of the American Society for
Information Science, 43(9), 628–638.
https://doi.org/10.1002/(SICI)1097-4571(199210)43:9¡628::AID-ASI5¿3.0.CO;2-0
Spitzer, M., Wildenhain, J., Rappsilber, J., & Tyers, M. (2014). BoxPlotR: a web tool for
generation of box plots. Nature Methods, 11, 121–122. https://doi.org/10.1038/nmeth.2811
Wall, H. J. (2009). Don’t Get Skewed Over By Journal Rankings. The B.E. Journal of Economic
Analysis and Policy, 9, 34. https://doi.org/10.2202/1935-1682.2280
Waltman, L., van Eck, N.J., van Leeuwen, T.N., Visser, M.S., & van Raan, A.F.J. (2011).
Towards a new crown indicator: An empirical analysis. Scientometrics, 87, 467–481.
https://doi.org/10.1007/s11192-011-0354-5
Wang, J., Veugelers, R., & Stephan, P. (2017). Bias against novelty in science: A cautionary
tale for users of bibliometric indicators. Research Policy, 46, 1416–1436.
https://doi.org/10.1016/j.respol.2017.06.006
18Journal ∆ f (c∗ ) c∗ ∆ fr (c∗ ) f f∗ N2Y 1 CA-CANCER J CLIN 68.27 3790 40% 240.09 171.83 53 2 J STAT SOFTW 15.80 2708 271% 21.63 5.82 171 3 LIVING REV RELATIV 13.67 87 273% 18.67 5.00 6 4 PSYCHOL INQ 8.12 97 105% 15.82 7.70 11 5 ACTA CRYSTALLOGR C 7.12 2499 474% 8.62 1.50 351 6 ANNU REV CONDEN MA P 5.67 209 35% 21.82 16.15 34 7 ACTA CRYSTALLOGR A 5.57 637 271% 7.62 2.05 114 8 ADV PHYS 4.96 85 19% 30.42 25.45 12 9 PSYCHOL SCI PUBL INT 4.88 49 33% 19.71 14.83 7 10 ACTA CRYSTALLOGR B 4.19 710 199% 6.30 2.11 169 11 NAT ENERGY 4.15 420 11% 42.24 38.09 92 12 INT J COMPUT VISION 3.83 656 74% 9.03 5.20 170 13 NAT REV MATER 3.65 228 9% 45.55 41.90 51 14 MOL BIOL EVOL 3.53 1879 57% 9.73 6.20 530 15 EPILEPSY CURR 3.43 53 218% 5.00 1.57 15 16 LIVING REV SOL PHYS 3.30 47 44% 10.75 7.45 12 17 PURE APPL CHEM 3.27 525 175% 5.14 1.87 160 18 PROG SOLID STATE CH 3.18 57 52% 9.25 6.07 16 19 PROG QUANT ELECTRON 3.17 55 43% 10.60 7.43 15 20 ADV OPT PHOTONICS 3.16 106 18% 20.79 17.63 28 21 SOLID STATE PHYS 3.03 19 379% 3.83 0.80 6 22 GENET MED 3.00 818 49% 9.10 6.10 271 23 IEEE IND ELECTRON M 2.93 89 42% 9.86 6.93 28 24 MATER TODAY 2.93 260 15% 22.62 19.69 82 25 ACTA NEUROPATHOL 2.93 650 25% 14.84 11.91 218 26 J METEOROL SOC JPN 2.81 247 130% 4.98 2.16 87 27 PROG OPTICS 2.67 32 103% 5.27 2.60 11 28 J BIOL ENG 2.58 103 101% 5.13 2.55 39 29 ANNU REV NEUROSCI 2.56 114 22% 14.10 11.54 40 30 ENDOCR REV 2.52 123 21% 14.70 12.19 44 31 CLIN MICROBIOL REV 2.48 184 14% 20.49 18.02 67 32 J HUM RESOUR 2.38 156 61% 6.27 3.89 64 33 IND ORGAN PSYCHOL-US 2.35 42 53% 6.75 4.40 16 34 ADV CATAL 2.33 13 64% 6.00 3.67 4 35 GIGASCIENCE 2.33 240 53% 6.71 4.38 101 36 J ACAD MARKET SCI 2.29 198 43% 7.57 5.28 84 37 CHINESE PHYS C 2.25 1075 350% 2.90 0.64 477 38 THYROID 2.25 792 46% 7.10 4.85 350 39 INT J CANCER 2.24 2746 45% 7.20 4.96 1224 40 NAT PROTOC 2.21 614 23% 11.92 9.72 274 41 ALDRICHIM ACTA 2.10 28 43% 7.00 4.90 11 42 JAMA-J AM MED ASSOC 1.99 851 6% 35.57 33.57 410 43 REV MOD PHYS 1.99 191 6% 35.82 33.83 79 44 SURF SCI REP 1.96 55 12% 17.70 15.74 20 45 NAT REV GENET 1.95 235 5% 40.17 38.22 101 46 ANNU REV ASTRON ASTR 1.93 88 9% 24.21 22.27 34 47 AUTOPHAGY 1.93 19 606 26% 9.49 7.56 310 48 GEOCHEM PERSPECT 1.92 9 144% 3.25 1.33 4 49 EUR HEART J-CARD IMG 1.91 574 36% 7.16 5.25 298 50 MOBILE DNA-UK 1.90 91 54% 5.43 3.53 46 Table 3: Top 50 journals in volatility ∆ fr (c∗ ) to their top-cited paper. Publication Years = 2015–2016, Citation Year = 2017. JCR data. 11639 journals and 3,088,511 papers in data set.
Journal                                      ∆ f (c∗ )    c∗        ∆ fr (c∗ )   f          f∗         N2Y
   51      NAT REV DRUG DISCOV                          1.82         181       5%           41.14      39.32      78
   52      MULTIVAR BEHAV RES                           1.80         176       102%         3.56       1.76       97
   53      EARTH SYST SCI DATA                          1.76         133       27%          8.29       6.54       72
   54      MAT SCI ENG R                                1.65         60        9%           20.36      18.71      25
   55      NAT CHEM                                     1.65         450       7%           23.89      22.24      259
   56      BONE RES                                     1.64         89        16%          11.92      10.28      48
   57      ANNU REV IMMUNOL                             1.63         101       8%           22.57      20.94      49
   58      NPJ COMPUT MATER                             1.63         62        25%          8.09       6.45       34
   59      PROG PART NUCL PHYS                          1.63         76        17%          10.98      9.35       41
   60      PHOTOGRAMM ENG REM S                         1.60         225       114%         3.00       1.40       140
   61      J AM SOC ECHOCARDIOG                         1.59         399       34%          6.21       4.62       248
   62      WIRES DEV BIOL                               1.58         114       43%          5.21       3.64       70
   63      J SERV RES-US                                1.57         94        36%          5.98       4.41       57
   64      NANO-MICRO LETT                              1.57         137       29%          7.02       5.46       84
   65      JAMA ONCOL                                   1.57         367       11%          16.40      14.83      225
   66      WORLD PSYCHIATRY                             1.56         82        10%          17.86      16.29      42
   67      ADV APPL MECH                                1.55         11        48%          4.80       3.25       5
   68      NEURAL NETWORKS                              1.54         434       28%          7.05       5.51       279
   69      NAT REV MICROBIOL                            1.53         203       5%           30.46      28.94      114
   70      EXERC IMMUNOL REV                            1.52         34        29%          6.68       5.17       19
   71      KIDNEY INT SUPPL                             1.51         23        82%          3.36       1.85       14
   72      APPL MECH REV                                1.51         55        29%          6.73       5.22       33
   73      PROG ENERG COMBUST                           1.51         73        6%           24.76      23.25      33
   74      NEW ASTRON REV                               1.50         21        25%          7.50       6.00       10
   75      EMBO MOL MED                                 1.49         292       18%          9.59       8.10       191
   76      BEHAV BRAIN SCI                              1.47         46        31%          6.21       4.74       28
   77      LANCET NEUROL                                1.44         285       6%           25.08      23.63      181
   78      NAT PHOTONICS                                1.44         367       5%           31.14      29.70      234
   79      NAT BIOTECHNOL                               1.42         358       5%           29.80      28.38      232
   80      PHYS LIFE REV                                1.40         40        18%          9.17       7.77       23
   81      NAT REV NEUROSCI                             1.40         191       5%           31.63      30.23      115
   82      J PHOTOCH PHOTOBIO C                         1.39         69        10%          14.88      13.49      40
   83      CIRCULATION                                  1.38         1089      9%           16.32      14.93      776
   84      NAT REV IMMUNOL                              1.38         194       3%           41.07      39.69      112
   85      ANNU REV BIOPHYS                             1.35         52        13%          11.65      10.30      31
   86      ACTA NUMER                                   1.34         23        16%          9.64       8.30       11
   87      EUR HEART J                                  1.33         729       7%           20.29      18.95      532
   88      ACTA PHYS SLOVACA                            1.33         13        133%         2.33       1.00       9
   89      GENOM PROTEOM BIOINF                         1.33         109       26%          6.47       5.14       78
   90      BIOCHEM MEDICA                               1.32         128       62%          3.47       2.15       95
   91      ANNU REV FLUID MECH                          1.32         70        10%          14.67      13.36      43
   92      ANNU REV EARTH PL SC                         1.32         70        14%          10.76      9.44       46
   93      EUR J HEART FAIL                             1.31         338       15%          9.75       8.44       252
   94      ACTA ASTRONOM                                1.31         65        57%          3.60       2.30       48
   95      PSYCHOTHER PSYCHOSOM                         1.29         70        18%          8.27       6.98       49
   96      DIALOGUES HUM GEOGR                          1.29         22        32%          5.29       4.00       14
   97      LANCET INFECT DIS                              20
                                                        1.28         336       8%           17.76      16.49      250
   98      J ECON GROWTH                                1.28         37        25%          6.40       5.13       25
   99      J URBAN TECHNOL                              1.27         61        91%          2.66       1.39       47
   100     REV MINERAL GEOCHEM                          1.26         40        17%          8.58       7.32       26

Table 4: Top 51–100 journals in volatility ∆ f (c∗ ) to their top-cited paper. Publication Years = 2015–2016, Citation Year
= 2017. JCR data. 11639 journals and 3,088,511 papers in data set.
You can also read