Using Presence Questionnaires in Virtual Reality - Valentin Schwind
←
→
Page content transcription
If your browser does not render page correctly, please read the page content below
CHI 2019 Paper                                                                              CHI 2019, May 4–9, 2019, Glasgow, Scotland, UK

        Using Presence Questionnaires in Virtual Reality
        Valentin Schwind                         Pascal Knierim                         Nico Haas                      Niels Henze
      University of Stuttgart                      LMU Munich                      University of Stuttgart        University of Regensburg
        Stuttgart, Germany                       Munich, Germany                    Stuttgart, Germany             Regensburg, Germany
    valentin.schwind@acm.org                 pascal.knierim@ifi.lmu.de              nicohaasni@gmx.de                niels.henze@ur.de

ABSTRACT                                                                          1 INTRODUCTION
Virtual Reality (VR) is gaining increasing importance in sci-                     The key characteristic of virtual reality (VR) is the ability to
ence, education, and entertainment. A fundamental charac-                         create a sense of presence [11, 26, 43], the feeling of being
teristic of VR is creating presence, the experience of ’being’                    or acting in a place, even when one is physically situated in
or ’acting’, when physically situated in another place. Mea-                      another location [1, 24]. To create immersive VR experiences
suring presence is vital for VR research and development.                         and to study the interaction in VR, it is, therefore, crucial to
It is typically repeatedly assessed through questionnaires                        reliably measure presence. Previous work developed increas-
completed after leaving a VR scene. Requiring participants to                     ingly sophisticated approaches to assess presence. While
leave and re-enter the VR costs time and can cause disorien-                      multiple physiological measures have been proposed [18],
tation. In this paper, we investigate the effect of completing                    validated questionnaires are still the most common method
presence questionnaires directly in VR. Thirty-six partici-                       for measuring this construct [10]. Using different items and
pants experienced two immersion levels and filled three stan-                     subscales such questionnaires provide scores, which reflect
dardized presence questionnaires in the real world or VR. We                      the level of felt presence in the virtual world (cf. Table 1).
found no effect on the questionnaires’ mean scores; however,                         The use of validated presence questionnaires is omnipre-
we found that the variance of those measures significantly                        sent in research and industry. These standardized question-
depends on the realism of the virtual scene and if the subjects                   naires are filled in using pen and paper. Typical studies re-
had left the VR. The results indicate that, besides reducing                      peatedly assess presence, especially when multiple VR ex-
a study’s duration and reducing disorientation, completing                        periences are compared. As current VR experiences are pre-
questionnaires in VR does not change the measured presence                        sented through head-mounted displays (HMDs), users must
but can increase the consistency of the variance.                                 remove the headset and leave the VR before completing the
                                                                                  questionnaire. In doing so, the person has to re-orientate in
CCS CONCEPTS                                                                      the real-world which causes a so-called “break-in-presence
• Human-centered computing → HCI design and eval-                                 (BIP)” [11]. Slater and Steed describe it as a moment when
uation methods; Virtual reality; User studies;                                    “a report can be given that a break has occurred without this
                                                                                  in itself disturbing the sense of presence, which of course
KEYWORDS                                                                          has already been disturbed” [36]. This means that surveying
Virtual reality; presence; questionnaire; evaluation.                             subjects about their feeling of presence potentially causes
                                                                                  the BIP and compromises the phenomenon that the ques-
ACM Reference Format:
                                                                                  tionnaire is supposed to be measuring [26, 34, 36].
Valentin Schwind, Pascal Knierim, Nico Haas, and Niels Henze. 2019.
Using Presence Questionnaires in Virtual Reality. In CHI Conference
                                                                                     Leaving VR can cause BIPs which distort the phenomenon
on Human Factors in Computing Systems Proceedings (CHI 2019),                     that presence questionnaires measure [26, 34, 36]. Further-
May 4–9, 2019, Glasgow, Scotland UK. ACM, New York, NY, USA,                      more, leaving and re-entering the VR takes time not only
12 pages. https://doi.org/10.1145/3290605.3300590                                 because it requires removing and putting on the HMDs but
                                                                                  also reorientation in the real-world and when entering the
Permission to make digital or hard copies of all or part of this work for         VR experience again.
personal or classroom use is granted without fee provided that copies are not
                                                                                     Instead of requiring participants to leave the VR to fill in
made or distributed for profit or commercial advantage and that copies bear
this notice and the full citation on the first page. Copyrights for components    questionnaires, we propose to survey participants directly
of this work owned by others than ACM must be honored. Abstracting with           within the VR using existing questionnaires. Surveying par-
credit is permitted. To copy otherwise, or republish, to post on servers or to    ticipants during the VR experience have a number of poten-
redistribute to lists, requires prior specific permission and/or a fee. Request   tial advantages:
permissions from permissions@acm.org.
CHI 2019, May 4–9, 2019, Glasgow, Scotland UK
                                                                                       • Assessing their sense of presence becomes easier for
© 2019 Association for Computing Machinery.                                              participants when BIPs are reduced.
ACM ISBN 978-1-4503-5970-2/19/05. . . $15.00                                           • Staying in VR reduces study duration and avoids the
https://doi.org/10.1145/3290605.3300590                                                  need to adjust after a BIP.

Paper 360                                                                                                                                 Page 1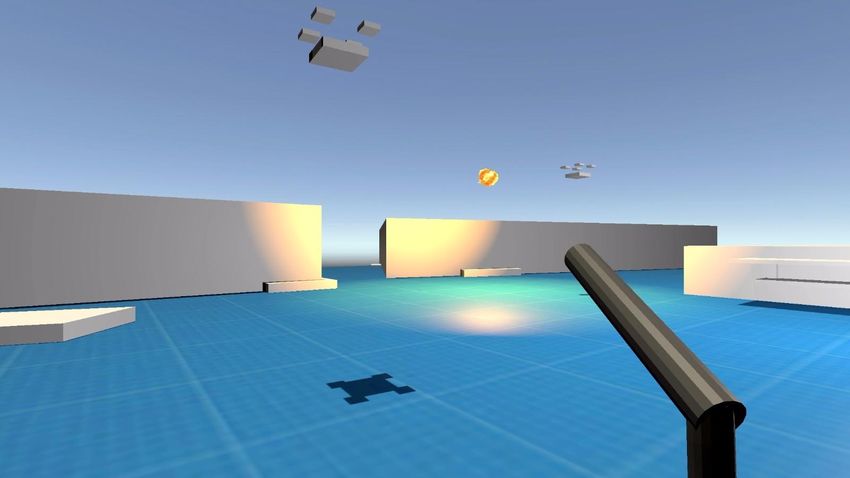
CHI 2019 Paper                                                             CHI 2019, May 4–9, 2019, Glasgow, Scotland, UK

    • Distracting or biasing cues from the real-world, such      fidelity of the interaction [3]. Some items, however, con-
      as the experimenter, are avoided.                          tained experiment-specific questions and, thus, had to be
                                                                 further refined.
Recent work has already started to assess presence by survey-       Based on previous work and a theoretical approach by
ing people directly within the VR [29, 30]. However, existing    Sheridan [31], who determined the underlying factors of
presence questionnaires have been developed and validated        presence (sensory information, sensor control, motor con-
over more than two decades by asking participants to fill        trol), Wittmer and Singer [42, 43] developed a 32-item pres-
them after leaving the VR. Therefore, the effect of filling      ence questionnaire. The authors identified three subscales
questionnaires within the VR is unclear, and it is unknown       which they labeled: involvement/control, natural, and inter-
if existing questionnaires provide meaningful results when       face quality. They also developed the immersive tendency
filled without leaving the VR.                                   questionnaire (ITQ) to determine characteristics of subjects,
    In this paper, we investigate if answering questionnaires    which potentially cause biases and affect subsequent judg-
in VR has an effect on three standardized presence question-     ments of presence [7]. However, the questionnaire by Wit-
naires, originally developed to be answered in the real world.   mer and Singer was criticized for the subjectively defined
We conducted a mixed-design study with 36 participants           factors and the low number of items directly assessing pres-
who experienced two different immersion levels. We found         ence [27, 33]. Nevertheless, the presence questionnaire by
no significant differences between the mean scores of the        Witmer and Singer (in the following referred to as WS) is
three questionnaires, which we measured inside or outside        currently the most cited presence questionnaire on Google
the VR. However, we found that the variance of those scores      scholar (cf. Table 1).
significantly depends on the realism of the scene when the          Another approach to measuring presence was developed
participants answered the questionnaires after leaving the       by Slater et al. [35, 39] and Usoh et al. [38] in multiple stud-
VR. Furthermore, the variance is consistent when presence        ies. The Slater-Usoh-Steed (in the following referred to as
scores are recorded in VR. This indicates that the feeling of    SUS) questionnaire is based on questions that are variations
presence depends on the contrast in the visual realism of the    of one of the three themes: (1) the sense of being in the VE,
virtual environments (VEs) and where the BIP occurred. We        (2) the extent to which the VE becomes the dominant reality,
argue to use presence questionnaires in VR, provide design       and (3) the extent to which the VE is remembered as a “place”.
implications, and provide directions for optimizing presence     The current version of the questionnaire has six items and is
questionnaires for in-situ use.                                  the second most cited presence questionnaire applicable for
                                                                 VEs. A study by Usoh et al. revealed that WS and SUS are not
                                                                 able to discriminate between presence in a VE and physical
2 RELATED WORK
                                                                 reality [39]. Furthermore, Sanchez-Vives and Slater argued
In 1980, Minsky introduced the concept of telepresence de-       that using questionnaires causes a “methodological circu-
scribing human operators interacting through a remote video      larity” as surveying about presence in VR might one bring
robot [19]. Convinced that this is technically feasible, re-     about the phenomenon of presence that the questionnaire is
searchers and engineers developed systems that creating          supposed to be measuring [26].
an immersive illusion of being somewhere else and it be-            Slater stated that a scientific basis for presence could not
came evident that the concept of presence also exists for        be established on the basis of post-experience presence ques-
VR systems [15, 25, 37]. Over more than two decades, previ-      tionnaires [34]. He concluded that “presence researchers
ous work developed, refined and validated questionnaires to      must move away from questionnaires in order to make any
measure presence created by VR which we summarize in the         progress in this area” [34]. It is conceivable that behav-
following. Afterward, we discuss initial work that used ques-    ioral or physiological measures are the more reliable mea-
tionnaires for measuring presence within the application         sures of presence. While there has been little research into
causing the experience.                                          whether behavioral measures are reliable enough [10], there
                                                                 are promising results with physiological measures such as
Measuring Presence                                               heart rate [18]. However, physiological measurements re-
                                                                 quire a baseline comparison for each participant, which
Barfield and Weghorst proposed one of the earliest appro-        means a considerable effort in some study designs. Further-
aches to measuring presence for VEs [3]. They investigated       more, it has been shown that additional equipment to mea-
the effect of varying the update rate of a computer-generated    sure physiological responses can be “the greatest cause of
simulation on the sense of presence within stereoscopic          breaks in presence” [18].
VEs [3]. They developed a 6-item questionnaire to mea-              Subjective questionnaires are currently the most common
sure presence and a 7-item questionnaire to measure the          method for measuring presence and have been shown to be

Paper 360                                                                                                                Page 2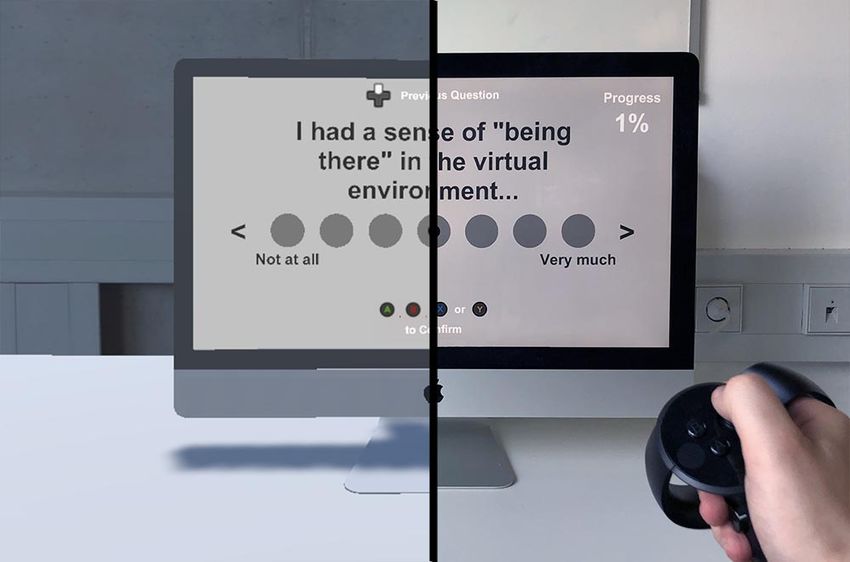
CHI 2019 Paper                                                                    CHI 2019, May 4–9, 2019, Glasgow, Scotland, UK

Table 1: Overview and comparison of 15 published                        and Singer presence questionnaire (WS) in games obtained
presence questionnaires                                                 using simple user interfaces with active game elements rep-
                                                                        resenting the questionnaire items (e.g., a 7-lane road instead
Authors                                 Year   Citations* Items Usage   of Likert-items). The presence scores were measured with
Banos et al. [2]                        1998     146     77      VE     desktop computers and were higher for questionnaires rep-
Barfield & Hendrix [3]                  1995     186    5+1      VE     resented by interactive gaming elements.
Cho et al. [4]                          2003      34      4      VE        Previous work already used presence questionnaires in
Dinh et al. [6]                         1999     365   13+1      VE
                                                                        VR: To investigate the effects of gender and the avatar hand
Gerhard et al. [9]                      2001      57   19+4     SVE
Kim & Biocca [12]                       1997     664      8      VE     appearance on presence in VR, Schwind et al. used integrated
Krauss et al. [13]                      2001      8      42      VE     questionnaires, which were presented on virtual walls [30].
Lombard & Ditton [16]                   2000     205    103     NA      Using the gesture recognition of the Leap Motion sensor,
Lombard & Weinstein (TPI) [17]          2009     120    4-8     CM
                                                                        the subjects answered the questions using the virtual hands
Lessiter et al. (ITC-SOPI)[14]          2001     861     44     CM
Nichols et al. [20]                     2000     158      9      VE     whose effect was measured. The underlying assumption was
Nowak & Frank [21]                      2003     569      9     SVE     that having the manipulated aspect, the appearance of the
Schubert et al. [23, 27, 28] (IPQ)     2001      758    14      VE      hands, in view when measuring its effect would lead to more
Usoh/Slater et al. [36, 39] (SUS)    1994/2000 853/466 3/6      VE
                                                                        reliable results. Similarly, the same procedure was used in a
Witmer & Singer [43] (WS)              1998     3569    32      VE
                                                                        study by Schwind et al. [29] to examine the effect of having
 VE = Virtual Environment, CM = Cross-Media,
 SVE = Shared Virtual Environment, NA = items not listed                fewer fingers in VR. Unfortunately, both studies did not com-
 * determined using Google Scholar, Sept 2018                           pare their measures to the established approach for filling
                                                                        out presence questionnaires in the real-world [29, 30].
sensitive enough to find differences in presence [10]. Schu-
bert et al. investigated the cognitive processes leading to a           Summary
model of presence and explored each component of the con-               Previous research highlights the importance of presence
struct [27]. They identified spatial-construction, attention,           as an outcome of immersive virtual environments [3, 31,
and judgments of realness as distinct components of pres-               43] and multiple approaches to measuring presence have
ence. Building on these results the authors developed and               been suggested [27, 33, 35, 38, 39, 43]. Researchers have se-
verified a 13-item presence scale consisting of three indepen-          rious concerns that presence questionnaires are not able
dent components called: spatial presence, involvement, and              to discriminate between presence in VE and the real-world
experienced realism. One item with a mild double loading on             and there have been vigorous debates over measuring pres-
involvement was added in their final version of the iGroup              ence [33, 34, 36].
presence questionnaire (IPQ)1 .                                            Presence questionnaires used today have been carefully
   Further presence questionnaires have been developed fo-              designed and refined over more than two decades. While
cusing on specific applications. Examples include the ITC-              asking participants to fill our questionnaires directly in VR
Sense of presence inventory (ITC-SOPI) [14] and the temple              might have advantages, work on video games suggests that
presence inventory (TPI) [17] for non-interactive media as              measuring presence within the application causing the expe-
well as questionnaires focusing on social environments [9,              rience might lead to different results [8, 32]. Recent work has
21]. Particularly the concepts of social or co-presence were            already used questionnaires in VR [29, 30] without consider-
investigated using a considerable number of measurement                 ing its potential effects. It is unclear if measuring presence
methods and questionnaires [5, 22, 41], but they are beyond             in VR differs from measuring presence in the real-world.
the scope of our work.

Integrated Questionnaires                                               3 METHOD
The idea to integrate questionnaires directly into the appli-           Study Design
cation causing the experience has already been facilitated              To investigate the effect of presence questionnaires inte-
in other domains. Shute, for example, recommended less                  grated into VR, we conducted a study with the two indepen-
obtrusive methods for computer-based video games to gain                dent variables (IVs) Environment and Virtual Realism.
feedback during the runtime of the game [32]. This was fur-             Environment has the two levels inside and outside the VR.
ther investigated by Frommel et al., who determined how                 Virtual Realism has the two levels abstract and realistic
presence in video games for PCs could be maintained for self-           scene. We measured presence through three different Ques-
reports [8]. They compared presence measures of the Witmer              tionnaires: Slater-Usoh-Steed questionnaire (SUS) [36, 39],
1 http://www.igroup.org/pq/ipq/                                         igroup presence questionnaire (IPQ) [23, 27, 28], and the

Paper 360                                                                                                                      Page 3
CHI 2019 Paper CHI 2019, May 4–9, 2019, Glasgow, Scotland, UK
fidelity Adam Exterior Environment 2 with detailed drones3
as targets.
For the inside the VR condition, we designed a virtual rep-
resentation of the laboratory in our institution. Using the
virtual replica of a real world laboratory was already pro-
posed for smooth transitions between the real world and
immersive environments in order to reduce the state of con-
fusion [40]. Real and virtual laboratory scene included an
iMac for displaying and answering the presence question-
naires (see Figure 1). Similar to the game scenes, the Oculus
Touch controller was used as an input device since it gave
visual cues for natural interaction within the VR. This con-
troller was also utilized in the outside the VR condition with
the distinction that the participant was not immersed in VR
Figure 1: Virtual (l) and real (r) environment with question- and filled in the questionnaires sitting in front of a real iMac,
naire and input controller. which displayed the questions.
All VR scenes were designed to be explored in a seated sit-
uation and presented to the participants using an Oculus Rift
CV1. To ensure fluent VR experiences and that the refresh
rate remained constant for the HMD (90 FPS) in all scenes,
we used state-of-the-art gaming hardware using an NVIDIA
questionnaire by Witmer and Singer (WS) [43]. As the par- GeForce GTX 1060 - 6 GB video card, an Intel i7-4790 CPU
ticipants should not experience the abstract or realistic scene running at 3.60 GHz, and 16 GB of memory.
twice, the Environment in which the questionnaires were
completed was a between-subject variable. To prevent any Measures
order effects we counterbalanced the questionnaires using
Presence scores of the three questionnaires were obtained
a 3 × 3 Latin Square, doubled by the conditions in- or out-
using a total of 52 items (6 SUS, 14 IPQ, 32 WS) on 7-point
side the VR, doubled by the two possible sequences of the
scales (see Figure 1). All items were presented as described
abstract and realistic scene, which resulted in a total of 12
in the original work. Response times were recorded by our
conditions, which were covered in triplicate by the number
software. As we hypothesized that the ability to recall the
of our participants (N=36).
presence state after BIP decreases the consistency between
our measures, we also used the absolute difference from the
Virtual Scenes and Tasks means as the measure of variability. To assess the perceived
To study the effects of Environment on the three ques- workload using VR and the real-world questionnaires, we
tionnaires, we developed a first-person drone shooter game used the NASA TLX with 6 items.
with two levels of Virtual Realism (see Figure 2). In both
conditions, the participants were located in an open space Procedure
equipped with a weapon to strike drones that exploded After welcoming the participants, we asked them to sign the
and disappeared when hit. Drones served as moving tar- consent form and take a seat. We explained the course of the
gets and flew a predefined route. Enlarged hitboxes encasing study to the participants and gave them a brief introduction
the drones remained the same for both scenes to keep the dif- into VR. We further explained how to interact within the
ficulty of striking drones equal among the conditions. They designed scenes to strike drones and navigate through the
appeared in three to four waves of three drones each. questionnaires using the Oculus Touch controller. Then, we
To induce different feelings of presence, we varied the adjusted the HMD to the participant’s head and calibrated
visual and auditory fidelity of the scenes (see Figure 1). The it to the participant’s inter-pupil distance for best visual
abstract environment included only simple untextured cubes results.
of different sizes forming walls and a blue floor. Flat cubes
represented the drones while simple octagon rods served as
2 https://assetstore.unity.com/packages/essentials/tutorial-projects/
a weapon. Further, only a simple explosion effects without
adam-exterior-environment-74969
sound, smoke, and sparks was displayed when a drone was 3 https://assetstore.unity.com/packages/3d/characters/robots/
hit. In contrast, the realistic scene was based on the high drone-controller-pc-joystick-mobile-61327
Paper 360 Page 4CHI 2019 Paper CHI 2019, May 4–9, 2019, Glasgow, Scotland, UK
Figure 2: Abstract and realistic scene of a first person shooter game developed to induce different levels of presence.
Then participants entered the VR and explored either the mixed-model analysis using ARTools by Wobbrock et al. [44]
immersive or abstract scene first. After spending approxi- to perform non-parametric tests with the two independent
mately 2.5 minutes in VR striking drones, we asked them variables Virtual Realism and Environment. Participant
to answer the presence questionnaires. Depending on the was entered as a random factor.
condition, they filled the questionnaire in the VR scene rep- We found a main effect of Virtual Realism, F (1, 34) =
resenting our lab on a virtual iMac, or the participant was 11.518, p = .002; however, not of Environment, F (1, 34) =
asked to exit the VE and answer the question outside the VR. .002, p = .958, and no interaction effect of Virtual Real-
All questionnaires were presented in a counterbalanced order ism × Environment, F (1, 34) = .007, p = .933 on the scores
to prevent any sequence effects. Progress between the items of the SUS. Similarly, there was a main effect of Virtual Re-
was shown in percent. After the first condition, the process alism, F (1, 34) = 15.552, p < .001; however, not of Environ-
was repeated with the other level of Virtual Realism. After ment, F (1, 34) = .013, p = .909, and no interaction effect of
experiencing both scenes and answering all questionnaires Virtual Realism × Environment, F (1, 34) = .004, p = .946
inside or outside the VR, we asked participants to answer on the scores of the IPQ. Furthermore, there was a main
the NASA TLX questionnaire concerning filling the previous effect of Virtual Realism, F (1, 34) = 17.078, p < .001; how-
questionnaires, not the drone game. The NASA TLX was al- ever, not of Environment, F (1, 34) < .001, p = 1.000, and
ways presented on paper. Finally, we collected demographic no interaction effect of Virtual Realism × Environment,
data and debriefed the participants. On average, participants F (1, 34) < .001, p = .759 on the scores of the WS presence
completed the study in 24.2 minutes (SD = 6.7). questionnaire.
Thus, the results did not reveal that leaving the VR sig-
Participants nificantly influenced the mean scores of the questionnaires.
We recruited 36 participants (24 male, 12 female) via our The mean scores between the questionnaires only showed
universities’ mailing lists with ages ranging from 19 to 32 significant differences when Virtual Realism changed. All
years (M = 23.81, SD = 2.81). All of them had a technical means of the questionnaire scores are shown in Figure 3.
background in computer science or engineering. Participants
received either 5 EUR or course credits as compensation for Score Variance
their participation. A number of 13 participants wore glasses, The absolute difference from the means was taken as a mea-
20 had previous VR experience. The study received ethics sure of variance. Means of the scores’ variance are shown
clearance according to the ethics and privacy regulations of in Figure 3. Figure 4 shows the Gaussian distribution curve
our institution. fits of those differences. We performed a multivariate anal-
ysis of variance (MANOVA) to assess the overall effect on
4 RESULTS the scores’ variance and to determine if the variance mea-
Questionnaire Scores sures are independent. As the statistical results are based on
We obtained the presence scores for each of the three ques- parametric data ARTool was not used.
tionnaires by averaging their 7-point scores. As the ques- We found no statistically significant differences for Vir-
tionnaires originate from ordinal scales, we performed non- tual Realism, F (1, 68) = 1.897, p = .138, Wilk’s λ = .920,
parametric tests for statistical evaluation. We used linear ηp2 = .016, or Environment, F (1, 68) = .148, p = .930,Wilk’s
Paper 360 Page 5CHI 2019 Paper CHI 2019, May 4–9, 2019, Glasgow, Scotland, UK
Score Variance
Presence Scores Score Variance
abs. deviation from the mean ratings
abs. deviation from the mean ratings
SUS IPQ WS
SUS IPQ 1.50 WS SUS IPQ WS
7 1.50
1.25
6 1.25
1.00
mean ratings
5 1.00
0.75
4 0.75
0.50
3 0.50
0.25
2 0.25
0.00
1 inside outside inside 0.00
outside inside outside
inside outside inside outside the VRinside outside the VR the VR inside
the VR the outside
VR the VR inside outside inside outside
the VR the VR the VR the VR the VR the VR the VR the VR the VR the VR the VR the VR
environment
environment environment
virtual realism abstract realistic
virtual realism abstract realistic virtual realism abstract realistic
Figure 3: Means and score variances of the presence measures. While presence scores of the three questionnaires did not differ
significantly between in- and outside the VR, variance measures show significant interaction effects between the questionnaire
environment and the realism during the VR experience. Error bars show 95% confidence intervals (CI95)
λ = .993, ηp2 = .061; however, there was a significant interac- Subscales
tion effect of Virtual Realism × Environment, F (1, 68) = The IPQ and WS questionnaires use subscales, which allow
2.826, p = .045, Wilk’s λ = .866,ηp2 = .133. Univariate anal- a more nuanced analysis and focusing on more components
ysis of variance (ANOVA) revealed no main or interaction of presence. The means of those subscales are shown in
effect on the variance of the SUS score, a significant interac- Figure 5.
tion effect of Virtual Realism × Environment on the IPQ,
F (1, 34) = 6.792, p = .013, and a significant interaction effect IPQ subscales. Considering general presence (GP) of the
on the variance of the WS, F (1, 34) = 10.981, p = .002. IPQ, there was a significant main effect of Virtual Real-
To determine if there were significant differences between ism, F (1, 34) = 10.206, p = .003; however, not of Environ-
the variance measures of the three questionnaires, we used ment, F (1, 34) = .040, p = .842, and no interaction effect
Questionnaire as additional IV and performed a three-way of Virtual Realism × Environment, F (1, 34) = .008, p =
ANOVA. .927. Spatial presence (SP) of the IPQ was neither affected
We found significant main effects of Questionnaire, by Virtual Realism, F (1, 34) = 2.093, p = .157 nor by
F (2, 204) = 11.860, p < .001, Virtual Realism, F (1, 204) = Environment, F (1, 34) = .062, p = .804, and there was
7.199, p = .007, and a significant interaction effect of Vir- no interaction effect of Virtual Realism × Environment,
tual Realism × Environment, F (1, 204) = 8.762, p = .003. F (1, 34) = .087, p = .768. Involvement (INV) was affected by
There were no further significant main or interaction ef- Virtual Realism, F (1, 34) = 6.851, p = .013; however, not
fects (all with p > .645). Bonferroni-corrected pairwise com- of Environment, F (1, 34) = .279, p = .600, and no interac-
parisons revealed a significant difference between the SUS tion effect of Virtual Realism × Environment, F (1, 34) =
(M = .848, SD = .576) and the WS (M = .451, SD = .318), 3.030, p = .090. And, for the realism (REAL) measure of
(p < .001), as well as the IPQ (M = .679, SD = .562) and the the IPQ, there was a significant main effect of Virtual Re-
WS (p = .013). alism, F (1, 34) = 24.082, p < .001, and on Environment,
Overall, the results show that the variance of the three F (1, 34) = 1.010, p < .001, and a significant interaction effect
questionnaires increased when participants left the VR after of Virtual Realism × Environment, F (1, 34) = 1.033, p <
an abstract scene and decreased when they left the VR after a .001.
realistic scene. This was not the case when participants filled
in the questionnaires in VR. As there were no interaction WS subscales. Considering the subscales of the WS presence
effects of the other factors with Questionnaires, we showed questionnaire, there was a significant main effect of Vir-
that the variance of the WS was generally lower than for the tual Realism, F (1, 34) = 6.963, p = .012; however, not of
SUS or the IPQ questionnaire. Environment, F (1, 34) = .055, p = .814, and no interac-
tion effect of Virtual Realism × Environment, F (1, 34) =
1.051, p = .312 on involvement (INV). On the natural (NAT)
subscale of the WS questionnaire, there was also a main
Paper 360 Page 6CHI 2019 Paper CHI 2019, May 4–9, 2019, Glasgow, Scotland, UK
SUS IPQ WS
8
inside the VR
6
4
2
0
count
10.0
outside the VR
7.5
5.0
2.5
0.0
1 2 3 4 5 6 7 1 2 3 4 5 6 7 1 2 3 4 5 6 7
score distribution
virtual realism abstract realistic
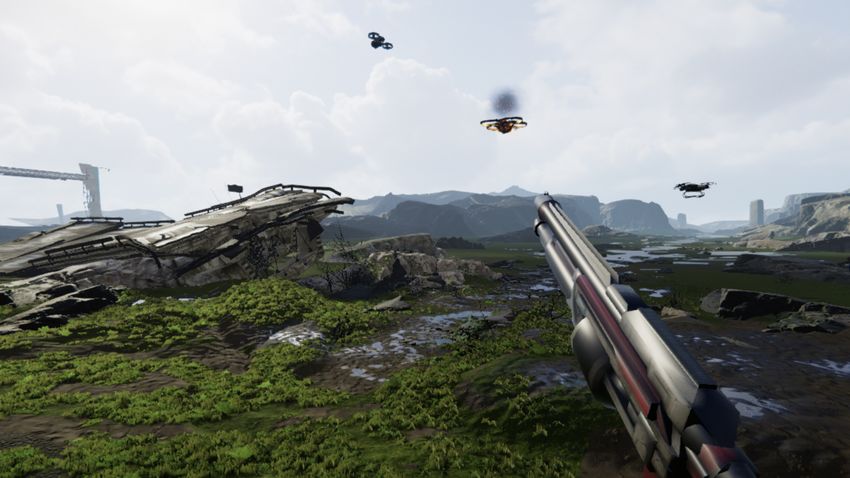
Figure 4: Histogram, means, and fitted Gaussian distribution using the average scores of all questionnaires. While the distribu-
tions remain nearly constant when the questionnaires are used in VR, there is a significant difference between the variances
in the real-world responses after BIP using abstract and after BIP using a realistic virtual scene.
effect of Virtual Realism, F (1, 34) = 14.908, p < .001; how- Reliability Analyses
ever, not of Environment, F (1, 34) = .209, p = .650, and Cronbach’s alpha estimates of reliability were used to deter-
no interaction effect of Virtual Realism × Environment, mine correlations between the questionnaires’ items and to
F (1, 34) = .448, p = .507. The auditory (AUD) scale of the WS assess internal consistency of each questionnaire. Internal
was significantly affected by Virtual Realism, F (1, 34) = consistency was acceptable for SUS (α = .75), good for IPQ
20.104, p < .001, and Environment, F (1, 34) = .637, p < (α = .87), good for WS (α = .82), and excellent when all
.001. We also found an interaction effect of Virtual Re- items were used (α = .91). The questions with the highest
alism × Environment, F (1, 34) = .412, p < .001. Haptics inter-correlations considering all questionnaire items were
(HAPTC) was neither significantly affected by Virtual Real- found in the IPQ questionnaire: IPQ6 with “I feel present in
ism, F (1, 34) = .307, p = .582, nor Environment, F (1, 34) = the virtual space” (ρ = .786), IPQ1 with “In the computer
.542, p = .466. There was no interaction effect of Virtual generated world I had a sense of ’being there”’ (ρ = .735), and
Realism × Environment, F (1, 34) = 1.692, p = .202. Res- IPQ10 with “I was completely captivated by the virtual world.”
olution (RES) of the WS was neither affected by Virtual (ρ = .719).
Realism, F (1, 34) = 0.255, p = .582, nor Environment,
F (1, 34) = .542, p = .466, and no interaction effect of Vir- Workload
tual Realism × Environment, F (1, 34) = 1.692, p = .202. To investigate if virtual questionnaires cause higher work-
Interface quality (IFQUAL) of the WS was neither affected load than questionnaires in the real-world, we performed
by Virtual Realism, F (1, 34) = .671, p = .582; however, not a one-way ANOVA on the NASA-Task Load Index (TLX)
of Environment, F (1, 34) < .001, p = .993, and no interac- scores, which were 33.16 (SD = 20.96) in VR and 37.77 (SD =
tion effect of Virtual Realism × Environment, F (1, 34) = 19.26) outside the VR. There were no significant effects, nei-
.012, p = .911. ther on the overall workload, F (1, 34) = .472, p = .497, nor
In sum, we observerd that most of the subscales within on its sub-scales (mental, physical, temporal, performance,
the IPQ and WS were not affected by the environment of effort, and frustration, all with p > .111). This indicates that
the questionnaires. Scores of realism of the IPQ and auditory completing the virtual questionnaire in VR had a negligible
features of the WS showed main and interaction effects with effect on the participants’ perceived workload.
virtual realism and environment, implying that those mea-
sures depend on the virtual scene presented beforehand and Questionnaire Completion Times
on the environment in which the sample was taken.
As the three questionnaires had different numbers of items
(SUS=6, IPQ=14, WS=32), a three-way ANOVA showed sig-
nificant main effects of Questionnaire on the completion
Paper 360 Page 7CHI 2019 Paper CHI 2019, May 4–9, 2019, Glasgow, Scotland, UK
IPQ Subscales
inside the VR outside the VR
7
6
mean ratings
5
4
3
2
1
GP SP INV REAL GP SP INV REAL
WS Subscales
virtual realism abstract realistic
inside the VR outside the VR
7
6
mean ratings
5
4
3
2
1
INV NAT AUD HAPTC RES IFQUAL INV NAT AUD HAPTC RES IFQUAL
virtual realism abstract realistic
Figure 5: Subscales of the IPQ and WS presence questionnaires. IPQ: General Presence (GP), spatial presence (SP), involvement
(INV), and realism (REAL); WS: Involvement (INV), natural (NAT), auditory (AUD), haptics (HAPTC), resolution (RES), and
interface quality (IFQUAL).
times as shown in Figure 6, F (2, 203) = 150.608, p < .001. 5 DISCUSSION
Bonferroni-corrected pairwise comparisons showed signif- We found a systematic increase of the questionnaires’ vari-
icant differences between the SUS (M = 1.107mins, SD = ance when the participants filled in the questionnaires in
.440), the IPQ (M = 2.449mins, SD = 1.054), and the WS the real-world after experiencing an abstract scene and a
(M = 5.982mins, SD = 2.733), all with p < .001. However, decrease after they experienced a realistic scene. This vari-
there were no further main or interaction effects of Virtual ance remained constant when the participants filled in the
Realism or Environment, all with p > .275. This means questionnaires in VR. The mean variance of the question-
that the speed with which the participants completed the naires was higher after experiencing a realistic scene than
questionnaire did not significantly change through leaving after an abstract scene; however, the questionnaire variance
the VR. in VR delivered similar results to the real-world and did not
To determine potential effects of gender and previous VR differ significantly. Thus, all presence questionnaires used
experience, all analyses were repeated considering both fac- (SUS, IPQ, WS) were still reliable tools to measure presence
tors as between-subject variables. None of the tests revealed even when participants were surveyed in VR. However, as
statistically significant effects. the interaction effects of the variance measures show, the
increased variability after experiencing an abstract scene
and after leaving the VR indicates that, potentially, more
Paper 360 Page 8CHI 2019 Paper CHI 2019, May 4–9, 2019, Glasgow, Scotland, UK
8 causes fatigue effects using long questionnaires. The lower
7 variance of the WS could also be caused by the conditions,
which are not exercising some of the factors. Nevertheless,
6
we found that the IPQ questionnaire includes three items
time in (mins)
5 with the highest inter-correlations among all items of the
4 three questionnaires. These questions (1, 6, and 10) are di-
rectly related to the feeling of being present in the virtual
3
world. Thus, we assume that the IPQ questionnaire best re-
2 flects the construct of presence.
1 Furthermore, we argue that our results justify a renewed
discussion of the question if a single score is sufficient to
0
SUS IPQ WS describe presence. The increased variability of the responses
Questionnaire and the contrast between a realistic and a less realistic scene
potentially indicates that a BIP occurs (cf. [36]). The likeli-
Figure 6: Completion times of the SUS, IPQ, and WS ques- hood that a difference between different levels of presence
tionnaire. Error bars show CI95. being detected is higher after experiencing an abstract scene
than after a realistic scene. Participants reflected that a BIP
occurred using a higher contrast in their ratings leading to
samples (and participants) are needed to reveal statistically higher variance in their presence scores. Hence, it is con-
significant results using questionnaires which are presented ceivable that a BIP counter or a variance measure can be an
in the real-world. Hence, the three questionnaires can pro- additional measure while using questionnaires [36].
vide more reliable and consistent results when measuring Some researchers argue that presence is a binary state –
presence in VR. a moment of time when a participant is experiencing the
We assume that removing the HMD and/or reorienting in sense of presence or not [36]. Consequently, the probability
the real-world increases the probability of a BIP occurring that a BIP is being perceived will be lower with scenarios
and potentially causes a state of confusion or uncertainty. similar to the real-world and can eventually no longer be
This increases the likelihood that ratings in the real-world determined using perfect technology. It is conceivable that
are higher (or lower) than in VR. This finding was supported the probability of a BIP occurring is potentially the more
by the variances of presence scores in VR, which were all reliable measure of presence than a simple score. However,
higher after experiencing an abstract scene and lower after we explicitly highlight that a BIP may occur not only af-
experiencing a realistic scene. This was also partially evident ter leaving the VR and through removing the headset but
by interaction effects of two subscale measures of the IPQ and also after leaving a scene within the VR. This means that
WS questionnaire: differences of the visual realism subscale the procedure of removing the headset is potentially not the
(IPQ) were lower in VR than outside the VR, while differences only trigger for a BIP occurring. Nevertheless, we argue that
of the auditory subscale measure were higher in VR than the variance in responses from real-world questionnaires is
outside the VR. Thus, the real-world responses increase the potentially an additional measure for the sense of presence
contrast of presence ratings. However, it should be noted when using presence questionnaires.
that the virtual copy of our laboratory can be a confound
in our presence measures. The environment was a real and
Limitations and Future Work
neutral setup, however, the effect of the virtual questionnaire
environment may have influenced those ratings. Currently, post-test questionnaires are the most frequently
There are previous discussions about which questionnaire used measures of presence in previous work. However, one
is the most appropriate measurement tool to determine pres- disadvantage of such questionnaires is that they rely on the
ence [33]. Objective signs of the reliability of a questionnaire subjects’ memories of the VR experience. Such memories
are variance and item correlation. The lowest variance was can reflect an inconsistent and incomplete picture of the
found for the questionnaire by Witmer and Singer [43]. This VR experience. Our questionnaires were presented in VR,
is probably due to the large number of items. While the SUS however, the participants were asked for the VR experience
and the IPQ questionnaire consist of 6 or 14 items, respec- after a scene change. Therefore, we recommend, for future
tively, the WS questionnaire uses 32 items. A higher number work, to use a measure for immersion at the moment when
of items potentially reduces the score variance, however, sig- it is perceived. As our results show, questionnaires in VR can
nificantly increases the time a participant needs to answer reduce the score variance and avoid a state of confusion or
the questions as shown in our results (Figure 6). It potentially uncertainty after leaving the VR and removing the HMD.
Paper 360 Page 9CHI 2019 Paper CHI 2019, May 4–9, 2019, Glasgow, Scotland, UK
We used two different scenes at different levels of real- constant for the conditions. This was not the case using ques-
ism to manipulate the sense of presence. As presence can tionnaires in the real-world. As the increased variance of
be affected by many factors such as engagement, involve- real-world questionnaires potentially requires a larger sam-
ment, and auditive cues, further work should investigate to ple to reveal statistically significant results between two or
which degree related factors contribute to the outcome. Fur- more conditions, we recommend using presence question-
thermore, we found that the differences between the scores naires in VR.
were relatively low despite the large audiovisual difference Finally, we recommend the IPQ questionnaire as the mea-
between the two virtual scenes. The least difference was sure of presence as it provides the highest reliability within
shown in the WS questionnaire, followed by IPQ and SUS. a reasonable timeframe. Furthermore, we conclude that the
Therefore, we suggest that future work should consider re- variance of the scores can potentially be utilized as an ad-
vised and optimized questionnaires for use in VR. We also ditional measure of presence as it can help to assess if a
note that the virtual copy of our laboratory could have been BIP occurred. More research is needed to adapt presence
a confounding variable in our presence measure. Despite the questionnaires for VR applications.
fact that both environments were clean and simple settings,
the effect of realism in the virtual questionnaire environ- ACKNOWLEDGMENTS
ment may have influenced the ratings. We highlight that This work was supported by the German Federal Ministry
measuring presence in VR potentially differs from measur- of Education and Research as part of the project Be-greifen
ing presence when experiencing the actual condition. (Grant No. 16SV7527) and the German Research Foundation
We assume that there is a relationship between the proba- (DFG) within project C04 of SFB/Transregio 161.
bility that a BIP occurs and the increased variance of presence
scores. As a BIP may occur not only after leaving the VR REFERENCES
but also after scene changes within the VR, more research is [1] Rosa María Baños, Cristina Botella, Mariano Alcañiz, Víctor Liaño,
needed to determine the precise context of this relationship Belén Guerrero, and Beatriz Rey. 2004. Immersion and Emotion: Their
Impact on the Sense of Presence. CyberPsychology & Behavior 7, 6
to develop a reliable measure of presence in VR. We found
(2004), 734–741. https://doi.org/10.1089/cpb.2004.7.734
no effect on the perceived workload between questionnaires [2] Rosa María Baños, Cristina Botella, Azucena Garcia-Palacios, He-
presented in the real-world and in VR, however, the work- lena Villa, Concepción Perpiñá, and Mariano Alcaniz. 2000. Pres-
load between the questionnaires itself was not determined. ence and Reality Judgment in Virtual Environments: A Unitary Con-
Future studies could investigate if and how the number of struct? CyberPsychology & Behavior 3, 3 (2000), 327–335. https:
//doi.org/10.1089/10949310050078760
items of a questionnaire affects the presence and how the
[3] Woodrow Barfield and Suzanne Weghorst. 1993. The Sense of Presence
interaction with questionnaires can be optimized to avoid a within Virtual Environments: A Conceptual Framework.. In HCI (2),
BIP through the questionnaire itself. Furthermore, to com- Gavriel Salvendy and Michael J. Smith (Eds.). Elsevier, 699–704. 0-444-
pare virtual and real questionnaires, we used the Oculus 89540-X.
Touch controller for questionnaire input. However, in the [4] Dongsik Cho, Jihye Park, G. J. Kim, Sangwoo Hong, Sungho Han,
and Seungyong Lee. 2003. The dichotomy of presence elements: the
real-world, presence questionnaires are usually presented
where and what. In IEEE Virtual Reality, 2003. Proceedings. 273–274.
on paper and answered using a pen. A comparison of input https://doi.org/10.1109/VR.2003.1191155
techniques was not performed in our study and could also [5] Elizabeth Dean, Joe Murphy, and Sarah Cook. 2009. Social presence in
be subject of future work. virtual world surveys. In Proceedings of The 12th Annual International
Workshop on Presence.
6 CONCLUSION [6] Huong Q. Dinh, Neff Walker, Chang Song, Akira Kobayashi, and
Larry F. Hodges. 1999. Evaluating the Importance of Multi-sensory
Presence questionnaires in VR can help researchers in their Input on Memory and the Sense of Presence in Virtual Environments.
experiments in multiple ways: Participants do not have to In Proceedings of the IEEE Virtual Reality (VR ’99). IEEE Computer
remove their HMD or put it on again to experience the next Society, Washington, DC, USA.
condition in VR. Presence questionnaires in VR can reduce [7] Jonathan Freeman, S. E. Avons, Don E. Pearson, and Wijnand A. IJssel-
steijn. 1999. Effects of Sensory Information and Prior Experience
the time for adjusting in the real and virtual world again.
on Direct Subjective Ratings of Presence. Presence: Teleoperators
Distracting or biasing cues from the real-world, such as the and Virtual Environments 8, 1 (1999), 1–13. https://doi.org/10.1162/
experimenter or experimental setup, can be reduced when 105474699566017
the participant remains in the VR during the experiment. [8] Julian Frommel, Katja Rogers, Julia Brich, Daniel Besserer, Leonard
The results of our study which used three standardized ques- Bradatsch, Isabel Ortinau, Ramona Schabenberger, Valentin Riemer,
Claudia Schrader, and Michael Weber. 2015. Integrated Questionnaires:
tionnaires indicate that answering questionnaires in VR does
Maintaining Presence in Game Environments for Self-Reported Data
not affect the means of their measures. As questionnaires Acquisition. In Proceedings of the 2015 Annual Symposium on Computer-
in VR decrease the chance of a BIP occurring, the variance Human Interaction in Play (CHI PLAY ’15). ACM, New York, NY, USA,
of the measure from the VR questionnaire remains nearly 359–368.
Paper 360 Page 10CHI 2019 Paper CHI 2019, May 4–9, 2019, Glasgow, Scotland, UK
[9] Michael Gerhard, David J. Moore, and Dave J. Hobbs. 2001. Continuous [25] Louis Barry Rosenberg. 1994. &Ldquo;Virtual Fixtures&Rdquo;: Per-
Presence in Collaborative Virtual Environments: Towards a Hybrid ceptual Overlays Enhance Operator Performance in Telepresence Tasks.
Avatar-Agent Model for User Representation. In Proceedings of the Ph.D. Dissertation. Stanford, CA, USA. UMI Order No. GAX95-08441.
Third International Workshop on Intelligent Virtual Agents (IVA ’01). [26] Maria V. Sanchez-Vives and Mel Slater. 2005. From presence to con-
Springer-Verlag, London, UK, UK, 137–155. http://dl.acm.org/citation. sciousness through virtual reality. Nature reviews. Neuroscience 6, 4
cfm?id=648034.744242 (2005), 332–339. https://doi.org/10.1038/nrn1651
[10] Brent Insko. 2003. Measuring presence: Subjective, behavioral and [27] Thomas Schubert, Frank Friedmann, and Holger Regenbrecht. 2001.
physiological methods. (2003). The Experience of Presence: Factor Analytic Insights. Presence: Tele-
[11] Jason Jerald. 2016. The VR Book: Human-Centered Design for Virtual operators and Virtual Environments 10, 3 (2001), 266–281. https:
Reality. Association for Computing Machinery and Morgan & //doi.org/10.1162/105474601300343603
Claypool, New York, NY, USA. [28] Thomas W Schubert. 2003. The sense of presence in virtual envi-
[12] Taeyong Kim and Frank Biocca. 1997. Telepresence via television: ronments: A three-component scale measuring spatial presence, in-
Two dimensions of telepresence may have different connections to volvement, and realness. Zeitschrift für Medienpsychologie 15, 2 (2003),
memory and persuasion. Journal of computer-mediated communication 69–71.
3, 2 (1997). https://doi.org/10.1111/j.1083-6101.1997.tb00073.x [29] Valentin Schwind, Pascal Knierim, Lewis Chuang, and Niels Henze.
[13] Michael Krauss, Rainer Scheuchenpflug, Walter Piechulla, and Alf 2017. "Where’s Pinky?": The Effects of a Reduced Number of Fingers in
Zimmer. 2001. Measurement of presence in virtual environments. Virtual Reality. In Proceedings of the Annual Symposium on Computer-
Experimentelle Psychologie im Spannungsfeld von Grundlagenforschung Human Interaction in Play (CHI PLAY ’17). ACM, New York, NY, USA,
und Anwendung Proceedings (2001), 358–362. 507–515. https://doi.org/10.1145/3116595.3116596
[14] Jane Lessiter, Jonathan Freeman, Edmund Keogh, and Jules Davidoff. [30] Valentin Schwind, Pascal Knierim, Cagri Tasci, Patrick Franczak, Nico
2001. A Cross-Media Presence Questionnaire: The ITC-Sense of Pres- Haas, and Niels Henze. 2017. "These Are Not My Hands!": Effect
ence Inventory. Presence: Teleoperators and Virtual Environments 10, 3 of Gender on the Perception of Avatar Hands in Virtual Reality. In
(2001), 282–297. https://doi.org/10.1162/105474601300343612 Proceedings of the 2017 CHI Conference on Human Factors in Computing
[15] Matthew Lombard and Theresa Ditton. 1997. At the heart of it all: The Systems (CHI ’17). ACM, New York, NY, USA, 1577–1582. https://doi.
concept of presence. Journal of Computer-Mediated Communication 3, org/10.1145/3025453.3025602
2 (1997). https://doi.org/10.1111/j.1083-6101.1997.tb00072.x [31] Thomas B. Sheridan. 1992. Musings on Telepresence and Virtual
[16] Matthew Lombard, Theresa B Ditton, Daliza Crane, Bill Davis, Gisela Presence. Presence: Teleoper. Virtual Environ. 1, 1 (1992), 120–126.
Gil-Egui, Karl Horvath, Jessica Rossman, and S Park. 2000. Measuring [32] Valerie J Shute. 2011. Stealth assessment in computer-based games
presence: A literature-based approach to the development of a stan- to support learning. Computer games and instruction 55, 2 (2011),
dardized paper-and-pencil instrument. In Third international workshop 503–524.
on presence, delft, the netherlands, Vol. 240. 2–4. [33] Mel Slater. 1999. Measuring Presence: A Response to the Witmer and
[17] Matthew Lombard, Theresa B. Ditton, and Lisa Weinstein. 2009. Mea- Singer Presence Questionnaire. Presence: Teleoper. Virtual Environ. 8, 5
suring presence: the temple presence inventory. In Proceedings of the (1999), 560–565. https://doi.org/10.1162/105474699566477
12th Annual International Workshop on Presence. 1–15. [34] Mel Slater. 2004. How Colorful Was Your Day? Why Questionnaires
[18] Michael Meehan, Brent Insko, Mary Whitton, and Frederick P. Brooks, Cannot Assess Presence in Virtual Environments. Presence: Tele-
Jr. 2002. Physiological Measures of Presence in Stressful Virtual Envi- operators and Virtual Environments 13, 4 (2004), 484–493. https:
ronments. In Proceedings of the 29th Annual Conference on Computer //doi.org/10.1162/1054746041944849
Graphics and Interactive Techniques (SIGGRAPH ’02). ACM, New York, [35] Mel Slater, John McCarthy, and Francesco Maringelli. 1998. The Influ-
NY, USA, 645–652. https://doi.org/10.1145/566570.566630 ence of Body Movement on Subjective Presence in Virtual Environ-
[19] Marvin Minsky. 1980. Telepresence. Omni (1980), 45–51. ments. Human Factors 40, 3 (1998), 469–477. https://doi.org/10.1518/
[20] Sarah Nichols, Clovissa Haldane, and John R. Wilson. 2000. Mea- 001872098779591368
surement of presence and its consequences in virtual environments. [36] Mel Slater and Anthony Steed. 2000. A Virtual Presence Counter.
International Journal of Human-Computer Studies 52, 3 (2000), 471 – Presence: Teleoperators and Virtual Environments 9, 5 (2000), 413–434.
491. https://doi.org/10.1006/ijhc.1999.0343 https://doi.org/10.1162/105474600566925
[21] Kristine L. Nowak and Frank Biocca. 2003. The effect of the agency [37] Mel Slater and Martin Usoh. 1993. Presence in immersive virtual envi-
and anthropomorphism on users’ sense of telepresence, copresence, ronments. In Proceedings of IEEE Virtual Reality Annual International
and social presence in virtual environments. Presence: Teleoperators & Symposium. 90–96. https://doi.org/10.1109/VRAIS.1993.380793
Virtual Environments 12, 5 (2003), 481–494. [38] Martin Usoh, Kevin Arthur, Mary C. Whitton, Rui Bastos, Anthony
[22] Sandra Poeschl and Nicola Doering. 2015. Measuring Co-Presence and Steed, Mel Slater, and Frederick P. Brooks, Jr. 1999. Walking > Walking-
Social Presence in Virtual Environments - Psychometric Construction in-place > Flying, in Virtual Environments. In Proceedings of the 26th
of a German Scale for a Fear of Public Speaking Scenario. Studies in Annual Conference on Computer Graphics and Interactive Techniques
health technology and informatics 219 (2015), 58–63. https://doi.org/ (SIGGRAPH ’99). ACM Press/Addison-Wesley Publishing Co., New
10.3233/978-1-61499-595-1-58 York, NY, USA, 359–364. https://doi.org/10.1145/311535.311589
[23] Holger Regenbrecht and Thomas Schubert. 2002. Real and Illusory [39] Martin Usoh, Ernest Catena, Sima Arman, and Mel Slater. 2000. Us-
Interactions Enhance Presence in Virtual Environments. Presence: ing Presence Questionnaires in Reality. Presence: Teleoperators and
Teleoperators and Virtual Environments 11, 4 (2002), 425–434. https: Virtual Environments 9, 5 (2000), 497–503. https://doi.org/10.1162/
//doi.org/10.1162/105474602760204318 105474600566989
[24] Holger Regenbrecht, Thomas Schubert, and Frank Friedmann. 1998. [40] Dimitar Valkov and Steffen Flagge. 2017. Smooth Immersion: The
Measuring the Sense of Presence and its Relations to Fear of Heights Benefits of Making the Transition to Virtual Environments a Con-
in Virtual Environments. International Journal of HumanâĂŞCom- tinuous Process. In Proceedings of the 5th Symposium on Spatial
puter Interaction 10, 3 (1998), 233–249. https://doi.org/10.1207/ User Interaction (SUI ’17). ACM, New York, NY, USA, 12–19. https:
s15327590ijhc1003_2 //doi.org/10.1145/3131277.3132183
Paper 360 Page 11CHI 2019 Paper CHI 2019, May 4–9, 2019, Glasgow, Scotland, UK
[41] Minjuan Wang, Sabine Lawless-Reljic, Marc Davies, and Victor [43] Bob G. Witmer and Michael J. Singer. 1998. Measuring Presence
Callaghan. 2011. Social Presence in Immersive 3D Virtual Learning En- in Virtual Environments: A Presence Questionnaire. Presence: Tele-
vironments. In Ambient Intelligence - Software and Applications, Paulo operators and Virtual Environments 7, 3 (1998), 225–240. https:
Novais, Davy Preuveneers, and Juan M. Corchado (Eds.). Springer //doi.org/10.1162/105474698565686
Berlin Heidelberg, Berlin, Heidelberg, 59–67. [44] Jacob O. Wobbrock, Leah Findlater, Darren Gergle, and James J. Hig-
[42] Bob G. Witmer, Christian J. Jerome, and Michael J. Singer. 2005. The gins. 2011. The Aligned Rank Transform for Nonparametric Factorial
Factor Structure of the Presence Questionnaire. Presence: Teleoper. Analyses Using Only Anova Procedures. In Proceedings of the SIGCHI
Virtual Environ. 14, 3 (2005), 298–312. https://doi.org/10.1162/ Conference on Human Factors in Computing Systems (CHI ’11). ACM,
105474605323384654 New York, NY, USA, 143–146. https://doi.org/10.1145/1978942.1978963
Paper 360 Page 12You can also read