EASTERN COUGAR (Puma concolor couguar) - HABITAT SUITABILITY ANALYSIS FOR THE CENTRAL APPALACHIANS
←
→
Page content transcription
If your browser does not render page correctly, please read the page content below
EASTERN COUGAR
(Puma concolor couguar)

                                                                 © 1990 Michael McNelly

HABITAT SUITABILITY ANALYSIS
          FOR THE CENTRAL APPALACHIANS

         Kristin Taverna, Jason E. Halbert, and David M. Hines
                  Appalachian Restoration Campaign
                        A Project of Heartwood
Please note that the Appalachian Restoration Campaign ceased operations in 2000. Similar work is currently carried out by the
non-profit Wild Virginia (www.wildvirginia.org).

Current contact information for the authors as of October 20005 is as follows:

Kristin Taverna, kristin@wildvirginia.org or kristin.taverna@dcr.virginia.gov

Jason Halbert, jhalbert@wildvirginia.org

David M. Hines, david_hines@fws.gov

                                               © Copyright 1999

                            Appalachian Restoration Campaign
                            PO Box 2786
                            Charlottesville, VA 22902
                            (804) 971-3898 (804) 970-1806 fax
                             arcmaps@firstva.com
                            www.heartwood.org/ARC

                            HEARTWOOD
                            PO Box 1424
                            Bloomington, IN 47402
                            (812) 337-8898 (812) 337-8892 fax
                            inform@heartwood.org
                            www.heartwood.org
                                                                                                                       2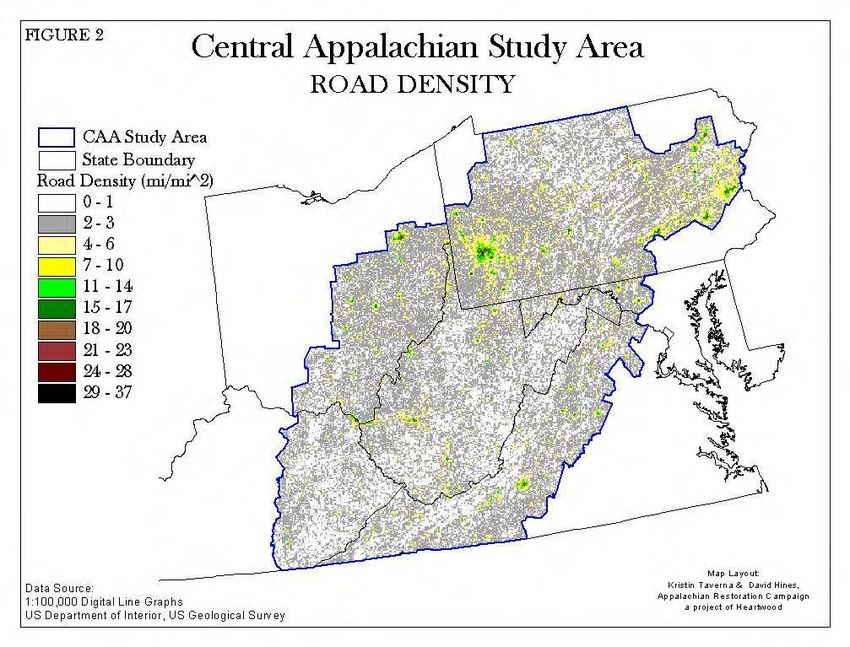
EASTERN COUGAR (Puma concolor couguar)
                        A HABITAT SUITABILITY ANALYSIS
                        FOR THE CENTRAL APPALACHIANS
                            Kristin Taverna, Jason E. Halbert, and David M. Hines
                                     Appalachian Restoration Campaign
                                           A Project of Heartwood
Abstract:
        The Appalachian Restoration Campaign (ARC) is dedicated to the restoration and protection of Central Appalachian
        wildlands by developing an interconnected system of reserves in which human activity is compatible with ecological
        recovery and health. The core of this project is the Central Appalachian Assessment (CAA), focusing on a regional
        study area that encompasses portions of six states throughout the Central Appalachians. Part I of this Assessment
        includes an examination of the current landscape within the study area and its suitability for supporting the eastern
        cougar (Puma concolor couguar). Suitable cougar habitat still exists within the Central Appalachians, yet prior
        studies have not examined the location or availability of habitat. The cougar stands out as an umbrella species for
        habitat management due to its extensive home range. If we protect the habitat that falls under this protective
        “umbrella”, we could effectively provide for the habitat needs of a number of other species throughout the region.
        Using GIS software, this analysis identifies suitable cougar habitat based on the landscape characteristics of prey
        density, road density, human population density, and land use. The data for each layer was reclassified and ranked
        from 1 to 10 according to its suitability as cougar habitat. The highest suitability rating (10) was given to the
        categories of lowest road density, lowest human population density, highest deer density, and forest habitat. The
        reclassified data layers were added using ArcView to create a final composite map, with a total score calculated for
        each cell of 5.5 mi2 (14.2 km2). The composite scores for the CAA study area range from 8 to 40, with 40 being
        those cells most suitable as cougar habitat. The greatest density of high suitability cells within the CAA study area
        (total score 37 - 40) is located within the central to northwest section of West Virginia. There are also smaller areas
        of dense cells with a high suitability rating (total score 34-40) located in northeastern West Virginia and in northwest
        Pennsylvania. In addition, a large portion of cells which received a high suitability rating (total score 32-40) are
        located along the Appalachian mountain chain and within the northern Allegheny plateau. Additional research is
        necessary to further identify specific areas of suitable habitat on a smaller scale and to examine these areas in terms
        of property ownership and current protection status.

                        Introduction                                  focusing on a study area that encompasses all of West
                                                                      Virginia and portions of Virginia, Maryland, Kentucky,
There is a growing recognition among the scientific                   Ohio, and Pennsylvania (Figure 1).
community that in order to effectively conserve biological
diversity in the long term, conservation plans need to                Part One of the CAA, entitled “Assessing Current
encompass large areas, on the order of tens to hundreds of            Ecological Conditions in Central Appalachia,” examines a
thousands of square kilometers (Noss et al. 1996, Noss &              defined study area through a Geographic Information
Cooperrider 1994). It is not likely that governments will             Systems spatial database. Representation of native
initiate regional conservation planning since there are few           biodiversity and current ecological conditions are
legislative precedents and multi-state planning is not in             examined using both coarse and fine filter approaches.
keeping with American political traditions. The                       Elemental occurrences of all rare, threatened and
Appalachian Restoration Campaign (ARC) utilizes                       endangered species were overlaid with ecological regions
geographic information systems (GIS), for large-scale                 (Keys et al. 1995, Omernik 1987, 1995) to provide a fine
conservation      planning    throughout     the    Central           filter examination of existing conditions. Additional
Appalachian mountains and plateaus.                                   layers will be added as the analysis reveals new questions
                                                                      and new results. Our coarse filter includes the present
Through ecological research, education, and advocacy,                 examination of the central Appalachian landscape and its
ARC works to develop and forward an interconnected                    suitability for supporting the eastern cougar (Puma
system of reserves where human activity is compatible                 concolor couguar). The results will enable Part Two of
with ecological recovery and health. The core of this                 the Central Appalachian Assessment, and an evaluation of
project is the Central Appalachian Assessment (CAA),                  current protected lands.
                                                                                                                                   3
disturbance regimes within a network of protected lands
Once roaming throughout the eastern United States and         (Noss & Cooperrider 1994).
beyond, the cougar stands out as an umbrella species for
habitat management due to its extensive home range.                     Background on the Eastern Cougar
Depending on the prey density, location of other cougars,
and type of landscape, the home-range for an individual       “There is no such thing as a good or bad species. A
adult male can range anywhere between 15 to 125 mi2           species may get out of hand, but to terminate its
(~40-325 km2) (Anderson 1983, Hornocker 1970,                 membership in the land by human fiat is the last word in
Seidensticker 1973, Wright 1972, USFWS 1991). The             anthropomorphic arrogance.” Aldo Leopold-A Sand
data for home range size is based on male cougars             County Almanac
because males typically have larger home ranges than
resident females and male territories generally do not        Commonly known as cougar, puma, catamount, mountain
overlap, whereas females share some common areas              lion, panther, or painter, Puma concolor once thrived
(Anderson 1983, Linzey 1987). According to studies done       throughout Appalachia and beyond. Its home range
in the western US, the minimum habitat area needed to         originally covered ground from the Yukon territory,
support a cougar population of about 15-20 adults lies        Canada, across North America, to the southern tip of
between 390 and 850 mi2 (1000-2200 km2) (Beier 1993).         South America. With habitat requirements that allow for
Although there are no documented viable populations of        such a diversity of climate and ecosystems, the cougar is
cougars in the Appalachians, theoretically, if we protect     considered one of the most adaptable large mammals in
what suitable cougar habitat is left, this landscape          existence (Bolgiano 1995, Brocke 1981, Wright 1972).
“umbrella” would theoretically benefit and support the        Yet, as recent history has shown, the cougar’s adaptability
habitat needs of many other species throughout the region     and range throughout the east have been severely
(Noss & Cooperrider 1994, Noss et al. 1996, Havlick           threatened by extirpation and habitat loss due to human
1998).                                                        development.

The Eastern Cougar Habitat Suitability Analysis is a tool     As European settlers moved into the vast wilderness
for identifying those areas within the Central                throughout the East and cleared the land, the cougar faced
Appalachians that could fulfill the habitat requirements      unrelenting persecution. Such a large predator was viewed
for the largest obligate carnivore in the east. Before the    as a personal threat and completely incompatible with
early 1900’s, cougars roamed throughout the eastern           raising livestock. Widespread bounty hunting of cougars,
forests. Excluding the Florida panther (Puma concolor         a severe decline in deer populations, and the loss of
coryi), cougars are now considered extirpated from the        forested habitat during the 1800’s and early 1900’s, led to
east and, as discussed above, there are currently no          the virtual extinction of the eastern cougar by the turn of
documented viable populations of cougars in the               the century (Bolgiano 1995, Downing 1981, Parker 1998,
Appalachians. As a result, there is very little data          Wright 1972, Young & Goldman 1946).
available on the biology and habitat requirements of the
eastern cougar (Puma concolor couguar). The only large        As cougar populations declined, so did the habitat
collection of scientific data available on Puma concolor      necessary to support a viable population in the east. The
comes from studies done in the western U.S. Although          development of roads, agricultural lands, and urban
the native temperate ecosystems of the east are quite         expansion fragmented once contiguous natural
different from many western environments, the western         communities. Such development and loss of habitat
data can be used as a guideline to help identify              continues largely unabated today as human population
characteristics of suitable habitat in the east (Bolgiano     increases throughout the east.
1995, Brocke 1981, Wright 1972). As such, the biology
and habitat requirements for the cougar are generally         Yet all suitable habitat is not lost. Over the last century,
defined within this analysis based on western data.           abandoned agricultural fields and cleared land have
                                                              slowly converted back into forest, and many continue to
The information gained from this analysis can then be         believe that the rugged mountains and forested valleys of
used in conjunction with additional CAA priority              the Appalachians provide sanctuary for small, isolated
restoration criteria to identify and map linkages between     populations of eastern cougars (Parker 1998). Such claims
these areas to insure animal and plant migration corridors.   are given further credence by the fact that cougar
The proposed reserve network would represent native           sightings and sign have continued throughout the
ecosystems, support native plant and animal populations,      Appalachians even as cougar habitat has grown more
and allow for natural evolutionary processes and              fragmented and developed.
                                                                                                                        4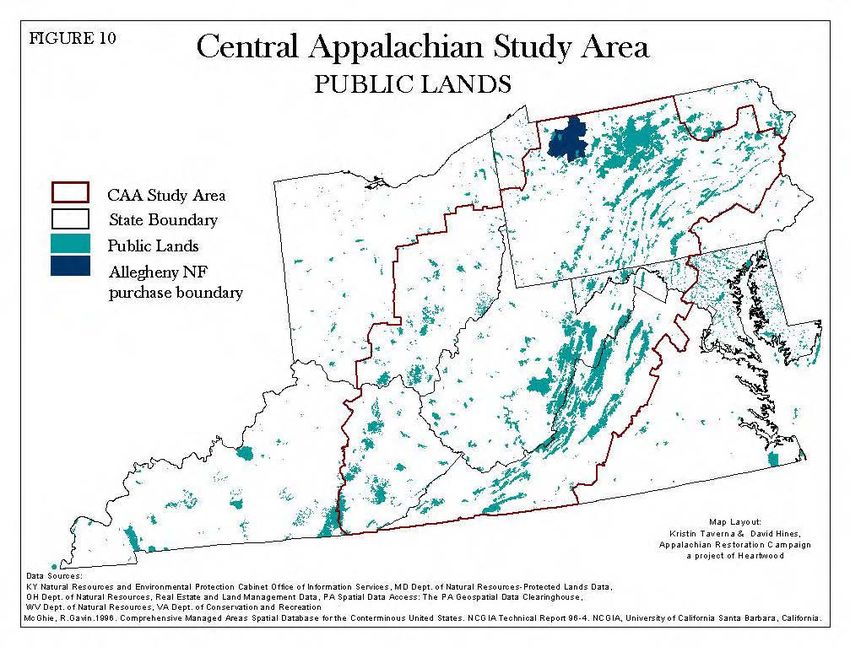
West Virginia. Two days later, a female cougar (some
Following the decline of eastern cougar populations in the     reports say she was pregnant) was captured by the WV
early 1900’s, cougar sightings did not increase                Department of Natural Resources in the same vicinity
significantly until after the white-tailed deer population     (Pocahontas Times 1976). The female cougar was later
was restocked and protected in the 1930’s (Bolgiano            brought to the French Creek Game Farm in Buckhannon,
1995, Downing 1981). By the 1950’s and 1960’s, the             WV, and ultimately sold to a zoo in Pennsylvania (Ashe
number of cougar sightings had increased dramatically.         1976, Vanscoy 1999). The mystery and lack of paper
This increase in sightings gained the attention of wildlife    trails surrounding the Pennsylvania and West Virginia
agencies and the eastern cougar subspecies (Puma               cougars typify the treatment of such situations by state
concolor couguar) was listed as a protected animal in the      and federal agencies. Freedom of Information Act
1973 Endangered Species Act (Bolgiano 1995).                   requests to pertinent agencies revealed little more than
                                                               newspaper accounts.
By the late 1970’s, a number of cougar sightings were
reported in and near the Nantahala National Forest of the      Of the remaining states within the Central Appalachian
Great Smoky Mountains in North Carolina. Several               study area, the last documented cougar kill or capture took
groups threatened to sue the U.S. Forest Service unless it     place in Ohio in the 1960s, Maryland in the 1920s,
protected the habitat and halted all timber extraction on a    Virginia in 1882, and Kentucky in 1863 (Bolgiano 1995,
112 mi2 (290 km2) tract of land within the Nantahala           Danz 1999, Downing 1981, East 1979, Parker 1998,
National Forest (Downing 1981, Bolgiano 1995). The             Wright 1972, Young & Goldman 1946).
U.S. Fish and Wildlife Service responded to this threat by
joining with the Forest Service to sponsor a field study to    Within the past five years, the Extension Wildlife
officially determine the status of the cougar in the           Specialist at the University of California has confirmed
southern Appalachians. The study was lead by wildlife          two sets of tracks found in West Virginia. One set, found
biologist, Robert Downing. After three years of snow and       in Wyoming County, West Virginia in 1996, was
dirt tracking along the Blue Ridge Mountains and within        confirmed as the right front foot of an adult male. The
various national forests, the study produced only one track    second set was found in the summer of 1998, in Mingo
and one scat suspected to be cougar (Downing 1981). Yet        County, West Virginia, and was confirmed as an adult
according to Downing, tracking conditions were rarely          female (Lester 1999).
ideal, and few areas were searched intensively enough to
say with high certainty that cougars were not present          All the cougar captures and sign that have occurred since
(Downing 1996). But due to a lack of indisputable sign,        the mid 1900s have raised important, yet difficult,
Downing had to report that he was unable to confirm self-      questions among cautious wildlife biologists. How many
sustaining populations of cougars (Downing 1981). For          of these animals were born in the wild as free-roaming
federal and state wildlife agencies, this report settled the   cougars, or how many were bred in captivity and released
controversial matter of the eastern cougar and concerns        by their owners? For the cougars captured and killed in
for the cougar could no longer justifiably affect federal      West Virginia in 1976, it was assumed that both had been
policy.                                                        released from captivity since they appeared to be tame
                                                               and showed no fear of humans (Ruckel 1976). For the
The release of Downing’s study in 1981 did nothing to          cougar killed in Pennsylvania, there was no evidence that
quell the number of cougar sightings throughout the east.      it had ever been in captivity (Wright 1972).
Yet many wildlife biologists do not consider sightings to
be proof of cougar presence since there are numerous           Currently, if any cougar is found outside of captivity, state
cases of reports mistaking animals such as bobcat, deer, or    wildlife agencies must determine whether or not the
large dogs, as cougars (East 1979). Unless the sightings       cougar is of the eastern cougar subspecies, Puma concolor
are reported by a credible source, such as a trained           couguar. Only the native eastern subspecies and the
biologist, or are coupled with hard evidence, most state       Florida Panther, Puma concolor coryi, are protected under
wildlife agencies dismiss them.                                the Endangered Species Act. Based on this classification
                                                               system, any cougar that is determined to be within another
The most convincing evidence of cougar presence is             subspecies is considered unprotected (Bolgiano 1995).
clearly when a live cougar is captured or killed. In 1967      For some state and federal wildlife agencies, this is reason
an immature female cougar was killed in northwestern           enough to dismiss the need to further study particular
Pennsylvania (Parker 1998, Wright 1972). Although              cougar findings and offer no protection if the cougar is
opinions of the details vary, in April of 1976, a young        not an “eastern” cougar (Bolgiano 1996, Parker 1998,
male cougar was killed by a farmer in Pocahontas County,       Tischendorf 1999).
                                                                                                                          5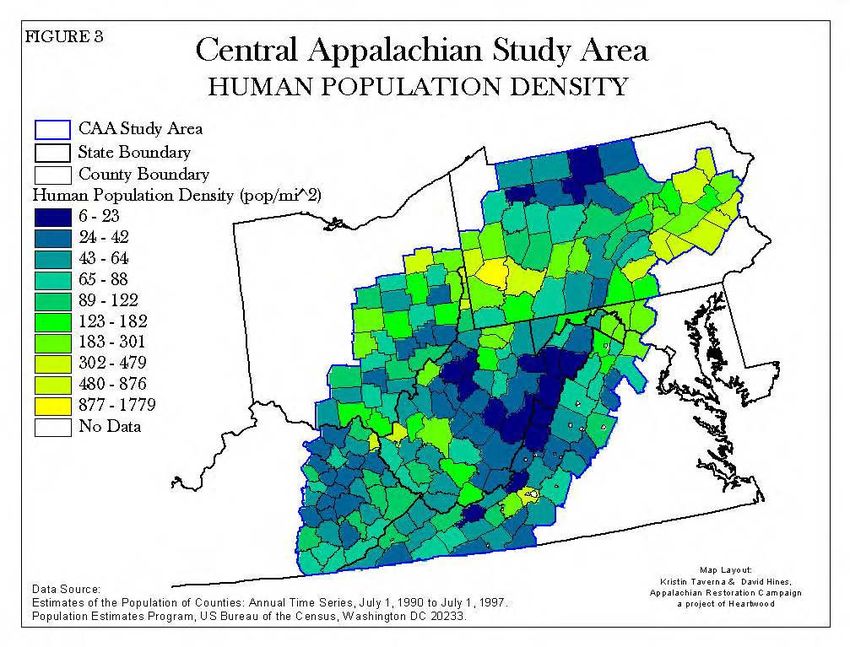
Under the current taxonomic classification, there are 32     Puma concolor couguar, could have both positive and
subspecies of Puma concolor (Culver 1999). The               negative effects in terms of eastern cougar protection.
subspecies designation of the eastern cougar was created a
half century ago, primarily based on skull measurements      The term "eastern" would no longer signify a distinct
(Anderson 1983, Bolgiano 1995, Parker 1998, Wright           subspecies, but more accurately, a specific geographic
1972). With a home-range that can encompass over a           population. With a large viable population of cougars
hundred square miles, there has been a wide dispersal of     currently living in the west, a single subspecies
genetic material throughout the region and across the US     designation could spur an attempt to take the eastern
(Brocke 1981, Linzey 1987, Noss 1996, Parker 1998).          cougar off of the Endangered Species list. US Fish and
Although small regional variations may occur among           Wildlife Service officials currently want to delist the
certain populations of cougars, there are no obvious         "eastern" cougar. If left on the Endangered Species List,
differences in physical characteristics of Puma concolor     the animal, regardless of its anthropogenic name, could
to support the need for 32 subspecies (Parker 1998).         still be protected as a distinct population segment if more
                                                             cougars were to recolonize the east. This change in
Recent cougar studies of Felid systematics based on          classification would not allow state and federal wildlife
genetic data rather than physical characteristics show a     agencies to make the popular claim that any cougar in the
need to reclassify the subspecies designations for Puma      east is a released or escaped western cat, thereby avoiding
concolor. Melanie Culver, working under feline geneticist    protection under the Endangered Species Act.
Stephen O’Brien at the University of Maryland, recently
finished her dissertation addressing the genetic              Justified or not, most federal and state wildlife agencies
geographic variation among cougar populations, taking        are unwilling to do a long-term study of cougar
into account evolutionary mechanisms, population             populations, or the potential for them, in the
structure and ecology (Culver 1996,1999). The study          Appalachians. At this time ARC does not recommend any
collected and examined biological samples from 315           reintroduction effort; public and agency sentiment
cougars throughout their entire range and the samples        towards the cougar seems too hostile. It is our hope that
included 1 to 35 animals from each of the 32 subspecies      this study will initiate further research and, along with the
(Culver 1999). Each sample went through genetic              important work of others like the Eastern Cougar
analyses and based on the results she concluded,             Foundation, spark renewed interest and support for
                                                             cougars in the east.
    there is no basis for maintaining 32 subspecies.
    Instead the use of six subspecies is recommended,        Whether cougars residing in the east are native,
    adopting the oldest name among the subspecies            biologically distinct, eastern cougars, or animals pushing
    that are combined. All temperate North American          back into their former range, or even captively bred free
    subspecies (north of Nicaragua) should be                cats, we must learn to respect and protect one of North
    recognized as different populations of a single          Americas most important predators. The importance of
    subspecies. Since Puma concolor couguar is the           education on cougars and other predators cannot be
    oldest named subspecies among the 15 North               overstated.
    American subspecies, it is further recommended
    that all pumas north of Nicaragua be recognized             Central Appalachian Study Area Description
    as Puma concolor couguar. The DNA analyses
    also showed one subspecies occurring in Central          The habitat suitability analysis is a regional study,
    America and four others in South America. The            focused on an area encompassing all of West Virginia, the
    similarity within and among the six groups is            plateaus and ridges of Pennsylvania, southeastern Ohio,
    perhaps more important to consider than the              eastern Kentucky, and western Virginia; we call this area
    differences (Culver 1999).                               "Central Appalachia." The Central Appalachian study
                                                             area is a total of 107,644 mi2. The region hosts a range of
The release of Culver’s dissertation has led to an
                                                             forest ecosystems and topography. Spanning north to
increased interest in systematic revisions for all
                                                             south along the western edge of the study area is the
subspecies of Puma concolor. As more research is done
                                                             Appalachian plateau, made of the Allegheny plateau in
on the cougar subspecies designations, the need to revise
                                                             the north and the Cumberland plateau in the south. East of
the current designations will potentially gain more
                                                             the plateau, the region rises in elevation to form the
support. The reclassification of all temperate North
                                                             folding Ridge and Valley province. Dry and rocky ridges
American cougar subspecies into a single subspecies,
                                                             are the norm throughout this province, coupled with deep
                                                             and narrow stream valleys (Mueller 1994, 1986). Along
                                                                                                                        6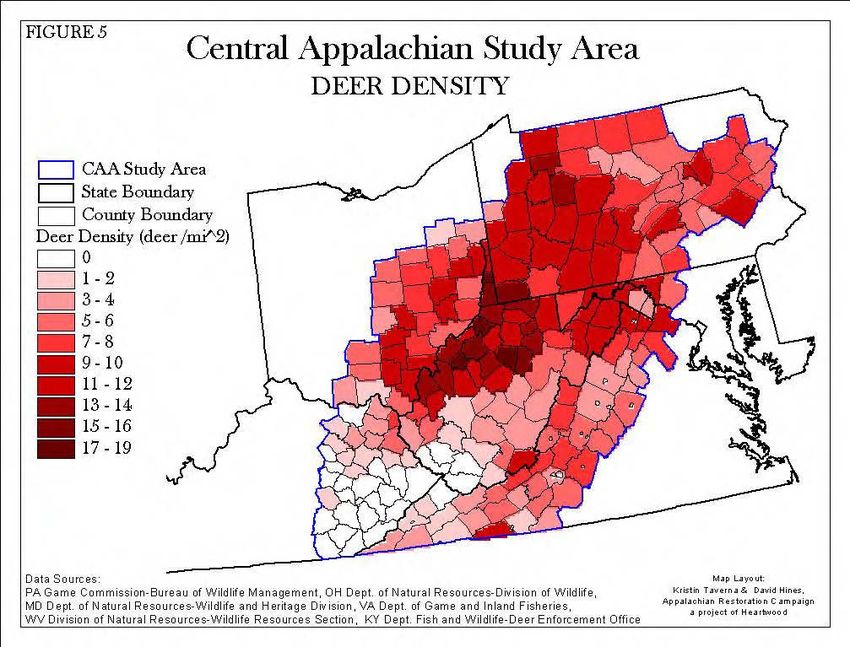
the eastern most edge of the CAA study area lie the Blue Table 1.
Ridge mountains. Elevations throughout the entire region Land Use/Land Cover: Percent of CAA Study Area
range from about 300 to 5800 ft (90 to 1740 m) with the Source:USGS Landsat TM Data, 1993.
highest elevations found in West Virginia and southwest EROS Data Center, Sioux Falls, SD
Virginia.
Forest 72.86 %
The study area includes the headwaters of two major Agriculture 22.99 %
eastern watersheds, the Chesapeake and the Ohio, the Developed 2.09 %
former being the largest freshwater estuary in North Water 0.86 %
America. Their major drainages are the economic and
Transition 0.84 %
ecological lifeblood of this region. The James, Potomac,
Patuxent and Susquehanna make the Chesapeake. The Wetlands 0.37 %
major tributaries of the Ohio River, including the
Monongahela, Allegheny, Kanawha (New), Scioto, Methods
Muskingum, Big Sandy and Kentucky, all flow from
within the study area. We compiled four spatial data sets of landscape
characteristics for the Central Appalachian study area to
The wide range of landscape characteristics and identify potential cougar habitat: land cover/land use,
topography throughout the Central Appalachians has led human population density, prey density, and road density.
to a diversity of forest types within the CAA study area. Each data set was selected based on previous studies of
Forests make up 72.9% of the land cover within the CAA cougar habitat, which utilized some or all of the layers to
study area, (Table 1). The most diverse forest type present determine suitable habitat locations.
within the CAA is the mixed mesophytic. The mixed
mesophytic forest is predominant within the Cumberland Jordan (1994) defined suitable sites for the
and Allegheny plateau region at elevations below 2500 ft reestablishment of the Florida panther based on the
(760 m) (Bailey 1995, Braun 1950, Mueller 1994). This variables: site size, vegetation, population density, and
forest type is most developed throughout West Virginia, road density. Additional research supports the use of prey
yet it also extends northward with attenuated diversity. density in determining suitable cougar habitat. Such
Widespread dominants of the mixed mesophytic forest studies have also shown that ungulate-size prey serves as
include a number of species of oaks, hickories, maples, the primary food source for the cougar (Anderson 1983,
basswoods, birches, ashes, poplars, and pines. Brocke 1981, Hornocker 1970, Linzey 1987,1994, Riley
1998, Seidensticker et al. 1973, Toweill 1977). Within the
Oak-pine forests characterize the Ridge and Valley Central Appalachians, the predominant ungulate is the
province of the Central Appalachians. The dominant oaks white-tailed deer (Odocoileus virginianus). For the
are white, black, scarlet, northern red, and chestnut. The purposes of this analysis, prey density is defined in terms
pines are predominant on the drier sites and they include of deer density.
Virginia, pitch, shortleaf or yellow, and table mountain
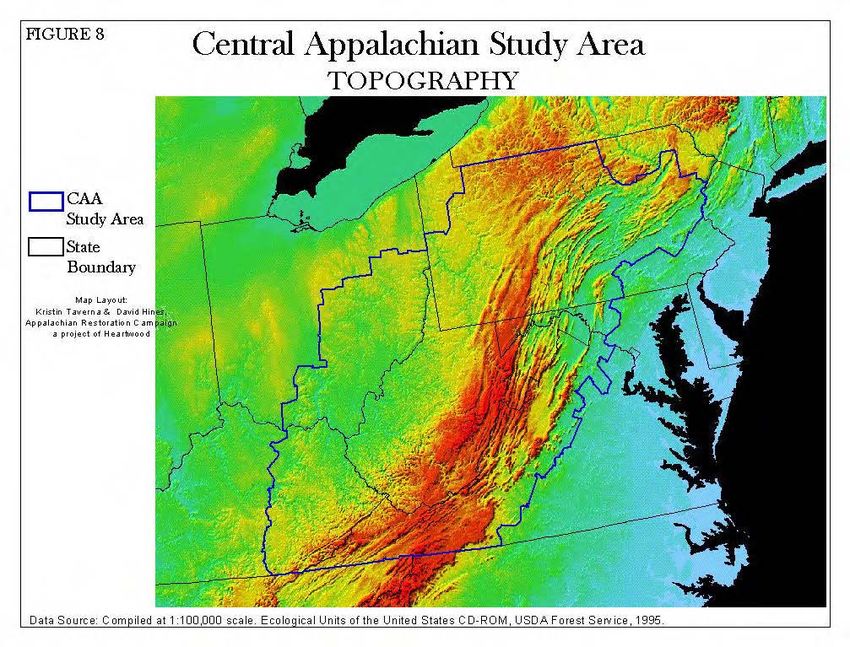
pine (Braun 1950, Mueller 1994). Into the higher Actual road data was obtained from USGS as 1:100,000
elevations, as well as northward into Maryland, digital line graphs and includes all highways, paved roads,
Pennsylvania, and Ohio lie the northeastern hardwood and improved unpaved roads passable by auto, but
forests. Maple, beech, and birch species with a mixture of excludes unimproved forest roads and trails. Road density
hemlock and white pine characterize these forests. Among was calculated for the CAA study area as miles of roads
the highest elevations of the Blue Ridge and Allegheny per square mile (mi/mi2) (Figure 2).
mountains, between 3500–5800 ft (1000-1740m), the
northeastern hardwoods gradually yield to forests Human population data was obtained from the U.S.
dominated by spruce and fir species, meadows, and balds Bureau of the Census, Annual Time Series data. Total
(Bailey 1995, Braun 1950, Mueller 1994). population was recorded and averaged for each county
within the CAA study area for the years 1994 – 1997. The
average population for the four years was calculated to
provide an estimate of human population. Human
population density was determined per county by dividing
the average population of each county by the total county
area, and is recorded as average population per square
mile (pop/mi2) for each county (Figure 3).
7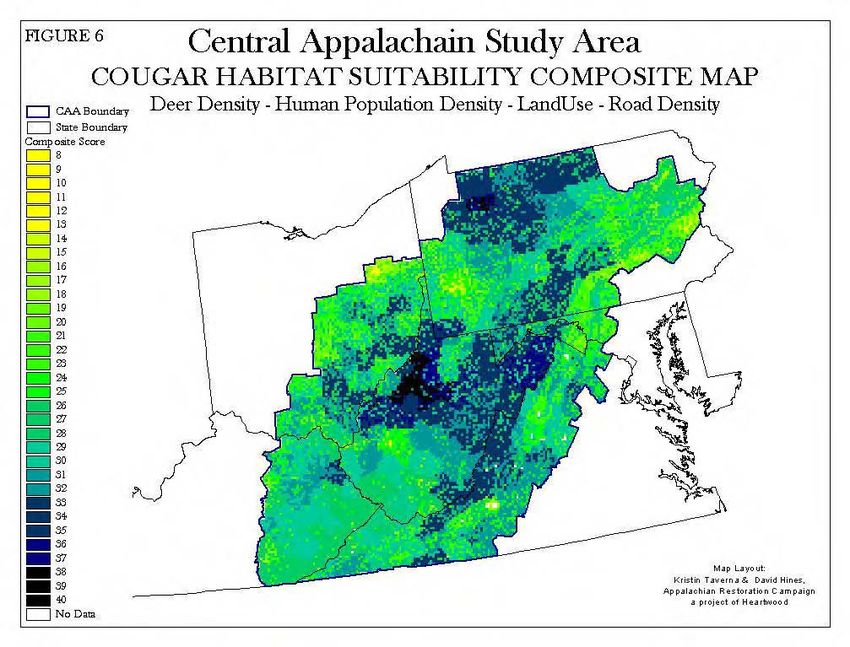
Land use/land cover data for the CAA study area was                 category includes quarries, strip mines, and gravel pits.
derived from digital Landsat Thematic Mapping ™ data at             Although this variable would not normally be considered
a 30m resolution from USGS EROS Data Center. The                    transitional, it accounts for 0.5% of the total land use for
original Landsat TM data recorded the land use/land cover           the CAA study area. It was therefore considered
in terms of the variables listed in Table 2.                        acceptable to include it within the transitional category.

                                       Table 2: USGS Landsat TM Data Variables
                                      Source: 1993.EROS Data Center, Sioux Falls, SD
                             Water                     11 Open Water
                                                       12 Perennial Ice/Snow
                             Developed                 21 Low Intensity Residential
                                                       22 High Intensity Residential
                                                       23 High Intensity
                                                       (Commercial/Industrial/Transportation)
                             Barren                    31 Bare Rock/Sand/Clay
                                                       32 Quarries/Strip Mines/Gravel Pits
                                                       33 Transitional
                             Natural Forested Upland            41 Deciduous Forest
                             (non-wet)                          42 Evergreen Forest
                                                                43 Mixed Forest
                             Natural Shrubland                  51 Deciduous Shrubland
                                                                52 Evergreen Shrubland
                                                                53 Mixed Shrubland
                             Non-Natural Woody                  61 Planted/Cultivated (orchards,
                                                                vineyards, groves)
                             Herbaceous Upland                  71 Grassland/Herbaceous
                             Natural/ Semi-Natural
                             Vegetation
                             Herbaceous Planted/                81 Pasture/Hay
                             Cultivated                         82 Row Crops
                                                                83 Small Grains
                                                                84 Bare Soil
                                                                85 Other Grasses (Urban/recreational;
                                                                e.g. golf courses, lawns)
                             Wetlands                           91 Woody Wetlands
                                                                92 Emergent Herbaceous Wetlands

The total number and type of variables included in the              Agriculture includes the original categories of Non-
original Landsat TM data (Table 2) was not used within the          natural Woody and Herbaceous Planted/Cultivated. The
habitat suitability analysis. A justifiable ranking system          remaining categories of water, developed, wetlands, and
could not be devised to distinguish between areas such as           forest, match the original category listed within Table 1
“Non-Natural Woody” and “Herbaceous Planted/                        (Water, Developed, Wetlands, and Natural Forested
Cultivated” in terms of their suitability for cougar habitat.       Upland (non-wet), respectively).
For this reason, each related category was grouped
together to create the final land use categories: Water,            White-tailed deer (Odocoileus virginianus) harvest data
Developed, Wetlands, Transitional, Agriculture, and                 for each county within the CAA study area was used to
Forest (Figure 4).                                                  determine deer density. Deer harvest statistics do not
                                                                    provide a precise measure of deer populations, yet these
Transitional includes the original categories: Barren,              measures are generally robust enough to follow
Natural Shrubland, and Herbaceous Upland Natural/Semi-              population trends over time and provide the only
Natural Vegetation. It is important to note that the Barren         consistent measure of deer abundance throughout the
                                                                                                                              8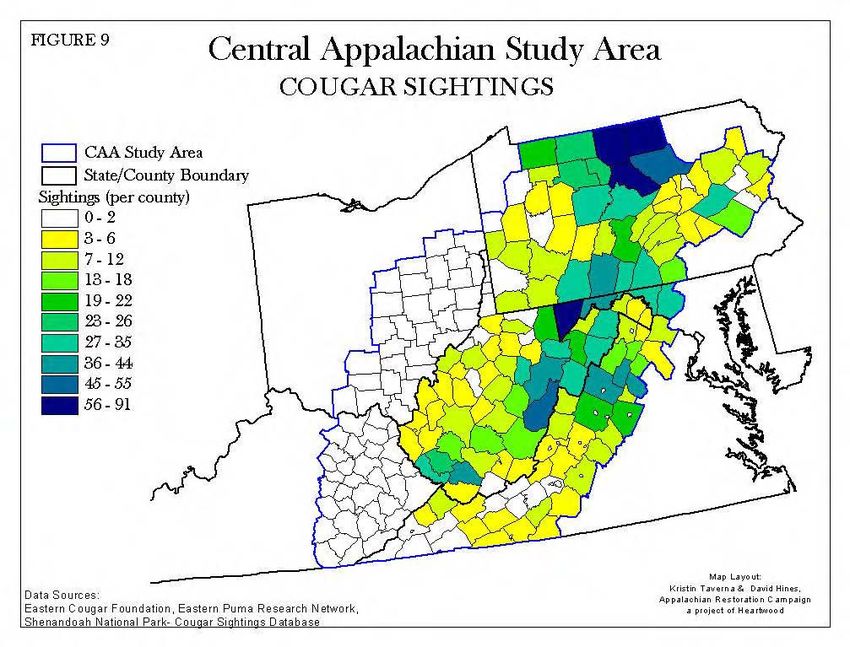
study area (Evans et al. 1999, Pike et al. 1999, Roseberry     categories were ranked and assigned values based on
and Woolf 1991). Total deer harvest data for the years         suitability. The following values were assigned to the land
1994-1997 was obtained from state wildlife agencies for        use categories, based on the knowledge that cougar prefer
each county within the CAA study area and averaged for         covered habitats and areas with low human and road
the four years. Deer density was calculated by dividing        interaction: (Brocke 1981, Riley 1998, Jordan 1994,
the average harvest per county by the total area of each       Logan and Irwin 1985, Tischendorf 1999):
county, and is recorded as average deer harvest per square
mile (deer/mi2) for each county (Figure 5).                                                0 = Water
                                                                                          2 = Developed
A GIS data layer, or coverage, was generated for each                                     4 = Agriculture
data set (Figures 2-5) using ArcView Version 3.1. Each                                    6 = Wetlands1
coverage was converted from vector to raster, or grid,                                    8 = Transitional
format to allow for further analysis. The data for the road                               10 = Forest
density, deer density, and human population density
layers were classified into ten categories using the Natural    Using ArcView, the reclassified data layers were added
Breaks classification within ArcView. This classification      to create a composite map (Figure 6). To conduct the
method identifies breakpoints between classes using a          composite analysis, the CAA study area was divided into
statistical formula, Jenk’s optimization, which minimizes      cells of approximately 5.5 mi2 (14.2 km2) and a total
the sum of the variance within each of the classes (ESRI-      composite score was calculated for each cell. In theory,
ArcView GIS Version 3.1 1992-1998). A more traditional         the composite scores could range from 3 to 40, with 40
method of classification, such as equal intervals, would       representing those cells most suitable as cougar habitat.
have skewed the data for road density and human                Composite scores for this analysis range from 8 to 40.
population density due to high values associated with
these layers in the largest city of the study area,                                         Results
Pittsburgh,     Pennsylvania.     The     Natural    Breaks
classification allowed for more distribution within the        Figure 6 is the full composite map for the Central
data categories by classifying each layer based on             Appalachian study area. The composite map displays the
groupings and patterns inherent in the data itself. The land   total score for the layers as a color range, with yellow
use layer was classified into six qualitative categories       areas representing cells that received the lowest suitability
based on the original data set: Water, Developed,              rating and darker blue/black areas representing cells that
Wetlands, Agriculture, Transition, and Forest.                 received the highest suitability rating. The total score was
                                                               calculated for each cell of approximately 5.5 mi2 (14.2
To create the final composite analysis all categories          km2). The high scores represent areas most suitable for
within each layer were assigned a particular value,            cougar habitat based on highest deer density, lowest
ranging from 0 to 10, based on its suitability as cougar       human population density, lowest road density, and
habitat. The highest suitability rating (10) was given to      forestland.
the categories of lowest road density, lowest human
population density, highest deer density, and forest           The values 33 to 40 represent the top 25% of the 32
habitat, based on the results of the following studies. Van    composite scores (8-40) (Figure 7). The cells within this
Dyke et al. (1986a) discussed how cougars crossed              range are located predominantly within northeast and
improved dirt roads and hard-surfaced roads less than          central West Virginia, and follow the western edge of the
smaller dirt roads and suggested that they avoided areas
                                                               1
with an abundance of improved roads. In a subsequent             The primary range of the Florida panther (Felis concolor
study, Van Dyke et al. (1986b) found that cougars              coryi) is within the swamp forest and marsh/wetland vegetation
selected home areas with no recent timber sales and few        of southern Florida (Maehr 1990). Since the Florida panther
                                                               population is the only documented large feline population in the
or no sites of human residence. Logan and Irwin (1985)
                                                               eastern U.S., it could be considered appropriate to study wetland
studied habitat use by cougars in Wyoming and found            ecosystems north of Florida as potential cougar habitat. Yet an
their primary habitat to be within mixed forest vegetation.    important discrepancy lies in the fact that the ecosystems of
                                                               southern Florida are significantly different than the higher
Following the highest suitable category, each category         elevation, varied topography of the Central Appalachians.
decreases in value down to 1, with the exception of the        Wetlands make up only 0.4% of the landscape within the CAA
land use layer, which has six categories and decreases         study area. It is for this reason that the transitional category was
based on even values down to 0 (Figures 2-5). Without a        given a higher suitability rating than the wetlands category.
quantitative classification scheme, the remaining land use
                                                                                                                                 9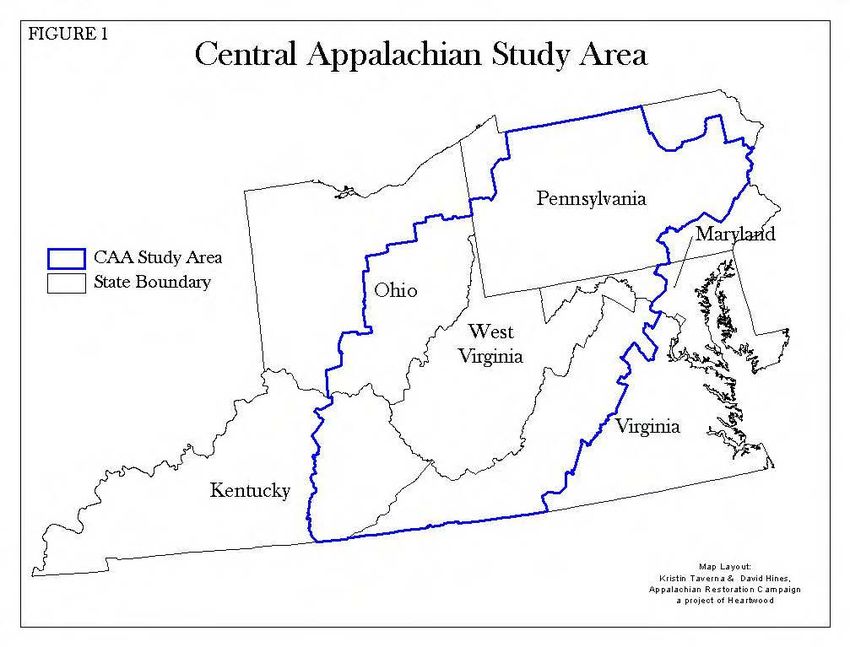
Appalachian mountain chain north through Maryland into              in northwest Pennsylvania. In northeastern West Virginia,
south-central Pennsylvania. The cells continue to extend            the cells are in the counties of Hardy, Hampshire, and
into northwest Pennsylvania, with other small pockets               Tucker, and cover an area of approximately 1,455 mi2
located in eastern Ohio and southwestern Virginia.                  (3770 km2). In northwest Pennsylvania, the cells are in the
                                                                    counties of Warren and Forest, and cover an area of
It is important to note that the top 25% composite scores           approximately 1,210 mi2 (3134 km2).
(33-40) do not necessarily represent the only suitable
habitat for cougars within the CAA study area. Cougars                                      Discussion
are extremely adaptable and able to survive over a wide
range of habitats. As such, it is more useful to focus the                     Additional Landscape Comparisons
results and analysis on those areas that exhibit the highest
density and connectivity among cells. Such areas could              The results of the eastern cougar habitat suitability
potentially fulfill the large-scale habitat requirements of         analysis serve as a coarse identification of suitable cougar
the cougar. The areas of dense cells within this analysis           habitat within the Central Appalachians. To further
were identified based on Figures 6 and 7, and include all           identify and define suitable habitat areas within the CAA
cells with a composite score of 32-40. The focus on this            study area, the results were compared to additional data
range of composite scores does not exclude the possibility          and landscape characteristics that have been associated
that other clusters of cells with a lower score could fulfill       with cougar habitat. These data layers are: topography,
the habitat requirements for the eastern cougar. Future site        cougar sightings, and public lands. These layers were not
specific studies which take into account more variables             used in the initial habitat suitability analysis due to
will provide a higher level of certainty regarding suitable         incomplete or unjustifiable data as a basis for cougar
habitat.                                                            habitat.

As mentioned above, the minimum habitat area necessary              Previous studies of cougars in the western U.S. discuss
for a cougar population to survive in the absence of                the importance of terrain in identifying cougar habitat
immigration in the western US is between 390 and 850                (Hornocker 1970, Logan and Irwin 1985, Riley 1998,
mi2 (1000-2200 km2) (Beier 1993). The home range for an             Seidensticker 1973). These studies associate cougar
individual adult male can range between 15 and 125 mi2 2            habitat with steep, rugged, and variable terrain. Although
(~ 40-325 km2) (Anderson 1983, Hornocker 1970,                      there are significant differences in elevation between the
Seidensticker 1973, Wright 1972, USFWS 1991). The                   topography of the eastern and western U.S., the general
greatest density of high suitability cells within the CAA           habitat descriptions of the western U.S. are important to
study area is located within the central to northwest               consider in relation to the Central Appalachians. The
section of West Virginia (Figure 6 and 7). Within this              Appalachian mountains were once heavily populated by
section, the cells with highest suitability rating (total score     cougars and are part of historic cougar range (Bolgiano
37-40) are in the West Virginia counties of Ritchie,                1995, Parker 1998, Wright 1972).
Gilmer, Tyler, Doddridge, and Wirt, and cover an area of
approximately 1470 mi2 (3810 km2).                                  In addition to studies done on cougar habitat in the
                                                                    western U.S., it is important to consider the habitat of the
There are also smaller areas of dense cells with a high             only documented Puma concolor population in the east,
suitability rating (total score 34-40) located in                   the Florida panther, Puma concolor coryi. Its main
northeastern West Virginia, near the Virginia border, and           habitat is in southern Florida and is predominantly within
                                                                    low elevation mixed swamp forest (Maehr 1990). The
2
                                                                    variation in habitat between western cougars and the
  McNab (1963) examined how mammals determine home range            Florida panther demonstrates that the cougar’s habitat is
size and found that, in general, higher prey density results in a
                                                                    not necessarily confined to steep terrain. The topography
smaller home range. During recent years, deer populations have
been increasing throughout the eastern US, particularly within
                                                                    of the CAA study area was not used as a data layer in the
the state of Pennsylvania (Barber 1984, Bowers 1997, Storm &        habitat suitability analysis due to the cougar’s shown
Palmer 1995). Such increases in prey density could potentially      adaptability to a range of habitats.
decrease the home range area necessary for an individual cougar
within the Central Appalachians. Yet since there is currently no    Figure 8 displays the topography of the CAA study area
exact data available on total deer populations in the east or the   as a color scheme with red representing the highest
home range size of eastern cougars, we did not attempt to           elevations and violet representing the lowest elevations.
estimate a different home range from the numbers available for      The high elevation areas are clearly represented along the
western cougars.                                                    eastern range of the CAA study area, which includes the
                                                                                                                             10
highlands of the Appalachian mountains (Bailey 1995, study area is along the Appalachian mountain chain along
Mueller 1986). A large portion of the cells which received the Virginia/West Virginia border and in the northern
a high suitability rating in the final composite map (total Allegheny plateau, specifically northwest Pennsylvania.
score 32-40) are located along the Appalachian mountain
chain and specifically within the northern Allegheny With comparatively low human population and paved
plateau (Figure 7). road densities, the public lands complex potentially
includes some of the most suitable cougar habitat in the
The majority of the cougar sightings recorded for the east. Yet these publicly owned forests are surrounded by
CAA study area are located throughout high elevation private landowners, many of whom own large tracts of
areas and in proximity to high suitability cells (Figures 6- forestland. Since it cannot be assumed that suitable cougar
9). Figure 9 displays the sightings data as a color scheme habitat is confined within public lands, the state and
with dark blue representing the counties with the highest federal public lands data was not included within the
number of sightings and light yellow the lowest number of habitat suitability analysis. It will be necessary to include
sightings. Based on the actual sightings data, the land ownership data in subsequent studies as core
approximately 60% of the total recorded sightings are habitat areas become further defined and prioritized in
located along the Appalachian mountain chain. order to accomplish ARC’s large-scale conservation
proposals.
Sightings data was obtained from the Eastern Cougar
Foundation, the Eastern Puma Research Network, and Final Composite Map
Shenandoah National Park. The Eastern Cougar
Foundation and the Eastern Puma Research Network The above comparisons show a high correlation of
provided sightings data as totals per county from the mid suitable habitat cells with the Appalachian mountain
1970’s to 1998. The Shenandoah National Park data was chain. It is important to discuss these results in relation to
originally classified based on location and/or milepost the final composite maps (Figure 6 and 7). Two clusters
numbers along Skyline Drive. When possible, milepost of cells with high suitability ratings (total score 34-40) are
numbers were estimated based on location descriptions. located in this region. They are located in northeastern
The milepost numbers were used to classify each sighting West Virginia, near the Virginia border, and in northwest
within one of the following counties in Virginia: Warren, Pennsylvania and cover an area of approximately 1455
Rappahannock, Page, Madison, Greene, Rockingham, mi2 (3770 km2) and 1210 mi2 (3134 km2), respectively
Albemarle, and Augusta. The sightings from each source (Figure 7). As discussed above, there are habitat cells with
were totaled per county and transferred into an ArcView a total score of 32-34 located around these areas and
coverage for comparison with the final composite map. extending throughout the Appalachian mountains. In
future studies it will be useful to extend beyond the dense
Cougar sightings data was not incorporated within the areas of high suitability cells to examine the potential for
initial habitat suitability analysis for two reasons. First, connectivity with other areas in the Appalachians (Beier
the data itself is incomplete within the study area and et al. 1998, Noss et al. 1996).
second, sighting reports are largely considered unreliable
among trained biologists and wildlife officials unless they The cells with the highest suitability rating (total score
are coupled with physical evidence. Yet scattered among 37-40) are located in central to northwest West Virginia,
the misidentified sightings are reliable reports that are along the southern Allegheny plateau (Figure 7). The road
frequently unnoticed and uninvestigated by wildlife density, human population density, and land use values in
agencies (Tischendorf 1996). Due to data and time this section of West Virginia are comparable to those
limitations, the reliable and/or confirmed sightings of along the Appalachian mountain chain (Figures 2-4). The
cougars in the central Appalachians could not be main difference lies in the deer density values in this
separated from unconfirmed reports for use within the region of West Virginia as compared to the rest of the
habitat suitability analysis. Cougar sightings data was study area. The deer density in central and northwest
available as overall totals per county for the following West Virginia are all within the top 50% of values. The
states within the CAA study area: West Virginia, highest deer density values in the study area located west
Virginia, Maryland, and Pennsylvania. of the mountains in the West Virginia counties of Lewis,
Wirt, Tyler, and Ohio (17-19 deer/mi2) (Figure 7).
As a final comparison, the results of the habitat suitability
analysis were analyzed with the location of state and White-tailed deer are an indicator species of land
federal public lands in the Central Appalachians (Figure fragmentation and disturbance, and as such, deer
10). The highest density of public lands within the CAA populations are generally smaller in the mountains than in
11the Piedmont and plateaus where fragmentation and edge contribution of other foods to the diet, and the rate of
are greater (Alverson et al. 1988, Augustine & Frelich spoilage (Linzey 1987). Cougars have also been observed
1998, Shrauder 1984). Although deer densities are to travel 25 miles or more a night in search of food
typically higher near “edge” habitat, studies have shown (Young & Goldman 1946).
that cougars have an affinity for forested habitat over
fragmented and populated areas (Logan & Irwin 1985, In comparing prey availability to estimated kill rates for
Van Dyke 1986b). Based on this information, it is cougars, it appears as though the population of deer
important to consider the possibility that areas of highest throughout the east is sufficient to support a small
deer density do not necessarily represent the most suitable breeding population of cougars. To further substantiate
cougar habitat. Due to data limitations, the values this claim, additional studies are necessary to more
assigned to the deer density data could not be changed to accurately determine deer densities within the Central
reflect different habitat preferences. However, further Appalachians.
study could challenge the ranking system of prey density,
that is highest deer density is best for cougar, by Additional, though indirect, evidence of high deer
reclassifying the data based on documented cougar densities is the millions of dollars in agricultural damage
preference for forested habitat. and the negative affects deer browsing has had on forest
regeneration for a number of tree species (Alverson et al.
An important deer population trend to consider for the 1988, Bowers 1997, Shrauder 1984, Stout, Tzilkowski et
entire study area is the possibility that in recent years deer al. 1997). Tzilkowski et al. (1997) conducted a study on
populations have been high enough that prey availability agricultural damage within Pennsylvania for the
should not be considered a limiting factor in determining Department of Agriculture and found that, “based on
suitable cougar habitat (Barber 1984, Bowers 1997, Storm questionnaire responses average levels of crop damage
& Palmer 1995). Deer density for the CAA study area across the state ranged from six to ten percent depending
ranges from 0-19 deer/mi2 (0-7 deer/km2) (Figure 5). on the crop and the economic value of crop loss from
Although deer harvest statistics are generally considered wildlife and in particular white-tailed deer exceeded 70
the best data available to analyze deer population trends million dollars”. In terms of forest regeneration, white-
over time, these statistics tend to underestimate actual tailed deer have a very generalized diet and deer density
population numbers (Evans et al. 1999, Riley 1998, as low as 10 deer/mi2 (4 deer/km2) may inhibit the growth
Roseberry & Woolf 1991)3. For the six states within the of a number of herbaceous plants (Alverson et al. 1988,
study area, annual harvest data is obtained via mandatory Bowers 1997, Stout).
check stations and/or harvest report cards sent into state
game departments (State Wildlife Agencies). The success With growing deer populations despite high hunter
of these methods of data collection is dependent on hunter harvests, and no substantial large predator populations in
effort and participation. the east, effective deer management has become an
important issue for both agricultural and wildlife agencies
White-tailed deer studies which have compensated for (Barber 1984, Tzilkowski et al. 1997). Deer hunting is
low harvest statistics estimate deer density to be between legal throughout the Appalachians to help control local
13-50 deer/mi2 (5-20 deer/km2) throughout much of the populations and prevent overabundance. Yet there is a
eastern U.S. (Bowers 1997, Storm & Palmer 1995). recognized need for additional long-term population
Estimated frequencies of deer kills by cougar in the control measures throughout different areas in the east.
western U.S. range from 1 deer/10-14 days to 1 deer/3.1 (Augustine & Frelich 1998, Beasom 1974). Beasom
days for females with cubs (Anderson 1983, Hornocker (1974) conducted a study on the relationship between
1970, Linzey 1987, Young & Goldman 1946). Kill rates predators and white-tailed deer net productivity and found
vary based on the energy demands of the cougar, the that predation was responsible for substantial juvenile
deer mortality. Predation was identified as the major
3 factor stabilizing the dense deer herds (Beasom 1974).
Figure 5, “Central Appalachian Study Area - Deer Density”,
reflects deer densities in eastern Kentucky of less than 1
With suitable habitat still available throughout the central
deer/mi2 as 0 deer/mi2. There clearly are deer in eastern Appalachians, a renewed presence of cougars could
Kentucky, but because the statistics were literally represented as potentially help stabilize the growing deer populations.
whole numbers in the analysis, a density of 0.5 deer/mi2 is This could lessen direct agricultural damage, allow forest
shown as 0 deer/mi2 on the map. However, the densities in regeneration in high deer density areas and allow the
eastern Kentucky are generally lower than in other areas of the cougar to return to part of its original range.
study area, and therefore these numbers are useful for
comparison.
12Conclusion Evidence of this can be found in a recent USDA Office of
Inspector General’s Report, “Forest Service Timber Sale
The results of this analysis can serve as a general Environmental Analysis Requirements,” which states in
guideline of suitable cougar habitat within the Central regards to timber sales analyses on the Marlinton District
Appalachian region. Large areas of suitable habitat were of the Monongahela National Forest in West Virginia,
identified within central West Virginia and along the
Appalachian mountains from western Virginia to the We concluded that the district was
northern Allegheny plateau. Further research on a smaller improperly using the table to exclude
scale is necessary to help identify specific suitable areas, some threatened, endangered, and
taking into account additional land characteristics such as sensitive [species] from detailed analysis.
the location of riparian systems and the specific type of For example, the district did not discuss
forested habitat within each area (patchy forest near the eastern cougar in its biological
developed areas vs. contiguous forest). evaluations despite the fact that suitable
habitat was available and the presence of
This initial analysis, along with future studies, will be a "catlike" creature had been reported in
used to help accomplish part two of ARC's Central the area. District personnel stated that
Appalachian Assessment. Part Two will examine the they had been unable to confirm any of
current ability of public and private protected areas to the reported sightings and to the best of
serve ARC’s large-scale conservation goals by contrasting their knowledge, the eastern cougar had
the distribution of unique ecoregions, as defined by areas to be expatriated from the area. However,
such as suitable cougar habitat, and rare, threatened, and at least one appellant had used the lack of
endangered species hotspots with the locations of discussion and surveys for the eastern
currently protected lands. Based on these findings, the cougar in an appeal regarding timber sales
report will identify linkages between these areas to insure on this forest. We believe that, at a
animal migration corridors, and present implications for minimum, the above facts concerning the
public land management and private land stewardship to eastern cougar should have been
achieve our conservation goals. The Assessment will discussed in the biological evaluation
conclude with a preliminary description of the needed (USDA 1999).
restoration work within the Central Appalachians.
The Marlinton District is the same area where the
Recommendations for Federal and aforementioned 1976 cougars were shot and captured.
State Wildlife Agencies
Wildlife managers have a duty to protect all wildlife
The U.S. Fish and Wildlife Service lists the eastern regardless of the ownership status of the land. Ignoring
cougar (Puma concolor couguar) and the Florida panther the cougar as an existing or potentially viable population
(Puma concolor coryi) as endangered and threatened, in the east is an unacceptable wildlife management policy.
respectively. The official status of the eastern cougar is Public agencies such as the US Forest Service have a legal
endangered, but the recovery plan has not been approved. obligation to search for and manage all wildlife species,
According to Paul Nickerson, of the US Fish & Wildlife's regardless of personal beliefs.
endangered species program in the northeast region, the
USFWS is not actively pursuing approval because, Future wildland protection and ARC’s conservation goals
“there’s nothing left to debate, eastern cougars are can be further supported through the commitment of the
gone”(Nickerson 1999). US Fish and Wildlife Service to protect all wild cougars
in the East. The first step towards such protection could
Politically, the cougar is not recognized as part of the be through the implementation of the Eastern Cougar
eastern US. Dozens of conversations with individuals who Recovery Plan. Robert Downing developed the Eastern
have sighted cougars or actually found evidence, detail a Cougar Recovery Plan following his study on the status of
long history of denial of the cougar’s presence by wildlife the eastern cougar in the Southern Appalachians
agencies. At a minimum, recognition of this species as an (Downing 1981,1982). The Plan includes a seven step
integral part of eastern ecosystems, and a serious outline, calling for research and search training, and
treatment of sighting reports would help advance the systematic field searches in all likely locations throughout
debate on cougars. Regardless of the legal status and the the cougar’s former range. If a population is found, a
taxonomic classification, state and federal wildlife detailed study, interim protection, habitat management,
managers are not doing their jobs with respect to cougars. and public education are intended to follow (Downing
131982). Unfortunately, seventeen years have passed and, chain and native species populations to run their natural
like many recovery plans, the Eastern Cougar Recovery course. Fundamental to conservation biology is the
Plan has yet to be implemented. understanding that human existence is dependent on
healthy and functioning ecosystems. Many important
The 1982 Eastern Cougar Recovery Plan was a species native to central Appalachia have been extirpated.
satisfactory report for its time, but much has been learned The timber wolf, the elk (there are reintroduction efforts
over the past seventeen years. Revisions to the plan are underway), the badger in the north, and the river otter in
needed and should not be limited solely to the listed many places, are no longer affecting evolution in
subspecies eastern cougar (Puma concolor couguar). The Appalachia. Protection of umbrella species like the
recovery team needs to examine new information, such as cougar can help ensure protection of many species and the
sightings and genetic studies. complex ecosystems upon which we all depend.
Unfortunately, moving these agencies toward a legitimate Ultimately, the mystery of the eastern cougar will be
cougar recovery plan many involve future legal action. solved by open and candid discussion at all levels.
Indeed, “conservation by litigation,” as termed by Reed Suitable habitat and a sufficient prey base clearly exists
Noss, is the dominant, but not necessarily the best way of for the cougar in the Central Appalachians. Public
protecting species (Noss & Cooperrider 1994). Any plan approval and agency acceptance are the major barriers
forwarded by state or federal agencies must include facing cougar recovery in the east. Increased pressure
significant public involvement. from concerned citizens and more public education may
set the stage for the return of a thriving cougar population
Public involvement in agency policy is an important in the east.
aspect of wildlife management. If public pressure for
cougar recovery is strong and consistent, the agencies
should respond accordingly. Acknowledgements
ARC recommends all pertinent state and federal wildlife We are extremely grateful to Andy Mahler, Phil Berck,
managers be trained in cougar tracking by outside experts, Karen Tuerk, Tom Rooney, Charlie Sullivan, Sherman
such as Sue Morse of Keeping Track, Inc. Further, we Bamford, Steve Krichbaum, M.A. Jones, Rick
recommend a unified and uniform method of dealing with Landenberger, R.F. Mueller, and others for their
sightings at the state and federal level. ARC recommends dedication to the idea and the actualization of the
increasing funding for the Federal Endangered Species Appalachian Restoration Campaign. Than Hitt, ARC's
Program. There are many opportunities for cost sharing first Coordinator, initiated the Central Appalachian
arrangements or multi-agency, public-private partnerships Assessment, of which this study is an integral part.
to address this important issue. Although these agencies
are important, protecting wildlife does not have to depend We received advice and assistance from Jay Tischendorf,
on government regulations and tax dollars. David J. Mladenoff, Dr. Ranier H. Brocke, Sunny Bass,
Troy Merrill, Carlos Carroll, Shawn Riley, and Chip
In addition to state and federal education and training Harvey. The manuscript benefited from thoughtful
programs, cougar advocates in the east need to build reviews provided by Chris Bolgiano, Tom Rooney,
understanding, respect, and tolerance for cougars in rural Melanie Culver, William H. "Marty" Martin, Susan
communities located in and near cougar habitat. A Morse, and Steve Krichbaum. We thank Todd Lester,
proactive campaign of education and outreach to people Sherry Blanchette, and John Lutz for providing us with
who live in existing and potential cougar habitat will sightings data and their undying faith in the eastern
empower them with knowledge about the animal and the cougar. All eastern cougar enthusiasts who continue to
ecosystem and help build an attitude of respect and collect sightings data throughout the east and dedicate
tolerance. Without such acceptance, wild cougars will valuable time towards cougar protection also deserve
never have a chance of surviving. thanks.
Beyond the classification questions and the resistance of We thank the U.S. Dept of the Interior for providing us
agencies, is a deeper, more important issue. In recent with digital land use and road density data, the US Census
years, the role of conservation biology in wildlife and Bureau for data on human population, the Environmental
land-use management issues has increased significantly. Systems Research Institute (ESRI) for nationwide county
Conservation biology asserts that the overall health of the data, and state wildlife and natural resource agencies for
ecosystem is best served by allowing the natural food information on county deer harvests. ESRI also provided
14You can also read