Investigating Visual Content Shared over Twitter during the 2019 EU Parliamentary Election Campaign
←
→
Page content transcription
If your browser does not render page correctly, please read the page content below
Media and Communication (ISSN: 2183–2439)
 2021, Volume 9, Issue 1, Pages 158–170
 DOI: 10.17645/mac.v9i1.3421

Article
Investigating Visual Content Shared over Twitter during the 2019 EU
Parliamentary Election Campaign
Nahema Marchal 1, *, Lisa-Maria Neudert 1 , Bence Kollanyi 2 and Philip N. Howard 1
1 Oxford Internet Institute, University of Oxford, Oxford, OX1 3JS, UK; E-Mails: nahema.marchal@oii.ox.ac.uk (N.M.),
lisa-maria.neudert@oii.ox.ac.uk (L.-M. N.), philip.howard@oii.ox.ac.uk (P.N.H.)
2 Doctoral School of Sociology, Corvinus University of Budapest, 1093 Budapest, Hungary;

E-Mail: bence.kollanyi@stud.uni-corvinus.hu

* Corresponding author

Submitted: 30 June 2020 | Accepted: 1 September 2020 | Published: 3 February 2021

Abstract
Political communication increasingly takes on visual forms. Yet, despite their ubiquity in everyday communication and dig-
ital campaigning, the use of these visuals remains critically understudied. In this article, we investigate the formats and
modes of visual content deployed by Twitter users over a two-week period leading up to the 2019 EU Parliamentary elec-
tions and across two publics: those discussing the election at large and those discussing the more contentious issue of EU
membership. Conducting a multilingual, cross-comparative content and thematic analysis of a sample of 1,097 images, we
find that: (1) Visuals originating from traditional political actors prevailed among both Twitter discourses; (2) users shared
substantial amounts of anti-EU, populist and, to a lesser extent, extremist images, though this content remained largely
disjointed from the mainstream public debate; and (3) political humor emerged as a vector for anti-establishment and
Eurosceptic themes, especially in discussions critical of the European project. We discuss the implications of our findings
for the study of visual political communication and social media manipulation.

Keywords
elections; European politics; populism; social media; visual communication

Issue
This article is part of the issue “Dark Participation in Online Communication: The World of the Wicked Web” edited by
Thorsten Quandt (University of Münster, Germany).

© 2021 by the authors; licensee Cogitatio (Lisbon, Portugal). This article is licensed under a Creative Commons Attribu-
tion 4.0 International License (CC BY).

1. Introduction centric platforms but also on Twitter, where over 50% of
 tweet impressions in 2019 were associated with images
We live in an age of visual communication: From the or other visual media (Meeker, 2019).
rise of selfies, memes and animated GIFs in digital cul- Visuals are also starting to take center stage in
ture to the surging popularity of visual-centric platforms online political communication. While political parties
like Instagram, Snapchat, and TikTok that reach billions and campaign managers have traditionally relied on
of monthly users across the world. Visual content in the leaflets, posters, and TV spots to rally support, the
form of photos, videos, infographics and user-generated advent of digital technologies, and social media specifi-
images are becoming central to our day-to-day interac- cally, has seen political actors integrate new visual media
tions online, informing how we present ourselves (Senft strategies into their everyday communicative practices.
& Baym, 2015; Thomson & Greenwood, 2020), commu- Retouched Twitter profile pictures, vlogs from the cam-
nicate and understand the world around us (Highfield paign trail, Instagram livestreams, and staged photo ops
& Leaver, 2016; Pearce et al., 2020). Image sharing has capturing seemingly candid moments have now become
recently seen a surge in popularity, not only on visual- staples of the arsenal of contemporary electioneering

Media and Communication, 2021, Volume 9, Issue 1, Pages 158–170 158
(Lilleker, Tenscher, & Štětka, 2015). Technological affor- ulist and, to a lesser extent, extremist images, though
dances have also enabled completely novel forms of these were largely disjointed from the mainstream pub-
political self-expression among private citizens, from bal- lic conversation. Our data also reveals political humor as
lot selfies to Snapchat filters in support of specific causes a vessel for anti-establishment and Eurosceptic themes,
(Gutterman, 2018). especially in discussions critical of the European project.
 In modern attention economies, visual forms of com- Furthermore, we find that while traditional visual for-
munication offer clear advantages over text; they are eas- mats dominate across both Twitter conversations, hybrid
ier to process, elicit strong emotions and are effective at content in the form of memes, annotated screenshots
capturing viewers’ attention and retention (Barry, 2005; and remixed media have also emerged as popular modes
Fahmy, Bock, & Wanta, 2014; Newhagen, 1998). In recent of visual communication. In the last section, we discuss
years, however, they have also emerged as popular cata- these findings and their implications in the context of the
lysts of misinformation and disinformation across Europe 2019 European Parliamentary Elections and contempo-
and worldwide, both through inadvertent amplification rary political communication more broadly.
and as part of larger social media manipulation cam-
paigns (Bradshaw & Howard, 2019; Guy, 2017). The 2. Literature
German Alternative für Deutschland (AfD) party, for exam-
ple, has repeatedly used fake imagery involving immi- 2.1. Visual Political Communication in Europe
grants relating to sexual abuse and violence to bolster
anti-immigration sentiment during elections (Czuperski & Digital modes of communication have been transforma-
Nimmo, 2017). This is particularly concerning given that tive for political communication. Through the contin-
key research on this topic suggests that most individu- ual expansion of networked infrastructures, social media
als struggle to distinguish between real and manipulated platforms have emerged as arenas for the dissemination
images (Nightingale, Wade, & Watson, 2017). of political information to large audiences at marginal
 Despite their ubiquity in contemporary online politi- cost. Today, political actors rely on a wide array of
cal discourse, visuals have been somewhat neglected in such channels to engage with voters and other stake-
the study of political communication, which overwhelm- holders year-round (Chadwick, 2013). Scholars under-
ingly favors text-based approaches, especially in Europe score social media’s vital role for advocacy (Karpf, 2012),
(Weller, Bruns, Burgess, Mahrt, & Puschmann, 2014). e-governance (Margetts, John, Hale, & Yasseri, 2015) and
To address this oversight in this study, we conduct a mul- democratization (Howard & Hussain, 2013). Non-party
tilingual, cross-case comparative content and thematic actors have also been shown to leverage social media
analysis of Twitter images posted by users in six different to shape the political agenda, frame and amplify issues,
European language spheres—English, French, German, and generate consensus among subsets of the electorate
Italian, Spanish and Swedish—during a two-week-long (Rohlinger, 2019).
period leading up to the 2019 EU Parliamentary elec- Visual media has, in more ways than one, been
tions. Specifically, we investigate images on Twitter in at the heart of this transformation. While visual sym-
the context of two conversations: One surrounding the bols themselves have long performed essential func-
EU elections in general, and one surrounding the more tions in political communication (Schill, 2012), the surg-
contentious issue of membership to the EU. Three main ing popularity of technologies whose affordances are
research questions drive our analysis: specifically oriented towards the creation, dissemina-
 tion and customization of images has awarded them
 RQ1: What salient formats and modes of visual con- newfound importance—especially times of heightened
 tent were users in Europe sharing over Twitter during political tension such as electoral cycles. In Europe,
 the 2019 EU Parliamentary election campaign? both grassroots and mainstream political actors lever-
 age visual formats as potent ways to communicate with
 RQ2: How does this differ across two conversations their constituents and mobilize support. Cámara Castillo
 with varying degrees of contention? (2019, p. 49) demonstrates, for example, how European
 institutions carefully “advertise European identity” and
 RQ3: What were the most common themes embed- foster civic interaction through immaculately curated
 ded in different modes of visual communication? Instagram feeds. In a departure from traditional forms
 of campaigning, ‘satellite’ and non-party intermediaries
In the following section, we begin by situating this like Momentum, a British political organization, have also
research in the existing literature on visual media in polit- been credited with boosting support for Jeremy Corbyn’s
ical communication, their uses and effects. After detail- 2017 campaign through its clever use of memes, and
ing processes for data collection and sampling, we out- short-form videos—tactics which were widely adopted
line our coding scheme for analyzing the salient for- by the political mainstream during the 2019 UK General
mats and modes of images shared over Twitter during Elections (Lyons, 2019).
the campaign, as well as their themes. We show that Yet worryingly, digital platforms have also proven
users shared substantial amounts of anti-European, pop- vulnerable to manipulation (Woolley & Howard, 2018)

Media and Communication, 2021, Volume 9, Issue 1, Pages 158–170 159
and algorithmic gaming aimed at sowing discord in Mason, 2013, p. 146) that can be re-worked to deceive
Europe and around the world (Jungherr, Posegga, & audiences intentionally or make a political or satirical
An, 2019; Marchal, Kollanyi, Howard, & Neudert, 2019). point (Hemsley & Snyder, 2018). As such, humorous
During recent elections in France, Germany, and Italy, memes, composite images and mixed media involving
for instance, hyper-partisan and conspiratorial junk news the use of irony have come to play an increasingly criti-
sites repeatedly outperformed professional news outlets cal role in digital politics (Tay, 2015) as a way for users to
on social media (Neudert, Howard, & Kollanyi, 2019). express opinions, build community and mobilize action,
Research also shows that xenophobic, national-populist, as well as a tool for politicians to share policy ideas or to
and other extreme-right ‘movement-parties’ (Kitschelt, demean their opponents—for instance, during the 2016
2006) make strategic use of digital media to spread Brexit referendum campaign (Dean, 2019; Segesten &
Eurosceptic messages across publics (Caiani & Pavan, Bossetta, 2017).
2017). A growing number of scholars note that hybrid Beyond that, connected technological infrastruc-
visuals such as memes have become the format of choice tures have enabled citizens to engage more directly in
to push political propaganda or troll social media users, democratic processes though ‘tiny acts’ of participation
often with the stated goal of driving division among (Margetts et al., 2015). Today, citizens contribute to the
key segments of the audience (Klein, 2019). Today, public conversation about politics in more ephemeral
new digital visual media complement—if not altogether and intangible ways than before: Broadcasting their sup-
supplant—other, more traditional forms of political com- port for a cause and seeking to influence others to do
munication for party and non-party actors alike. To gain a the same, through selfies with politicians, and pictures
better understanding of their formats and modes in the of themselves engaging in various political activities such
political context, in the next section we review existing as rallies and protests (Sorokowska et al., 2016).
literature on their uses on social media. Thus, while the literature on the use of visual con-
 tent in digital communication is growing, it remains in its
2.2. The Political Uses of Social Media Visuals infancy and offers ample room for elaboration and empir-
 ical study. Notably few studies, if any, have explored
Visual media have diverse uses in digital political commu- how specific formats of visuals are mobilized by social
nication. With the widespread adoption of smartphones, media users during electoral campaigns and what polit-
social media users have been empowered to document ical themes they express. Considering this, in this study,
and share real-time footage of political events in new we take the 2019 EU Parliamentary elections as a case
forms of ‘mobile witnessing’ (Reading, 2011) and citizen study to examine the types of images shared over Twitter
journalism. Twitter, a micro-blogging platform favored by among two issue publics: Twitter users discussing the
journalists, opinion leaders and politicians and geared elections themselves, and those discussing the more con-
towards opinion broadcasting (Marwick & boyd, 2011) troversial issue of potential withdrawal from the EU.
has emerged as a prime arena for political image shar-
ing. Images shared over Twitter, for instance, formed 3. Methods
an important part of both the 2011 Egyptian revolution
(Kharroub & Bas, 2015) and the 2012 Israel–Hamas con- 3.1. Case Selection
flict (Seo, 2014) as well as more recently during the 2020
Black Lives Matter protests. The 2019 European Parliamentary Elections took place
 Further, images are often shared as a means of between 23–26 May 2019 and witnessed a turnout of
interpersonal communication to express an opinion, per- 50.66% of more than 400 million eligible voters to the
suade, or even manipulate. The adage that an image is polls—making it the second largest democratic elec-
worth a thousand words underscores the strong rhetor- tion in the world (European Parliament, 2019). Across
ical impact that visuals have on those who view them member states, hundreds of candidates and dozens of
(Birdsell & Groarke, 2007). Research suggests that audi- parties and their supporters campaigned for months
ences process images faster and more efficiently than over social media, generating vast amounts of cam-
text alone (Graber, 2012). Typically, images tap into a paign material, media coverage and user-generated con-
larger socio-political context (Schill, 2012) and are often tent. The elections took place against a backdrop of
used in conjunction with or in response to other images significant divisions in public attitudes towards the EU,
and text to highlight specific aspects of an issue (Blair, with polls underscoring an erosion of trust in European
2004; de Vreese, 2005). institutions (Guerra & Serricchio, 2014). The establish-
 Decontextualized, altered or altogether fake images ment of extreme populist voices within the political
have also become prolific on social media, where they mainstream over recent years had stoked experts’ fears
bypass traditional gatekeepers and often elude content that Eurosceptic voices would make significant gains
moderators (Gillepsie, 2018). In a hybrid media ecosys- in 2019 European Parliamentary Elections. Ahead of
tem, a large amount of viral visual content takes the the vote, Julian King, then European Commissioner for
form of “derivatives, responses, or copies of content Security, noted that the dispersed nature and long dura-
generated by the mass-media producers” (Hemsley & tion of the European Parliament elections made them

Media and Communication, 2021, Volume 9, Issue 1, Pages 158–170 160
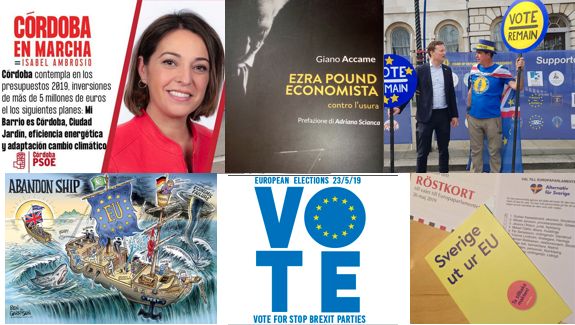
a ”tempting target for malicious actors” (Cerulus, 2019), tions (Bell, 2004, p. 20; Rose, 2012). We chose this tech-
while Vera Jourova, the then EU Justice Commissioner, nique over a more interpretive approach in the first
warned against “external propagandist pressure” poten- instance, in order to allow for a crisp and objective clas-
tially playing out online (Stokel-Walker, 2019). These sification and to avoid introducing cultural and personal
potential threats around social media interference, com- biases in the analysis of more subtle nuances of messag-
bined with the multi-campaigner, multi-issue nature ing and meaning.
of the mandate thus make the 2019 Parliamentary We take an inductive approach to codebook develop-
Elections a pertinent case study. ment, identifying units of meaning as they emerged from
 our data before grouping them into larger codes cover-
3.2. Data Collection and Sampling ing two separate aspects of the Twitter images: their for-
 mat and mode. Here, format describes the type of media
Our data collection proceeded in four stages. We first shared by users, based on their constitutive elements,
identified a set of relevant hashtags in English, French, while the notion of mode captures the way in which polit-
German, Italian, Polish, Spanish, and Swedish intended to ical information is being communicated, based on an
capture Twitter traffic around these two separate conver- image’s manifest content and its apparent provenance.
sations. While hashtag-based sampling has known limita- Two coders with extensive expertise in content analysis
tions, it is a common technique to study ‘ad-hoc publics’ first identified emergent format and modal categories
forming around discussion of specific topics, especially and coded a sub-sample of 100 images drawn from the
during key political moments (Burgess & Bruns, 2012; ‘General’ and ‘Exit’ datasets. Any disagreements were
Larsson & Moe, 2012). The hashtags were compiled by a discussed among the authors, and initial codes were
team of nine research assistants with expert knowledge later adjusted and integrated into broader ones in an
of these countries’ languages and political landscapes iterative process, culminating in seven format and nine
(full list of hashtags in the Supplementary File). modal categories. Intercoder reliability was then deter-
 Using this set of 84 hashtags, our team then col- mined using Krippendorf’s alpha on two independent,
lected a total of 3,620,701 tweets in real time between non-overlapping sub-samples of 50 images randomly
13 May and 26 May 2019 through Twitter’s Streaming taken from each dataset, achieving high scores.
API. This method has knowns limitations: The API only Visual format ( = 0.843) includes the follow-
collects 1% of the global public traffic related to a spe- ing categories: ‘Photograph’ refers to pictures taken
cific search query at any given time and the company’s with a camera—including selfies, user-generated, offi-
precise sampling method is unknown (Morstatter, Pfeffer, cial, and stock photos—that have not been visibly modi-
Liu, & Carley, 2013), but it remains the only legal way to fied. ‘Illustration’ refers to drawings, sketches, cartoons,
collect Twitter data without violating terms of services and computer-generated images. ‘Screen capture’ cor-
(Freelon, 2018). From this initial dataset we extracted responds to images displaying the content of a phone,
tweets that contained static visuals in their metadata TV, or computer screen, including captures of webpages,
fields. We included tweets if they satisfied one or more newspaper articles, and screenshots of social media
of the following criteria: (1) contained at least one of the posts. ‘Infographic’ encompasses visual representations
relevant hashtags; (2) contained the hashtag in a URL of information and data, including statistics, maps, and
shared, or the title of its webpage; (3) were a retweet visual explainers. A ‘Composite’ is a visual that has
of a message that contained a relevant hashtag or men- been altered to combine different graphical elements
tion in the original message; or (4) were a quoted tweet (e.g., photo, text, and drawing), such as photo mon-
referring to a tweet with a relevant hashtag or men- tages, memes, and GIFs. ‘Quote’ refers to images fea-
tion. We then rehydrated each tweet in our set to access turing a phrase attributed to an individual or plain text
the image files, identify tweets that had been removed that has not been visibly altered. In the ‘Poster’ cate-
or deleted since the initial time of posting, resulting in gory, finally, we include promotional posters, campaign
a final dataset of 307,951 tweets with visual content posters, leaflets, event announcements and party logos
of which 256,204 related to the EU election and 3,164 (Figure 1).
related to EU exit. To make inferences about both popula- Visual mode ( = 0.865) categories comprise:
tions, we determine the appropriate sample sizes based ‘Official campaign communication,’ which applies to offi-
on a 95% confidence interval and a more or less 4% mar- cial campaign material, including political party pro-
gin of error, resulting in a random sample of 599 tweets grams, leaflet and event advertisements, and any com-
for what we henceforth refer to as the ‘General’ sample munications from official candidate and party accounts.
and 505 tweets for the ‘Exit’ sample. A very small sample ‘Campaign event’ applies to images of campaign events,
of seven images was not accessible. including pictures of rallies, candidate appearances on
 TV, and photo ops. ‘Citizen political engagement’ applies
3.3. Comparative Content Analysis to images of private citizens engaging in political activi-
 ties, such as photographs taken at demonstrations, and
Content analysis is a reliable method for the systemic individual expressions of support for political causes.
classification and interpretation of visual representa- ‘Political humor’ applies to memes, humorous cartoons,

Media and Communication, 2021, Volume 9, Issue 1, Pages 158–170 161
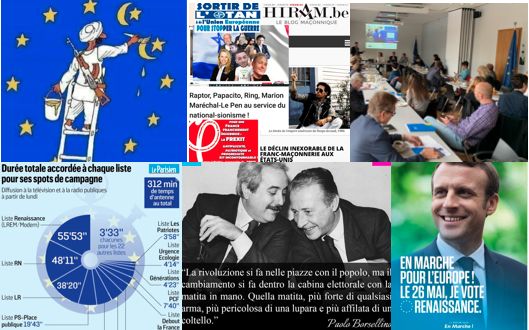
Figure 1. Examples of format categories. Note: From top left to bottom right, examples of an ‘illustration,’ ‘composite,’
‘photograph,’ ‘infographic,’ ‘quotation’ and ‘poster.’

satire, and other forms of humor directed at or derived engaging in the act of voting. ‘Other political’ applies to
from actors involved in the political process. ‘News other images of political nature that do not specifically
media reporting’ represents images of news media relate to the campaign. ‘Miscellaneous,’ finally, encom-
reports, such as newspaper articles, but excludes com- passes images unrelated to politics (Figure 2).
posites of multiple media sources. ‘Non-party and satel-
lite campaigning’ applies to campaigning material gen- 3.4. Thematic Analysis
erated by non-party actors, such as satellite groups
(Dommett & Temple, 2018), registered campaigners, Finally, to complement and enrich our systematic con-
and other “democratic intermediaries” (Edwards, 2006, tent classification, we perform a thematic analysis of
pp. 8–9). This includes event announcements, unoffi- visual materials in our samples. Although content and
cial campaign material, and get-out-the-vote initiatives. thematic analysis methods share similarities, content
The category ‘Voting day’ describes visuals of the vote, analysis lends itself to quantitative summarization of the
such as pictures of ballot cards, and citizens or politicians coded variables, whereas thematic analysis is a more

Figure 2. Examples of modal categories. Note: From top left to bottom right, examples of ‘official campaign communica-
tion,’ ‘other political,’ ‘citizen political activism,’ ‘political humor,’ ‘satellite campaigning’ and ‘voting day.’

Media and Communication, 2021, Volume 9, Issue 1, Pages 158–170 162
interpretive approach that seeks to reveal patterns of 4. Findings
meaning in data in context (Neuendorf, 2019). For this
task we also followed an inductive process (Clarke, Braun, 4.1. Format
& Hayfield, 2015, p. 225), identifying recurrent themes
and patterns of meaning as they emerged in the data Table 1 shows that photographs are by far the most
through semantic and visual symbols without prior the- prevalent format across both ‘General’ and ‘Exit’ sam-
oretical expectations. After familiarizing ourselves with ples, making up 38.7% and 23.8% of all images, respec-
the data, we devised a first round of descriptive codes, tively. Posters were shared slightly more frequently in
which we later grouped to form larger thematic cate- the ‘General’ conversation, where they comprised 21.9%
gories based on salience and relevance. One such cate- of all images compared to 20.4% for ‘Exit.’ Proportions
gory pertained to references to policy issues addressed of illustrations (6.2% in ‘General,’ 8% in ‘Exit’) and screen
during the election campaign, such as ‘economy,’ ‘secu- captures (12.9% in ‘General,’ 9% in ‘Exit’) were commen-
rity’ or ‘immigration.’ Any references to the elections surate across both samples. Both datasets display stark
themselves were grouped under the ‘General election’ differences when it comes to composites, however, with
category. Our team treated images of individuals des- tweets focusing on EU withdrawal containing more than
ecrating the European flag, admonishing the European twice (22.4%) the number of composites than ‘General’
project, or advocating for total disengagement from tweets (9.9%). Quotes and text only accounted for a frac-
the EU as conveying a ‘Eurosceptic’ message, while tion of all images in the ‘General’ dataset (2.7%) com-
treating positive references to European integration as pared to the ‘Exit’ one (12.2%).
‘pro-Europe.’ Graphical violence and visual references
to extreme ideology were grouped under ‘extremism,’ 4.2. Mode
while those pushing an anti-elite/establishment rhetoric
were assigned to ‘populist and anti-elitist.’ Up to two Table 1 reveals that official campaign material was the
codes were assigned to a small fraction of images that most shared mode in both ‘General’ and ‘Exit’-related
touched on more than one theme. While thematic analy- conversations, comprising 18.8% and 26.1% of images
sis is a qualitatively oriented approach (Braun & Clarke, respectively. In the ‘General’ dataset, polls (10.6%), polit-
2006) we include frequency counts for each category ical humor (10.1%), images of voting day (10.1%) and
to understand what topics different forms of political unofficial campaign material (9.9%) made up almost
expressions touched on. equal proportions of content, while other political

Table 1. Frequency of visual formats and modes across both samples.
 ‘General’ Sample ‘Exit’ Sample
 N % N %
Format Code
Photograph 231 38.7 119 23.8
Illustration 37 6.2 40 8.0
Screen captures 77 12.9 45 9.0
Infographic 45 7.6 22 4.4
Composite 59 9.9 112 22.4
Quotes & Text 16 2.7 61 12.2
Poster 131 21.9 102 20.4
Total 596 100.0 501 100.0
Modal Code
Official Campaign Material 112 18.8 131 26.1
Voting Day 60 10.1 24 4.8
Campaign Event 82 13.8 40 8.0
Citizen Political Activism 40 6.7 15 3.0
Polls 63 10.6 7 1.4
Political Humor 60 10.1 98 19.6
Satellite Campaign Material 59 9.9 60 12.0
Other Political 50 8.4 80 16.0
News Reporting 26 4.4 32 6.4
Miscellaneous/Spam 44 7.4 14 2.8
Total 596 100.0 501 100.0

Media and Communication, 2021, Volume 9, Issue 1, Pages 158–170 163
images (8.4%), depictions of citizens engaging in polit- ships between format and modal categories on the one
ical activity (6.7%) and news reports (4.4%) accounted hand, and between modal and thematic categories on
for smaller proportions. Interestingly, politically humor- the other hand. Tables 3 and 4 reveal several interest-
ous images were twice as present in ‘Exit’-related tweets ing similarities and differences between samples. Across
(19.6%), making them the second most popular mode both ‘General’ and ‘Exit’ samples, photographs were
of visual communication in this dataset, closely followed mostly shared to depict campaign events, including party
by other political images (16%). Here again, satellite and rallies (30% of photographs), with substantial propor-
unofficial campaign material accounted for a substantial tions also alluding to voting day (24% in ‘General,’ 20%
number of images with 12% of shares. Polls, finally, were in ‘Exit’). In ‘Exit’-related tweets, photographs formed a
mostly irrelevant to discussions around ‘Exit’ from the EU core part of official campaign communication (20% of
featuring in only 1.4% of tweets compared to 10.6% in images in this mode, compared to 7% in the ‘General’
the ‘General’ sample. sample), where they often portrayed party volunteers
 canvassing. Illustrations, cartoons and drawings were the
4.3. Themes most common vehicle for political humor—the single
 largest category across samples for this format (62% in
Table 2 displays the most salient themes in each sam- ‘General,’ 48% in ‘Exit’)—closely followed by compos-
ple. Comparing both datasets reveals some important ites and user-generated memes (42% in ‘General,’ 60%
differences. Most visual tweets in the ‘General’ dataset in ‘Exit’). Across both samples, posters overwhelmingly
made reference to the 2019 EU Parliamentary Elections corresponded to official campaign material, with 63%
themselves (19%) or to multiple policy issues (10.6%). of posters in the ‘General’ and 85% of those in the
It is noteworthy, however, that the great majority of ‘Exit’ sample taking the form of paper or digital cam-
images shared were not attributed a thematic category. paign posters.
The salience of a policy issue in political discourse is a The relationships between modal and thematic cat-
powerful indicator of its importance to the public. Yet, egories are shown in Tables 5 and 6. In the conver-
only a small proportion of visuals captured in our data sation pertaining to the election at large, visual mes-
made references to specific policies, such as security or sages predictably revolved around the conduct of the
immigration (less than 2% in both samples). In the ‘Exit’ election itself, often in the form of opinion and elec-
sample, 41.9% of images propagated a Eurosceptic and tion polls (95% of images in this mode), as well as news
anti-European message, making it the largest thematic reports (54%). Many also pushed a distinctly ‘pro-EU’
category. In the ‘General’ sample, only 3.5% of images line, mostly through satellite campaign material from
were classified as Eurosceptic, with double the share of pro-EU groups and citizen-led initiatives to ‘get-out-the-
images sharing pro-EU themes (6.7%). Finally, 9.4% of vote’ for Europe (24%). Tweets shared with EU exit
images shared in discussions of potential ‘Exit’ from the hashtags, on the other hand, overwhelmingly pushed
EU conveyed populist and anti-establishment sentiment, Eurosceptic and populist/anti-establishment messages.
mainly consisting of derogatory or hateful messages vis- Interestingly, these were mostly conveyed through satel-
à-vis political elites. lite and unofficial campaigning material (87% of which
 carried a distinctly anti-EU message) and through polit-
4.4. Cross-Category Dependencies ical humor, where 50% and 33% of all images in this
 visual mode assumed either Eurosceptic or anti-elitist
Having identified the most salient content categories in tones. In contrast to the ‘General’ dataset, polls shared in
each dataset, as a final step we investigate the relation- ‘Exit’-related tweets were mostly shared to convey public

Table 2. Frequency of thematic categories across both samples.
 ‘General’ Sample ‘Exit’ Sample
Salient Theme N % N %
Security/Terrorism 3 0.5 7 1.4
Euroscepticism 21 3.5 210 41.9
Pro-EU 40 6.7 0 0.0
General Election 113 19.0 18 3.6
Extremism 7 1.2 21 4.2
Populist Anti-Elitism 11 1.8 47 9.4
Economy 8 1.3 5 1.0
Immigration 8 1.3 11 2.2
Multi-Issue 63 10.6 6 1.2
No Salient Theme 322 54.1 176 35.1
Total 596 100.0 501 100.0

Media and Communication, 2021, Volume 9, Issue 1, Pages 158–170 164
Table 3. Cross tabulations of visual and modal categories in ‘General’ sample (N, %).
 Official Voting Campaign Citizen Political Satellite Other News Misc. &
 Campaign Day Event Activism Polls Humor Campaign Political Reporting Spam Total
Photograph 16 56 69 26 4 6 0 17 3 34 231
 (7%) (24%) (30%) (11%) (2%) (3%) (0%) (7%) (1%) (15%)
Illustrations 1 1 0 0 0 23 2 8 0 2 37
 (3%) (3%) (0%) (0%) (0%) (62%) (5%) (22%) (0%) (5%)
Screenshots 7 0 8 8 20 1 4 4 20 5 77
 (9%) (0%) (10%) (10%) (26%) (1%) (5%) (5%) (26%) (6%)
Infographic 0 0 0 0 39 0 1 2 1 2 45
 (0%) (0%) (0%) (0%) (87%) (0%) (2%) (4%) (2%) (4%)
Composite 3 3 4 3 0 25 15 5 1 0 59
 (5%) (5%) (7%) (5%) (0%) (42%) (25%) (8%) (2%) (0%)
Quotes 2 0 0 1 0 1 6 6 0 0 16
 (13%) (0%) (0%) (6%) (0%) (6%) (38%) (38%) (0%) (0%)
Poster 83 0 1 2 0 4 31 8 1 1 131
 (63%) (0%) (1%) (2%) (0%) (3%) (24%) (6%) (1%) (1%)
Total 112 60 82 40 63 60 59 50 26 44

attitudes around membership in the EU or referred to these varied in relation to contentiousness of discourse.
various 2005 EU Constitution referenda. While depic- Furthermore, our analysis sought to uncover the under-
tions of citizen political activism were either pro-Europe lying themes conveyed through visuals. To this end,
or spoke to multiple policy issues in the ‘General’ sample we developed a rigorous, multi-step scheme for cate-
(20% of images in each mode), in the ‘Exit’ sample they gorizing visual content based on a multilingual, cross-
were almost exclusively mobilized to convey Eurosceptic case analysis of real-time Twitter data covering six
visual symbols (87%). European language spheres—English, French, German,
 Italian, Spanish and Swedish. Our findings underscore
5. Discussion that visual media played a central role in the Twitter polit-
 ical discourse ahead of the 2019 European Parliamentary
This research set out to identify and quantify the for- Elections, both as a conduit for official campaigning
mats and modes of visual political communication mobi- and candidate communications and for novel forms of
lized by Twitter users in the lead up to 2019 European political expression and user-generated political content.
Parliamentary elections, and to determine if and how Three trends stand out from our analysis.

Table 4. Cross tabulations of visual and modal categories in ‘Exit’ sample (N, %).
 Official Voting Campaign Citizen Political Satellite Other News Misc. &
 Campaign Day Event Activism Polls Humor Campaign Political Reporting Spam Total
Photograph 24 24 36 9 0 0 1 16 1 8 119
 (20%) (20%) (30%) (8%) (0%) (0%) (1%) (13%) (1%) (7%)
Illustrations 1 0 0 0 0 19 9 8 1 2 40
 (3%) (0%) (0%) (0%) (0%) (48%) (23%) (20%) (3%) (5%)
Screenshots 3 0 3 3 1 0 1 6 27 1 45
 (7%) (0%) (7%) (7%) (2%) (0%) (2%) (13%) (60%) (2%)
Infographic 0 0 1 0 5 11 2 2 1 0 22
 (0%) (0%) (5%) (0%) (23%) (50%) (9%) (9%) (5%) (0%)
Composite 2 0 0 0 1 67 30 11 0 1 112
 (2%) (0%) (0%) (0%) (1%) (60%) (27%) (10%) (0%) (1%)
Quotes 14 0 0 3 0 1 5 35 2 1 61
 (23%) (0%) (0%) (5%) (0%) (2%) (8%) (57%) (3%) (2%)
Poster 87 0 0 0 0 0 12 2 0 1 102
 (85%) (0%) (0%) (0%) (0%) (0%) (12%) (2%) (0%) (1%)
Total 131 24 40 15 7 98 60 80 32 14

Media and Communication, 2021, Volume 9, Issue 1, Pages 158–170 165
Table 5. Cross tabulations of visuals modes and themes in ‘General’ sample.
 Pro- Populist General Multi- Security/
 Europe Eurosceptic Anti-Elitism Extremism Election Economy Issue Terrorism Immigration
Official 4 13 0 1 0 4 24 0 4
Campaigning (4%) (12%) (0%) (1%) (0%) (4%) (21%) (0%) (4%)
Voting Day 1 0 0 0 0 0 0 0 0
 (2%) (0%) (0%) (0%) (0%) (0%) (0%) (0%) (0%)
Campaign 3 0 0 0 3 0 1 0 0
Event (4%) (0%) (0%) (0%) (4%) (0%) (1%) (0%) (0%)
Citizen 8 1 1 2 0 1 8 1 0
Activism (20%) (3%) (3%) (5%) (0%) (3%) (20%) (3%) (0%)
Polls 0 1 0 0 60 0 0 0 0
 (0%) (2%) (0%) (0%) (95%) (0%) (0%) (0%) (0%)
Political 8 5 3 2 10 1 10 2 1
Humor (13%) (8%) (5%) (3%) (17%) (2%) (17%) (3%) (2%)
Satellite 14 1 2 1 0 1 11 0 2
Campaigning (24%) (2%) (3%) (2%) (0%) (2%) (19%) (0%) (3%)
Other 2 0 3 0 0 0 3 0 0
Political (4%) (0%) (6%) (0%) (0%) (0%) (6%) (0%) (0%)
Reporting 0 0 2 1 14 1 6 0 1
 (0%) (0%) (8%) (4%) (54%) (4%) (23%) (0%) (4%)
Misc./Spam 0 0 0 0 0 0 0 0 0
 (0%) (0%) (0%) (0%) (0%) (0%) (0%) (0%) (0%)
Note: Number of images in each sample, followed by percentages of all images in the relevant mode.

Table 6. Cross tabulations of visuals modes and themes in ‘Exit’ sample.
 Pro- Populist General Multi- Security/
 Europe Eurosceptic Anti-Elitism Extremism Election Economy Issue Terrorism Immigration
Official 0 42 0 0 0 0 0 0 0
Campaigning (0%) (32%) (0%) (0%) (0%) (0%) (0%) (0%) (0%)
Voting Day 0 11 0 0 0 0 0 0 0
 (0%) (46%) (0%) (0%) (0%) (0%) (0%) (0%) (0%)
Campaign 0 12 0 0 0 0 0 0 0
Event (0%) (30%) (0%) (0%) (0%) (0%) (0%) (0%) (0%)
Citizen Political 0 13 2 1 0 0 1 0 0
Activism (0%) (87%) (13%) (7%) (0%) (0%) (7%) (0%) (0%)
Polls 0 6 0 0 1 0 0 0 0
 (0%) (86%) (0%) (0%) (14%) (0%) (0%) (0%) (0%)
Political 0 50 32 14 0 1 0 0 1
Humor (0%) (51%) (33%) (14%) (0%) (1%) (0%) (0%) (1%)
Satellite 0 52 5 3 0 0 1 0 1
Campaigning (0%) (87%) (8%) (5%) (0%) (0%) (2%) (0%) (2%)
Other 0 22 7 3 1 1 2 7 0
Political (0%) (28%) (9%) (4%) (1%) (1%) (3%) (9%) (0%)
Reporting 0 2 1 0 15 7 2 0 3
 (0%) (6%) (3%) (0%) (47%) (22%) (6%) (0%) (9%)
Misc. & Spam 0 0 0 0 0 0 0 0 0
 (0%) (0%) (0%) (0%) (0%) (0%) (0%) (0%) (0%)
Note: Number of images in each sample, followed by percentages of all images in the relevant mode.

Media and Communication, 2021, Volume 9, Issue 1, Pages 158–170 166
First, anti-European visuals, populist anti-elite mes- of claims we can make with respect to the political actors
sages, and to a lesser extent extremist content around behind these visuals. It will therefore be valuable for
religion, were shared in substantial amounts ahead of future work to investigate how visuals are mobilized by
the elections. However, this content was largely dis- party actors as compared to private citizens through
jointed from the mainstream conversation about the actor-based sampling for instance. Lastly, by grounding
election on social media and confined to critical discus- our analysis in real-time social media data our findings
sions of the European project. Experts had expressed are specific to both the temporal and socio-technical con-
concerns about the spread of extremist propaganda texts in which they were collected. Studying visual infor-
and other forms of social media manipulation ahead mation on social media is, finally, an inherently versatile
of the vote, notably around questions of immigration exercise that must consider the multifaceted and chang-
(Dennison & Zerka, 2019). Contrary to these expecta- ing nature of visuals as they develop over time. An inter-
tions, our data shows that extremist messaging predom- esting area for future work, in this respect, will be to
inately revolved around anti-Semitic tropes and pointed further explore the link between the visual and textual
criticism of the purported Islamization of Europe. elements of social media images as they are assembled
 Second, political humor emerged through our analy- and reworked through memetic practice, for example, to
sis as a popular vessel for Eurosceptic and anti-elite move towards more multi-modal understandings of plat-
messaging in social media discourse, especially in the form vernaculars (Pearce et al., 2020). While there are
contentious conversation surrounding EU membership. many ways of analyzing visual content and our approach
Here, humorous visuals in the form memes, cartoons, does not purport to be exhaustive, our analysis nonethe-
and drawings, were predominantly mobilized to make less provides a robust and situated look at visual polit-
ad populum arguments, attack political and economic ical content shared across multiple language spheres.
elites, and to a lesser extent relay extremist viewpoints. Rigorous classifications and thematic analyses of visual
These findings echo scholarship that flagged online polit- social media are not only critical for assessing the qual-
ical humor as a ‘pipeline’ to radicalization and extrem- ities and integrity of online political discourse, but also
ism (Munn, 2019; Phillips & Milner, 2017). Several schol- for bringing forward evidence-based policy and platform
ars also point out that memes, in-jokes, and political recommendations to effectively protect democratic free-
trolling successfully mobilize user and algorithmic atten- doms online.
tion (Marwick & Lewis, 2017; Wu, 2017)
 Third, at odds with growing concerns surrounding Acknowledgments
the credibility and quality of political content circulat-
ing on social media, our data reveals that official cam- The authors gratefully acknowledge the support
paign communication from candidates and political par- of the European Research Council for the project
ties drove the largest proportion of visual traffic, both ‘Computational Propaganda: Investigating the Impact
in the mainstream conversation and in the conversa- of Algorithms and Bots on Political Discourse in Europe,’
tion specifically related to leaving the EU. This evi- Proposal 648311, 2015–2020, Philip N. Howard, Principal
dences the strong impact that traditional political actors Investigator. Project activities were approved by the
continue to have on public conversations around elec- University of Oxford’s Research Ethics Committee,
tions and on the visual content that users encounter CUREC OII C1A 15–044. We are grateful to Civitates and
online. Traditional forms of political visuals like candidate the Omidyar Network for supporting our research in
posters and brochures, or official photographs from the Europe. Any opinions, findings, conclusions or recom-
campaign trail were widely shared on Twitter ahead of mendations expressed in this material are those of the
the vote. Likewise, material from non-party campaigners authors and do not necessarily reflect the views of the
and ‘satellite’ (Dommett & Temple, 2018) issue groups University of Oxford or our funders. We are also grateful
prevailed among Twitter users, embracing novel forms to Samuelle Chinellato, Didac Fabregas, Freja Hedman,
of online political expression, such as annotated screen- Tomasz Hollanek, Juan Lopez Martin, Karolina Partyga
shots and remixed media, to campaign in support or and Francesco Pierri for their contributions to this work.
opposition to the EU as a single issue.
 Our study presents several limitations that high- Conflict of Interests
light the need for further research. The first and
most evident one is the focus on a single platform, The author declares no conflict of interests.
Twitter. While Twitter remains a prime arena for polit-
ical communication—favored by a wide range of polit- Supplementary Material
ical actors—electioneering typically takes place across
several social media platforms. Future research should Supplementary material for this article is available online
therefore investigate how the framework developed in the format provided by the author.
here applies to more visual-centric platforms and their
unique affordances. Furthermore, by opting for topic-
based sampling, we are necessarily restricted in the kind

Media and Communication, 2021, Volume 9, Issue 1, Pages 158–170 167
References 13(1), 51–62.
 Dean, J. (2019). Sorted for memes and Gifs: Visual
Barry, A. M. (2005). Perception theory. In S. Josephson, media and everyday digital politics. Political Stud-
 J. Kelly, & K. Smith (Eds.), Handbook of visual com- ies Review, 17(3), 255–266. https://doi.org/10.1177/
 munication: Theory, methods, and media (pp. 45–63). 1478929918807483
 Abingdon: Routledge. Dennison, S., & Zerka, P. (2019). The 2019 European elec-
Bell, P. (2004). Content analysis of visual images. In T. Van tion: How anti-Europeans plan to wreck Europe and
 Leeuwen & C. Jewitt (Eds.), The handbook of visual what can be done to stop it. European Council on For-
 analysis (pp. 10–34). London: SAGE. eign Relations. Retrieved from https://www.ecfr.eu/
Birdsell, D. S., & Groarke, L. (2007). Outlines of a the- specials/scorecard/the_2019_European_election
 ory of visual argument. Argumentation and Advo- Dommett, K., & Temple, L. (2018). Digital campaigning:
 cacy, 43(3/4), 103–113. https://doi.org/10.1080/ The rise of Facebook and satellite campaigns. Par-
 00028533.2007.11821666 liamentary Affairs, 71(1), 189–202. https://doi.org/
Blair, A. (2004). The rhetoric of visual arguments. In M. H. 10.1093/pa/gsx056
 Helmers & C. Hill (Eds.), Defining visual rhetorics (pp. Edwards, A. (2006). ICT strategies of democratic inter-
 41–61). Mahwah, NJ: Lawrence Erlbaum. mediaries: A view on the political system in the digi-
Bradshaw, S., & Howard, P. N. (2019). The global disin- tal age. Information Polity, 11(2). https://dl.acm.org/
 formation order 2019 global inventory of organised doi/10.5555/1412569.1412572
 social media manipulation (Working Paper 2019.2). European Parliament. (2019). The voting system.
 Oxford: Project on Computational Propaganda. European Parliament. Retrieved from http://www.
Braun, V., & Clarke, V. (2006). Using thematic analy- europarl.europa.eu/unitedkingdom/en/european-
 sis in psychology. Qualitative Research in Psy- elections/european_elections/the_voting_
 chology, 3(2), 77–101. https://doi.org/10.1191/ system.html
 1478088706qp063oa Fahmy, S., Bock, M. A., & Wanta, W. (2014). Visual com-
Burgess, J., & Bruns, A. (2012). Twitter archives and the munication theory and research. New York, NY: Pal-
 challenges of “big social data” for media and com- grave Macmillan.
 munication research. M/C Journal, 15(5). https://doi. Freelon, D. (2018). Computational research in the post-
 org/10.5204/mcj.561 API age. Political Communication, 35(4), 665–668.
Caiani, M., & Pavan, E. (2017). “Inconvenient solidar- https://doi.org/10.1080/10584609.2018.1477506
 ities”: Extreme-right online networks and the con- Gillepsie, T. (2018). Custodians of the Internet: Platforms,
 struction of a critical frame against Europe. In A. content moderation, and the hidden decisions that
 Grimmel & S. M. Giang (Eds.), Solidarity in the shape social media. New Haven, CT: Yale University
 European Union: A fundamental value in crisis (pp. Press.
 145–160). Cham: Springer International Publishing. Graber, D. A. (2012). Processing politics: Learning from
Cámara Castillo, L. (2019). Advertising the European television in the Internet age. Chicago, IL: University
 identity: Instagram analysis on the visual self- of Chicago Press.
 presentation of the European Parliament and the Guerra, S., & Serricchio, F. (2014). Identity and eco-
 European Commission (Master thesis). Univer- nomic rationality: Explaining attitudes towards the
 sity of Helsinki, Helsinki, Finland. Retrieved from EIU in a time of crisis. In B. M. Stefanova (Ed.), The
 https://helda.helsinki.fi/handle/10138/302878 European Union beyond the crisis: Evolving gover-
Cerulus, L. (2019, January 16). Europe’s most hack- nance, contested policies, and disenchanted publics
 able election. POLITICO. Retrieved from https:// (pp. 269–294). London: Lexington Books.
 www.politico.eu/article/europe-most-hackable- Gutterman, R. S. (2018). Ballot selfies: New political
 election-voter-security-catalonia-european- speech in search of first amendment protection in
 parliament-disinformation social media. Wake Forest Journal of Law & Policy,
Chadwick, A. (2013). The hybrid media system: Politics 8(2), 211–258.
 and power. Oxford: Oxford University Press. Guy, H. (2017, October 17). Why we need to understand
Clarke, V., Braun, V., & Hayfield, N. (2015). Thematic anal- misinformation through visuals. First Draft News.
 ysis. In J. A. Smith (Ed.), Qualitative psychology: A Retrieved from https://firstdraftnews.org:443/
 practical guide to research methods (pp. 222–248). latest/understanding-visual-misinfo
 London: SAGE. Hemsley, J., & Mason, R. M. (2013). Knowledge and
Czuperski, M., & Nimmo, B. (2017). #ElectionWatch: knowledge management in the social media age.
 Germany’s AfD utilizes fake imagery ahead of elec- Journal of Organizational Computing and Electronic
 tion. DFRLab. Retrieved from https://medium.com/ Commerce, 23(1/2), 138–167. https://doi.org/
 dfrlab/electionwatch-germanys-afd-utilizes-fake- 10.1080/10919392.2013.748614
 imagery-ahead-of-election-1fa1818ea82a Hemsley, J., & Snyder, J. (2018). Dimensions of visual mis-
de Vreese, C. H. (2005). News framing: Theory and typol- information in the emerging media landscape. In B. G.
 ogy. Information Design Journal + Document Design, Southwell, E. A. Thorson, & L. Sheble (Eds.), Misinfor-

Media and Communication, 2021, Volume 9, Issue 1, Pages 158–170 168
mation and mass audiences (pp. 91–109). Austin, TX: 1461444810365313
 University of Texas Press. Marwick, A., & Lewis, R. (2017). Media manipulation
Highfield, T., & Leaver, T. (2016). Instagrammatics and and disinformation online. Data & Society. Retrieved
 digital methods: Studying visual social media, from from https://datasociety.net/output/media-
 selfies and Gifs to memes and emoji. Communication manipulation-and-disinfo-online
 Research and Practice, 2(1), 47–62. https://doi.org/ Meeker, M. (2019). Internet trends 2019. Bond.
 10.1080/22041451.2016.1155332 Retrieved from https://www.bondcap.com/report/
Howard, P. N., & Hussain, M. M. (2013). Democracy’s itr19
 fourth wave? Digital media and the Arab Spring. Morstatter, F., Pfeffer, J., Liu, H., & Carley, K. M. (2013).
 Oxford: Oxford University Press. Is the sample good enough? Comparing data from
Jungherr, A., Posegga, O., & An, J. (2019). Discur- Twitter’s streaming API with Twitter’s firehose. ArXiv.
 sive power in contemporary media systems: A Retrieved from http://arxiv.org/abs/1306.5204
 comparative framework. The International Journal Munn, L. (2019). Alt-right pipeline: Individual journeys
 of Press/Politics, 24(4), 404–425. https://doi.org/ to extremism online. First Monday. https://doi.org/
 10.1177/1940161219841543 10.5210/fm.v24i6.10108
Karpf, D. (2012). The moveon effect: The unexpected Neudert, L.-M., Howard, P., & Kollanyi, B. (2019).
 transformation of American political advocacy. Sourcing and automation of political news and
 Oxford: Oxford University Press. information during three European elections. Social
Kharroub, T., & Bas, O. (2015). Social media and protests: Media + Society, 5(3). https://doi.org/10.1177/
 An examination of Twitter images of the 2011 Egyp- 2056305119863147
 tian revolution. New Media & Society. https://doi. Neuendorf, K. A. (2019). Content analysis and thematic
 org/10.1177/1461444815571914 analysis. In P. Brough (Ed.), Research methods for
Kitschelt, H. (2006). Movement parties. In R. Katz & applied psychologists: Design, analysis and reporting
 W. Crotty (Eds.), Handbook of party politics (pp. (pp. 211–223). New York, NY: Routledge.
 278–290). London: SAGE. Newhagen, J. E. (1998). TV news images that induce
Klein, O. (2019). LOLitics: The content and impact anger, fear, and disgust: Effects on approach–
 of Dutch populist Internet memes. Unpublished avoidance and memory. Journal of Broadcasting &
 manuscript. Retrieved from https://ssrn.com/ Electronic Media, 42(2), 265–276. https://doi.org/
 abstract=3371224 10.1080/08838159809364448
Larsson, A. O., & Moe, H. (2012). Studying political Nightingale, S. J., Wade, K. A., & Watson, D. G. (2017).
 microblogging: Twitter users in the 2010 Swedish Can people identify original and manipulated pho-
 election campaign. New Media & Society, 14(5), tos of real-world scenes? Cognitive Research: Princi-
 729–747. https://doi.org/10.1177/1461444811422 ples and Implications, 2(1). https://doi.org/10.1186/
 894 s41235-017-0067-2
Lilleker, D. G., Tenscher, J., & Štětka, V. (2015). Towards Pearce, W., Özkula, S. M., Greene, A. K., Teeling, L.,
 hypermedia campaigning? Perceptions of new Bansard, J. S., Omena, J. J., & Rabello, E. T. (2020).
 media’s importance for campaigning by party strate- Visual cross-platform analysis: Digital methods to
 gists in comparative perspective. Information, Com- research social media images. Information, Commu-
 munication & Society, 18(7), 747–765. https://doi. nication & Society, 23(2), 161–180. https://doi.org/
 org/10.1080/1369118X.2014.993679 10.1080/1369118X.2018.1486871
Lyons, K. (2019, October 30). Bring it on memes and Phillips, W., & Milner, R. M. (2017). The ambivalent Inter-
 “guy ropes of self-doubt”: The first UK General net: Mischief, oddity, and antagonism online. Cam-
 Election ads. The Guardian. Retrieved from https:// bridge: Polity.
 www.theguardian.com/politics/2019/oct/30/bring- Reading, A. (2011). The London bombings: Mobile
 it-on-memes-and-guy-ropes-of-self-doubt-the-first- witnessing, mortal bodies and globital time. Mem-
 uk-general-election-ads ory Studies. https://doi.org/10.1177/1750698011
Marchal, N., Kollanyi, B., Howard, P. N., & Neudert, L.-M. 402672
 (2019). Junk news during the 2019 EU parliamentary Rohlinger, D. A. (2019). New media and society. New York,
 elections: Lessons from a seven-language study of NY: New York University Press.
 Twitter and Facebook (Data Memo 2019. 3). Oxford: Rose, G. (2012). Visual methodologies. London: SAGE.
 Project on Computational Propaganda. Schill, D. (2012). The visual image and the political image:
Margetts, H., John, P., Hale, S., & Yasseri, T. (2015). Polit- A review of visual communication research in the
 ical turbulence: How social media shape collective field of political communication. Review of Commu-
 action. Princeton, NJ: Princeton University Press. nication, 12(2), 118–142. https://doi.org/10.1080/
Marwick, A., & boyd, d. (2011). “I tweet honestly, 15358593.2011.653504
 I tweet passionately”: Twitter users, context col- Segesten, A., & Bossetta, M. (2017). Sharing is caring:
 lapse, and the imagined audience. New Media & Labour supporters use of social media #ge2017.
 Society, 13(1), 114–133. https://doi.org/10.1177/ Election Analysis. http://www.electionanalysis.uk/

Media and Communication, 2021, Volume 9, Issue 1, Pages 158–170 169
uk-election-analysis-2017/section-5-the-digital- article/eu-parliament-elections-hacking
 campaign/sharing-is-caring-labour-supporters-use- Tay, G. (2015). Binders full of LOLitics: Political humour,
 of-social-media-ge2017 internet memes, and play in the 2012 US Presidential
Senft, T. M., & Baym, N. (2015). What does the selfie Election (and beyond). European Journal of Humour
 say? Investigating a global phenomenon: Introduc- Research, 2(4). http://dx.doi.org/10.7592/EJHR2014.
 tion. International Journal of Communication, 9, 2.4.tay
 1588–1606. Thomson, T. J., & Greenwood, K. (2020). Profile pic-
Seo, H. (2014). Visual propaganda in the age of social tures across platforms. In S. Josephson, J. D. Kelly, &
 media: An empirical analysis of Twitter images dur- K. Smith (Eds.), Handbook of visual communication
 ing the 2012 Israeli–Hamas conflict. Visual Communi- (1st ed., pp. 349–363). London: Routledge.
 cation Quarterly, 21(3), 150–161. Weller, K., Bruns, A., Burgess, J., Mahrt, M., &
Sorokowska, A., Oleszkiewicz, A., Frackowiak, T., Pisanski, Puschmann, C. (2014). Twitter and society. New
 K., Chmiel, A., & Sorokowski, P. (2016). Selfies and York, NY: Peter Lang Publishing.
 personality: Who posts self-portrait photographs? Woolley, S. C., & Howard, P. N. (Eds.). (2018). Com-
 Personality and Individual Differences, 90, 119–123. putational propaganda: Political parties, politicians,
 https://doi.org/10.1016/j.paid.2015.10.037 and political manipulation on social media. Oxford:
Stokel-Walker, C. (2019, January 10). The EU doesn’t Oxford University Press.
 really have a plan to stop its elections being hacked. Wu, T. (2017). The attention merchants: The epic strug-
 Wired UK. Retrieved from https://www.wired.co.uk/ gle to get inside our heads. New York: Knopf.

About the Authors

 Nahema Marchal is a Doctoral Candidate at the Oxford Internet Institute, University of Oxford, where
 her research focuses on the relationship between social media and political polarization. She is also
 a Researcher at the Computational Propaganda Project. Her other research interests include Internet
 regulation and governance, and the implications of digital technologies for public life.

 Lisa-Maria Neudert is a Doctoral Candidate at the Oxford Internet Institute and a Core Researcher
 at the Computational Propaganda Project, where her work is located at the nexus of political com-
 munication, technology studies and governance. Her current research is looking into the public and
 private governance of policy issues surrounding disinformation through governments and social media
 platforms.

 Bence Kollanyi is a Doctoral Candidate in Sociology at the Corvinus University of Budapest where his
 research focuses on the automation of social media accounts, including the development and the
 deployment of open-source Twitter bots. At the Computational Propaganda Project at the Oxford
 Internet Institute, Bence is responsible for collecting and analysing data from various social media
 platforms.

 Philip N. Howard is a Statutory Professor of Internet Studies at the Oxford Internet Institute and a
 Professorial Fellow at Balliol College at the University of Oxford. He has published eight books and over
 120 academic articles, book chapters, conference papers, and commentary essays on information tech-
 nology, international affairs and public life. He is the author, most recently, of Lie Machines: How to
 Save Democracy from Troll Armies, Deceitful Robots, Junk News Operations, and Political Operatives.

Media and Communication, 2021, Volume 9, Issue 1, Pages 158–170 170
You can also read