Strategically using Applied Machine Learning for Accessibility Documentation in the Built Environment
←
→
Page content transcription
If your browser does not render page correctly, please read the page content below
Strategically using Applied Machine Learning
                                              for Accessibility Documentation in the Built
                                                               Environment

                                                         Marvin Lange1 , Reuben Kirkham2 , and Benjamin Tannert3
                                                     1
                                                        University of Bremen, Bibliothekstr. 1, 28359 Bremen, Germany
arXiv:2107.14506v1 [cs.HC] 30 Jul 2021

                                                                           marvin4@uni-bremen.de
                                                      2
                                                        Monash University, Wellington Rd, Clayton VIC 3800, Australia
                                                                        reuben.kirkham@monash.edu
                                             3
                                                 City University of Applied Sciences Bremen, Flughafenallee 10, 28199 Bremen,
                                                                 Germany benjamin.tannert@hs-bremen.de

                                                   Abstract. There has been a considerable amount of research aimed at
                                                   automating the documentation of accessibility in the built environment.
                                                   Yet so far, there has been no fully automatic system that has been shown
                                                   to reliably document surface quality barriers in the built environment in
                                                   real-time. This is a mixed problem of HCI and applied machine learn-
                                                   ing, requiring the careful use of applied machine learning to address the
                                                   real-world concern of practical documentation. To address this challenge,
                                                   we offer a framework for designing applied machine learning approaches
                                                   aimed at documenting the (in)accessibility of the built environment. This
                                                   framework is designed to take into account the real-world picture, rec-
                                                   ognizing that the design of any accessibility documentation system has
                                                   to take into account a range of factors that are not usually considered
                                                   in machine learning research. We then apply this framework in a case
                                                   study, illustrating an approach which can obtain a f-ratio of 0.952 in the
                                                   best-case scenario.

                                                   Keywords: Accessibility · Built-Environment · Documentation.

                                         1       Introduction
                                         According to the World Health Organization more than one billion people (15%
                                         of the global population) have a disability [9]. For many of these people, mo-
                                         bility remains challenging due to accessibility barriers in the built environment
                                         [16,35,55]. For example, stepped surfaces are inaccessible to any wheelchair user,
                                         whilst inappropriate surfaces like cobblestones can be a barrier for most people
                                         with mobility impairments. Because of these accessibility barriers, many people
                                         with disabilities avoid or limit their travel outdoors, which often excludes them
                                         from wider society, employment opportunities and limiting their quality of life
                                         [31,66].
                                             The mapping of inaccessibility in built environments is a form of empow-
                                         erment in this context [66]. The provision of comprehensive documentation of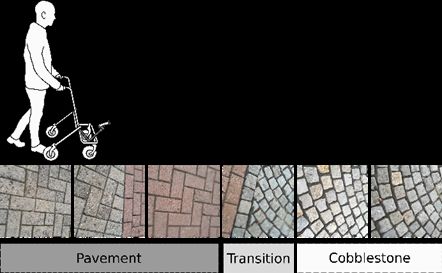
2       M. Lange et al.

(in)accessibility is potentially the cornerstone for a growing accessible built envi-
ronment and the disposal of existing barriers [21]. There is an emerging program
of research aimed at using technology to assist with making this documentation
process more effective, be it via automatic approaches relying on a range of
sensors such as acceleration sensors or depth cameras [37,40,58], direct inspec-
tions, done via crowdsourcing [32,67,8] or hybrid approaches that combine both
methods [32,33].
    At present, the necessary information about the accessibility of sidewalks
is on one hand rarely available, and the limited information that is available is
often unreliable or inaccurate [21]. Routing systems for wheelchair users regularly
present routes containing unnecessary detours and/or inaccessible routes, when
the shortest accessible route is needed [69,70]. Indeed, a cost benefit analysis even
showed that existing systems in use are worse than using plain Google Maps [69].
One aspect that leads to these errors are missing information or misinformation
about the type of surface [69,70]. This basic knowledge about the surface is very
important both for people with disabilities but also for elderly people who have
age related impairments [43].
    We make two important contributions in this paper. First, we outline a
decision-making framework for designing accessibility documentation systems
(that could ultimately be used in a navigation or other system) based on a care-
ful use of machine learning algorithms: the framework addresses the particular
challenges that arise when addressing this unique context. This includes human
rights and accessibility related considerations. Second, we then provide a proof-
of-concept implementation of that framework to a particular scenario, applying
it to the concern of surface classification in Europe. Our implementation has
three distinguishing features (i) it involves a carefully chosen set of classes that
can be practically recognized, (ii) it does not rely on inertial sensors or the mo-
tion of the person taking the records and (iii) focusses upon street segments,
rather than trying to classify individual frames. Our evaluation shows that this
approach is highly effective, obtaining an f-ratio of 0.952 in a best-case scenario.

2     Background

2.1   Benefits of Documenting Accessibility in the Built Environment

To understand the accessibility documentation problem, it is necessary to start
with the purpose of documenting inaccessibility in the built environment. The
overarching issue is one of human experience: the built environment has a mul-
tiplicity of physical barriers for people with disabilities. In some cases, this can
have a serious negative impact on their day-to-day life, reducing mobility, ac-
cess to the workplace, social opportunities and often increasing the level of care
worker support that otherwise would not be needed if a location was accessible
[16,23,60]. Effective documentation offers the following potential improvements
on this situation: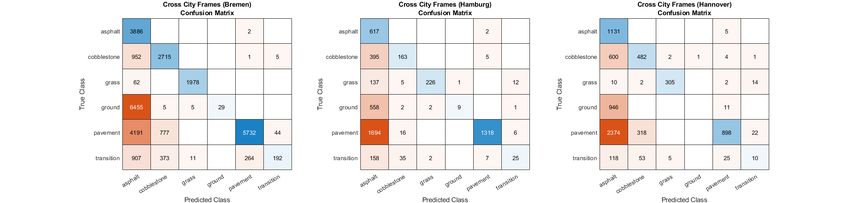
Title Suppressed Due to Excessive Length        3

Navigation and Route-finding. Existing navigation tools do not presently
provide a reliable or effective means for people with mobility impairments to
traverse the built environment [69], with the result of considerable (and often
distressing) inconvenience for many people with mobility impairments [30]. The
problem is the absence of underlying data, with existing maps failing to provide
reliable documentation of accessibility barriers [21], however the inaccessibility
of a given system may also mean that some journeys are impossible [49]. A route-
finding system would need to identify for a given user, in line with their unique
requirements, what route to undertake, with sufficient accuracy as to offer better
routes than existing routing tools. Notably, offering better routes than what
has gone before might not be a high-bar in practice, not least because Google
Maps for pedestrians is currently the best performing system, despite having
no specialist features for computing accessible routes [69]: the simulations in
[49] now provide strong evidence for the feasibility of such an approach. These
limitations are perhaps unsurprising, given the limited amount of work that
focusses on navigation for people with mobility impairments (compared to vision
impairments) [26].

Determining Which Regions to Travel to. People with disabilities have
the opportunity to make choices, such as where to go on holiday, or what parts
of a city to explore. Accurate knowledge of the general level of (in)accessibility
in a given location, and thus the relative risk of not being able to effectively
access it are an important part of making an informed choice: either on where to
travel, or whether support is needed (e.g., a relative, or a care worker). In effect,
this would provide a broad-brush assessment of a location’s level of accessibility,
thus enabling a more informed choice, without having to rely upon a specialist
travel agency (with the considerable expense and limited choice of locations this
entails [13]), or paying for extra support (from a limited budget) ‘just in case’
there is a problem.

Determining and Influencing Change. Presently, planners lack effective de-
tails of the built environment so they can optimize which physical barriers to
address [48]. Given limited public resources, better accessibility mapping would
allow for the built environment to improve more rapidly, by more optimal target-
ing (and prioritization) of physical improvements, including maintenance work
[23]. A general picture that allowed the comparison between municipalities and
nation states would also enable more effective supervision of performance (by
human rights NGO’s, the UN and disability advocates alike) and thereby fur-
thering Article 31 of the UN CRPD (which requires states to collect data to
formulate and implement policies, as well as to demonstrate compliance with
that convention) [2].

Measuring the Effect of the Built Environment. Fitness tracking has been
recognized as an important concern, especially for people with mobility impair-
ments [14]. Whilst it is now possible to effectively track the number of strokes
4       M. Lange et al.

with a fitness tracker [19], tracking where someone has been can provide more
detailed performance information: this is because it is more (or less) effort to
traverse different types of surfaces [55]. For someone learning how to use a man-
ual wheelchair, this could also be an indication of rehabilitation progress and/or
increased skill/confidence in using the chair: notably measuring real-world skill
and performance is an important part of wheelchair skills training [45,44] (as well
as separately, the assessment of disability benefits which focus on the level of
functional impairment [74]). Separately, rough surfaces increase harmful whole-
body vibration, with a long-term negative effect upon health [22,76], so tracking
the quality could also be useful for longitudinal healthcare studies of wheelchair
users.

2.2   Existing Approaches towards Documenting (In)Accessibility in
      the Built Environment

An Ideal Accessibility Measurement System. One way to understand the
limitations of a measurement system is to compare it against an ideal system.
An ideal system would accurately capture all relevant categories of accessibility
information, be it the presence or absence of the appropriate affordances (such as
dropped curbs [48], audible street crossings [10,46]) or the quality of the surface
itself (e.g., does it contain trip hazards [15], or cause dam-aging whole-body
vibration [13,65]). It should also capture temporary or transient barriers (e.g., a
street that is partially obstructed for blind people because bins are placed on the
street [12,60]), as well as an up-to-date picture of the environment itself. Finally,
it should be economically efficient enough to ensure complete coverage, so that
it can be used effectively in a navigation system [21,69].

Manual Expert-Driven Documentation. The most notable expert driven
system is AccessAble (formerly known as Disabled Go) [1]. This involves a rigor-
ous and expensive process of direct documentation by an expert of every feature
in the built environment within a confined area (e.g., the local high street), per-
formed by an expert assessor on behalf of the local authority. PhotoRoute [6]
serves a similar, but discrete function: a venue can request a photo illustrated
accessible route from an important landmark (e.g., a Train Station) to enable
attendees to follow the most appropriate route. Whilst expert-driven systems are
effective for the limited routes and locations that they actually cover, they have
the limitation of sparse coverage caused by the underlying expense of adopting
them (these exercises are notoriously “laborious and time consuming” [21]). The
overall effect they simply do not scale to provide adequate coverage, with the
exception of confined (but important) situations.

Semi-Automated and Crowdsourcing Approaches. There has been a con-
siderable focus on crowdsourced approaches with the aim of obtaining scala-
bility. Perhaps the most successful has been Project Sidewalk [67], which has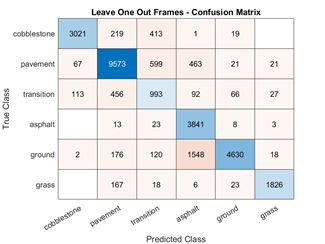
Title Suppressed Due to Excessive Length       5

managed to cover an entire urban area using Google Street View data, how-
ever, there were challenges with annotator accuracy in respect of certain data
categories. Other semi-automated approaches have focused on accelerating the
video-documentation of barriers in the town-planning setting, such as Wheelie-
Map [48]. For providing landmarks for people with visual impairments, this has
been successfully crowdsourced in the context of public transport [30].
    Less-structured ‘geocrowdsourcing’ approaches have encountered significant
problems in respect of their ability to accurately document barriers [54], whilst
lacking effective user engagement and thus coverage [21]. A notable ‘real world’
exception is the widely used FixMyStreet [3], which is a MySociety project aimed
at general problems in the local community, but also serves as a platform for re-
porting some accessibility related problems (e.g., potholes). At present, there is
no crowdsourced or semi-automated system that works in real-time for obtaining
standardized reports of inaccessibility, nor one that does not rely on Google
Street View (which can be many years out of date and is effectively banned in
many countries, e.g., Germany [54]).

Automated Approaches. In an ideal world, the most effective approach to-
wards accessibility documentation would be an automated one, given the rela-
tively lower cost. There are numerous works that claim to offer a viable system
for using inertial sensors mounted on mobility aids (e.g., wheelchairs) to mea-
sure the accessibility of the built environment [38,39,40,51,77]. Unfortunately
the evaluations that are said support these claims are based on ’toy problems’
in respect of the data being collected in a laboratory rather than in the real
world (meaning the findings are unlike to apply there [63]. Furthermore, they
fail to use the appropriate leave-one-out metric of evaluation [29] (in some cases,
participants were left out, but they all followed the same route, which is also a
serious error). Another problem is that there are no performance metrics used
that relate directly to problems in accessible navigation: typically F-scores or
precision and recall of instances were used, which does not directly relate to
problems of concern: whilst there are alternative metrics (e.g., as in [73]), these
do not apply to accessible navigation.
    In respect of work outside of inertial sensing, there has been some mod-
est success. Some work has explored using aggregate GPS mapping to indicate
where people have not gone [56,62], but that overlooks surface quality, and over-
looks the subjective nature of accessibility barriers. Computer vision has been
success-fully used to detect tactile paving [24], in hybrid approaches aimed at
supporting annotation [32,33] and in identifying street crossings [10,11]. Deep
learning approaches have been recently used to identify street features and acces-
sibility barriers in the United States, yet there remains substantial challenges in
respect of achieving sufficient accuracy for a navigation system, with an F-score
of around 0.8 being the present state of the art [75].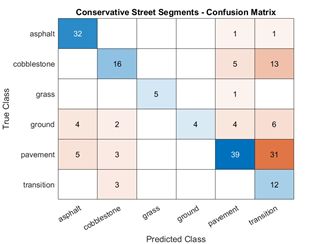
6       M. Lange et al.

3     A Practical Framework for Designing a Machine
      Learning based Accessibility Documentation System
Automating accessibility documentation is in effect an applied machine learn-
ing problem. However, this problem has unusual and important qualities that
present particular challenges, meaning it cannot be treated as a usual human
activity recognition or documentation problem. For instance, there are substan-
tial difficulties in determining what to classify (given the breadth of disabilities
involved [26]), there are substantial ‘grand challenges’ (such as the need for eco-
nomic efficiency) [21] and there is also the need to design documentation tools
that are themselves accessible for disabled people. We distill the design challenge
into five considerations that collectively constitute a framework for designing
a machine learning approach in this setting. Whilst many of these observations
are arguably routine (or even obvious), they all reflect concerns that are most
often overlooked or not properly addressed (and which have important disability
specific qualities), hence the need for this exercise.

3.1   Issue 1: What to classify and how to classify it?
Machine learning operates on the basis of data: a set of labelled data is used to
train (and then test) an algorithm ‘learned’ through this process. In practice, this
involves consistently annotating a dataset so that each item is labeled with one or
more classes or categories. There is limited agreement amongst disabled people as
to what constitutes an accessibility barrier or which barriers are most important
[48], making such categorization controversial. This is especially so given that
existing research on accessible navigation has been skewed away from certain
groups [26], thus there is a need to ensure that a wider range of measures of
potential inaccessibility are provided going forwards. The choice of categories also
needs to work effectively from an engineering perspective, which is challenging
enough at the best of times [59,64]. This means there is a need to carefully
select and then justify an appropriate set of classes in respect of the challenging
disability-specific scenario, whilst ensuring they are well defined enough to enable
a robust division between testing and training data.

3.2   Issue 2: How to measure performance (and success)?
Measuring performance involves dividing data into testing and training datasets,
before training an algorithm on the training data, and then testing the resulting
algorithm on the testing data. For this to be a fair comparison, there needs to be
a proper division between testing and training data. In the scenario of activity
classification, the widely used ten-fold random cross-validation is inappropriate
due to the way it mixes these two categories together and inflates performance:
instead, a leave one out strategy should be used to avoid this problem [29] With
respect to inertial sensing for accessibility documentation, not using a leave
one out approach has been shown to vastly inflate reported performance [53]:
nevertheless, this inappropriate practice remains widely used.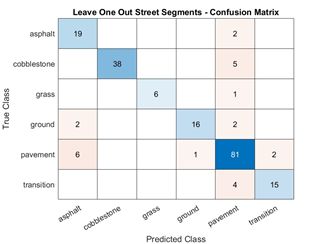
Title Suppressed Due to Excessive Length        7

    In machine learning research, different algorithms are benchmarked using
standardized datasets in order to compare their performance [68]. Yet, at present,
there is no such dataset for accessibility recognition in the built environment (nor
given the diversity of approaches, is one desirable or possible), representing an-
other substantial problem, in that it is not possible to easily compare systems
and works in this domain. Another issue in measuring performance is to use
domain-appropriate metrics [73], that indicate the real world implications of
the system if it were to be translated into practice: yet there are no domain-
appropriate metrics for accessibility mapping. Activity recognition systems can
be particularly prone to bias in respect of certain types of disabled people, in part
due to limitations with testing and training data (and how this is evaluated),
which is an issue that has only just begun to be addressed [25,51,72]. Thus
measuring performance is one of the biggest concerns in designing an accessibility
documentation system, especially as this determines what will be deployed in
practice (especially when experiments are conducted in order to choose which
approach to use, as is usual in machine learning research [18]).

3.3   Issue 3: What measurement apparatus to use?
The choice of sensing apparatus underpins the design of a system: it is the source
of information for classification. This involves deciding between what sensors to
use (e.g., accelerometer, gyroscope, camera) and how/where to mount them, be
it to a person, wheelchair or any other device that is capable of movement or
being propelled. One important disability related challenge is the diversity of
motion (arising from each individual mobility impairment): consideration has
to also be given to the population who propel a device or to whom a sensor is
attached. For example, different wheelchair users propel their chairs in different
ways, and each wheelchair is highly customised to the specific anatomical re-
quirements of its user [71], thus a source of variability that risks any algorithm
not generalizing across wheelchair users, if it is dependent on how they move (ap-
proaches such as static cameras are less problematic in this regard). Thus, the
wider concern of ‘bias’ and ‘fairness’ in AI, is also a prominent concern in respect
of the choice of measurement apparatus [25,57,72]. Moreover, there is need to
ensure that any means of affixing and operating the hardware is physically acces-
sible in and of itself (typically commodity camera clamps have been used, which
works well for manual wheelchair users, but might not be so effective in other
circumstances [48]). The choice of measurement apparatus is therefore particu-
larly complicated in respect of people with mobility impairments. As such, the
choice of measurement apparatus must work practically for the people who have
to use it (taking into account any relevant disabilities), as well as not depending
on the characteristics of the individual user.

3.4   Issue 4: What (machine learning) algorithm to use?
Machine learning involves representing data by a list of features, which is a set
of numbers that describes each element to be classified. When deployed, these
8 M. Lange et al.
features are then fed into a classifier to produce a prediction, or label. There
are multifarious ways of providing features, including statistical means and mo-
ments, as well as specialized functions and rules [28]: in some cases, as with
neural net-works, the pixels of an image can be submitted directly as features to
an input layer [61]. The machine learning algorithm will learn the appropriate
decision rule based on the data provided via its feature representation. Thus,
there are two choices to make: the first is the feature representation, whilst the
second is the machine learning classifier itself (e.g., KNN, SVM), although in
some cases (e.g., Deep Learning) these issues somewhat shade into each other.
This combination can have practical issues, for example different features and
classifiers are more robust to different types of error, whilst there can be con-
siderable effects on battery life and speed of prediction depending on whether
features are handcrafted and if certain forms of classifiers are used [34].
Typically, the choice of classifier is decided experimentally. The difficulty in
respect of disability arises this way: given the variety of settings and different
impairments types, there is a need to particularly emphasize the robustness of
the algorithm to signal noise and the diversity of different approaches. This
can also require using a care-fully constructed training/testing set that properly
takes this into account. At the same time, there can be wider considerations that
go beyond performance: for instance, there is a need in some cases to provide
transparency of decision making, which itself varies across classifiers.
3.5 Issue 5: How to address legal and economic considerations?
A practical system for measuring the accessibility of the built environment has
to work in the real world: the nature of disability poses challenges, this time
from a societal perspective. For disability, the primary concern is an economic
one, with accessibility mapping systems having wholly insufficient coverage due
to the expense of measuring and documenting accessibility barriers [21]. So a
successful system must have a clear economic model and roadmap that has suf-
ficient cover-age: from a practical point of view, it should be suitably efficient
and inexpensive to obtain the required data. Another consideration is legal: the
main barrier is privacy concerns (a barrier that has tripped up systems such
as Google Street View in many countries, especially in Europe, where there are
human rights considerations). However, the law also presents opportunities, as it
places obligations on organizations, potentially including providing supporting
infrastructure [46] under disability human rights law. Designers should consider
how to use legal obligations (especially the duty to make reasonable accommo-
dations) to make it more likely that a system will be adopted. At the same time,
access to information legislation and human rights law may also present design
opportunities [47] – it is important to think more holistically about legislation,
as even arcane provisions can serve as alternatives. Accordingly, there is need to
have an economic model that also takes into account the wider legislative con-
text – if a system is not able to lawfully and efficiently provide documentation,
then it will probably be inadequate when used in practice.Title Suppressed Due to Excessive Length 9
4 Proof of Concept Case Study – Application of our
Framework
4.1 Scenario: People with Mobility Impairments in Europe
In what follows, we present a carefully chosen example that illustrates how
our system might be applied to produce a useful system for some people with
a mobility impairment. Choosing a scenario that is likely to demonstrate a real
world impact mostly relates to Issue 1 in our framework. Our scenario con-
cerns a form of sensing that addresses surface types in the European Context.
In Europe, there is a long-standing legacy of old areas, with cities including
cobblestones, grass paths and legacy paving types. Compared to countries like
the United States or Australia, European cities tend to have evolved organi-
cally to include a diverse variety of different path types within a small space:
this is due to the fact that most cities were based on medieval structures and
layouts [50]. The advantage of European style cities is that they have relatively
short path segments, so it is not as critical for street features (e.g., curb-cuts)
to always be in the right place, compared to US cities that have relatively large
street blocks [50]. Moreover, the existence of relevant accessibility affordances is
highly correlated with the surface type, because newer surfaces (e.g., asphalt)
will normally involve the installation of accessibility features as they are replaced
[32]. Taking a holistic view in line with [26], we focus on classifying surfaces, as
classifying them into different types could substantially improve navigation for
people with mobility impairments, without the difficulties of directly classifying
specific street features.
4.2 Methodology
Data Collection. We mounted a modern smartphone via a commodity camera
mount (similar to that used in [48]) on a rollator (or walker) (see Figure 1).
We chose a camera based approach given that inertial sensors are sensitive to
individual users and have so far not shown promising performance for accessi-
bility documentation. The smartphone was mounted at a height of 50cm at a
60° angle so that the surface could be directly observed, whilst ensuring that
identifying pictures of individuals was not captured, in line with the approach
of [48]. The advantage of this privacy sensitive approach is that we address an
important concern in respect of Issue 5 of the framework, as a system that does
not meet this requirement might not be permitted in a range of circumstances
(similar to the fact that Google StreetView is effectively banned in Germany).
The camera covers a horizontal swath of about 1.15 m: this exceeds (by over
25%) the legal standard for barrier-free construction in Germany (DIN-18040)
that says that the width of a path has to be 0.9 m for ease of access by wheelchair
users. This field of view also minimizes the risk of capturing other objects, oc-
clusions and other confounding information, thereby increasing the subsequent
prediction quality [52].10 M. Lange et al.
The smartphone took a photograph every 800ms, which were saved alongside
their respective timestamp and GPS location. We traversed all of the available
paths within a series of defined geographical regions in three cities, with a total
path length of 36.22km within an area of 1.641km2 . The paths were traversed
in 6 days by one person using a rollator. This approach was designed to ensure
that the data collected was as naturalistic as possible while reflecting the variety
of different surfaces, thus helping address an important concern associated with
Issue 2. The relatively cheap nature of the hardware (around $100) and the
fact that data collection fits with ordinary day to day activities are intended
to help address the economic concerns noted as being fundamental in Issue 5.
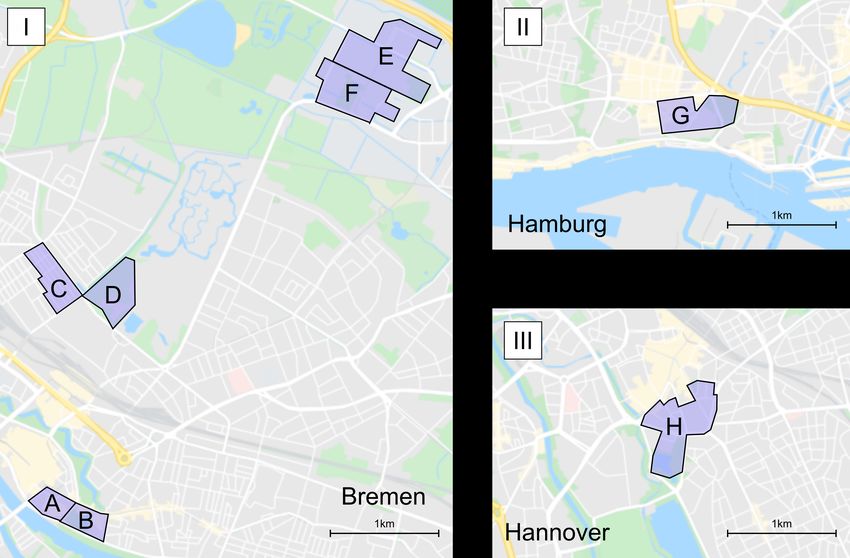
For Bremen, the regions (see Figure 3I) include the city centre (areas A and
B), a suburb (C and D) and a university campus area (E and F), whilst we also
collected smaller areas of different cities, namely Hamburg (see Figure 3II) and
Hannover (see Figure 3III) to enable further experiments.
Fig. 1. The data collec-
tion apparatus, including
the smartphone position- Fig. 2. An illustration of how transitions were identified and
ing labelled in the collected data
Data Categorization. A key concern was to have easily annotatable categories
that relate to the real concerns of people with disabilities. To address this part
of Issue 1, the categories for the surfaces are a subset of those provided in
OpenStreetMap, which is the pre-dominant open source mapping framework [27].
The advantage of using Open-StreetMap is that these categories are widely tested
and used in practice (allowing them to be easily and consistently annotated), as
well as having already been con-figured to be usable by people on the ground.
Taking account of the framework for considering accessibility barriers in [58],
these categories were carefully curated and merged to: (i) eliminate categories
that were not present in the locale (e.g., snow, ice and salt), (ii) to ensure that the
boundaries between categories that are well defined (so they can be effectively
annotated), merging where necessary and (iii) to ensure that only categories thatTitle Suppressed Due to Excessive Length 11 Fig. 3. Map of regions within the city that were explored for our evaluation. In Figure 3(I) covering ‘Bremen’ A and B are in the city centre, C and D are in a suburb, whilst E and F are within a University campus of a major University. Figure 3(II) covers ‘Hamburg’, whilst Figure 3(III) covers ‘Hannover’. are relevant to wheelchair accessibility were included. The resulting categories are listed below, with indicative examples being provided in Figure 4: Asphalt: Asphalt is an improved surface that is generally prioritised by wheelchair routing tools, due to its smooth quality (provided it is maintained) and the like- lihood of other accessibility affordances being available (e.g., dropped curbs) [5,7]. Cobblestones: Cobblestones are an old form of paving, which is inaccessible to many wheelchair users and present a severe trip hazard [42]. In practice, they are to be avoided by any routing tool, if at all possible. Ground/ Unimproved: This is a path that is a dirt track, perhaps including gravel. Whilst this surface type is generally traversable (albeit uncomfortably [17,42]), there is a reduced likelihood of there being accessibility affordances, due to the unimproved nature of this path. Grass: This is where there is no path at all, for example where someone has been directed through a park. This is a difficult surface for most wheelchair users to traverse [17], whilst also indicating that there no substantive path, thus meaning that accessibility affordances (for instances, markers for visually impaired people to aid navigation are less likely to be present, given the open nature of these spaces).
12      M. Lange et al.

Pavement: Pavement (see Figure 2) is an improved surface that is generally
prioritised by wheelchair routing tools, due to its smooth quality (provided it is
maintained) and the likelihood of other accessibility aid (e.g., dropped curbs).
However, unlike asphalt, it can be an intrinsic trip hazard to wheelchair users
(and ambulant people with gait or visual impairments), due to small variations
in slab height [20].

    We also annotated transitions between more than one category separately
(in effect making them as a sixth class), with a transition being defined as the
point where more than one different surface class was simultaneously visible to
the camera. This process is illustrated in Figure 2. More generally, the ground-
truth labelling of the images was performed by the research team over a period of
two working days. This could be done efficiently due to the fact that consecutive
images often had the same surface (with a mean of 64.93 images being in a
batch), allowing for a Panopticon [41] style approach to be used to speed up the
annotation (but with frames, rather than videos).

Testing and Training Data. The choice of appropriate testing and training
data specifically fits within Issue 3. We adopted two different types of leave one
out approach for testing and training our approach:

Fig. 4. Exemplars of different classes, from left to right: (A) Asphalt, (B) Cobblestones,
(C) Ground/Unimproved, (D) Grass, (E) Pavement and (F) Transition.

Conservative: This is where areas geographically close together are not trained
together. In practice this means testing areas A and B together (with areas C,
D, E and F being the training data) and so on for areas C and D, and E and F.
This makes three areas, S1 (equal to A and B), S2 (equal to C and D) and S3
(equal to E and F). The approach here is designed to be a ‘worst-case-scenario’
and is highly likely to understate recognition performance.

Leave one region out: In this case, we only leave one region out. For exam-
ple, Region C would be trained on Regions A, B, D, E and F. This approach is
designed to be in line with typical performance, if further training data were to
be collected (for example in other cities).
Title Suppressed Due to Excessive Length 13
By deliberately ensuring that the same area does not appear in both the
testing and training data, we avoid the error that has been made in most previous
works on accessibility mapping and thus ensure our algorithm generalizes to
novel examples that it was not trained on.
The Machine Learning Algorithm. Recent developments in deep learning
and in particular the use of Convolutional Neural Networks has led to substantial
improvements in surface texture classification [52]. Addressing Issue 4 requires
adopting an approach which is already known to be effective for the problem
at hand. We adopt one such approach, relying on the architecture of ResNet50
[36]: notably, ResNet approaches have already been used in other accessibility
documentation scenarios [75]. This network architecture was retrained afresh
on our dataset, with the only modification to this architecture being in the
final layer, which was changed to have the correct number of output nodes. The
images were cropped to a window of 480 by 480 pixels (the camera was positioned
in portrait mode, with the bottom 160 rows being cropped). This was then
interpolated to 224 by 224 pixels to be an appropriate resolution for ResNet50
implementation. We deliberately adopted a ‘motion independent approach’ to
address the concern (per Issues 2 and 3 ) that machine learning algorithms are
not well adapted to people with disabilities (and the fact that there re-mains
a lack of metrics to evaluate the extent of this problem). Specifically, to ensure
that our approach was independent of the motion of the rollator, each frame
was trained independently of each other: we did not use any computer vision
techniques (such as optical flow) that deal with sequences of images.
4.3 Results
Based on the real-world application of our framework we got results referring to
the data collection and categorization but also for the performance of the trained
system itself. The latter can be considered in relation to leave one out frames and
conservative frames whereby both are investigated framewise and “streetwise”.
The first three results subsections focus on Bremen, whilst our final exercise
compares the three cities.
Data Collection and Distribution. The eight regions A-H were all anno-
tated, producing a total of 41321 individual frames. As can be seen in Table
1, there is skew in the class distribution, with certain types of surface being
more common than others. The most common surface type was the pavement,
followed by unimproved surfaces. Two of our analyses focus on within city per-
formance and thus just ’Bremen’, whilst we look at cross-city performance in
Section Cross-City Performance.
Framewise performance. We report the raw performance per frame based on
both approaches, conservative and leave one region out based on ’Bremen’. The14 M. Lange et al.
Table 1. Summary of data collected, including class label distributions, by individual
frame. Regions A to F are all in Bremen.
Ground/Unimproved
Total (in Region)
Cobblestone
Transition
Pavement
Asphalt
Region
Grass
A 0 1656 0 0 930 632 3218
B 44 577 0 1224 1696 423 3964
C 1017 47 0 0 3501 300 4865
D 78 132 662 4252 0 39 5163
E 1500 476 571 288 1940 161 4936
F 1249 785 807 730 2677 192 6440
G (Hamburg) 619 563 381 572 3034 227 5396
H (Hannover) 1136 1090 333 957 3612 211 7339
Total 5643 5326 2754 8023 17390 2185 41321
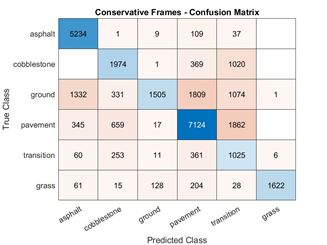
Fig. 5. . Confusion Matrices for both ‘Conservative’ and ‘Leave one region out’ on a
Frame basis.Title Suppressed Due to Excessive Length 15 Fig. 6. Confusion Matrices for both ‘Conservative’ and ‘Leave one region out’ on a Street basis. conservative performance was a mean F1-score [28] of 0.621, whilst the leave-one- region-out mean F1-score was 0.802. The more detailed performance can be seen in the con-fusion matrices, Figure 5, which shows that most relevant categories (asides transitions) were easily distinguishable, but with reduced performance in respect of certain categories, for example ground was regularly confused with asphalt and in the more conservative approach, with other categories. Aggregated ‘Streetwise’ Performance. In practice, the concern is to iden- tify whether streets contain problematic elements, rather than identifying each frame. Following [73], we therefore report results on a streetwise level using an aggregation process, addressing an important concern under Issue 2 which hitherto has not been addressed in the context of accessible mapping. The con- servative performance was a mean F1-score of 0.593, whilst the leave one region out mean F1-score was 0.871. The more detailed performance can be seen in the confusion matrices, Figure 6, which shows that most relevant categories (asides transitions) were easily distinguishable in the leave one region out case. In respect of the more likely leave one out approach, the effect is to substantially increase the performance (there was a slight decrease in the other case, but this could be statistical noise), whilst reporting the results in a manner that more directly relates to real world performance. Cross-City Performance. We present the performance of our approach where a system is only trained on data from other cities (so for example we would train on ‘Hamburg’ and ‘Hannover’ and test on ‘Bremen’). This performance is poor, making it clear that some training data within a city is necessary. In respect of frame-wise performance, we obtain a mean F1-score of 0.495 for ’Bremen’, 0.378 for ’Hamburg’ and 0.378 for Hannover (Hannover was slightly higher, but rounding to three decimal places, we get the same value as for Hamburg). For streetwise performance (following the same process in Aggregated ‘Streetwise’
16      M. Lange et al.

Fig. 7. Confusion Matrices for both ‘Conservative’ and ‘Leave one region out’ on a
Cross-City basis.

Performance), we obtain a mean F1-score of 0.487 for ’Bremen’, 0.278 for ’Ham-
burg’ and 0.333 for Hannover. In Figure 7, we provide the confusion matrices
illustrating more detailed performance.

5     Discussion

5.1   Real-World Surface Recognition Performance

Our framework was helpful in designing a practical system that obtained a high
real-world performance. It is apparent from the results above that is possible
to reliably recognize different surface types using our approach. The more con-
servative approach performed worse, as one would expect, partially because of
the reduced volume of training data: however, even in this relatively extreme
scenario, the performance would still improve upon existing tracking systems
(noting that none of these is any better than pedestrian routing tools [69]) and
is substantially better than choosing a given route by chance.
    The less conservative and more realistic (taking into account the considera-
tions in [29]) approach of leave one region out yielded stronger performance and
if this were to be real world performance, would lead to appreciably (rather than
technically) better approaches for routing people with disabilities. Moreover, this
approach is promising for other goals in addition to making more effective rout-
ing tools: for example, this approach would be sufficiently accurate to estimate
the accessibility of a given city, or the distance travelled by someone on a rough
surface.
Title Suppressed Due to Excessive Length 17
In a real-world context, the decision to be taken really is a two-class problem
– whether or not a path segment is accessible. As such, the general f-ratio across
our six classes actually considerably understates performance in a navigation
scenario. A more realistic approach would ignore the transitions (which could
normally be identified using GPS and existing maps) and split the remaining
classes. For example, doing this with asphalt and pavement being considered
to be suitable surfaces and the rest be deemed unsuitable would lead to an
f-ratio of 0.952 per street segment, if applied to the leave one out scenario.
This would be adequate to produce an accuracy on a route of over 82%, if
each route was assumed to be 4 path segments long and the accessibility of each
segment independent from one another. However, this assumes that training data
is collected from the same city in a sufficient volume to be adequate: training on
one city and using it for another was shown to be infeasible (see Section Cross-
City Performance) above, thus emphasizing the need for data to be quickly
obtainable.
5.2 The Importance of Frameworks: Accessibility mapping as a
strategy problem
Our approach evidences the advantages of a camera mounted to a mobility aid
(and combined with GPS) as being a model for accessibility barrier detection
and mapping. By carefully considering the framework questions we set out in
designing a sensing system in this space, we were able to adapt existing machine
learning approaches to create a practical and realistic approach for surface class
detection. From a practical point of view, our approach is fully automatic, can
be done by attaching a simple device to any mobility aid (in part due to the mo-
tion independent design) and training data can be annotated at speed relative
to motion-based systems. Indeed, training such a system is very economic, given
the data can be collected and annotated in a matter of a few days, meaning it
would be feasible to perform this exercise for each individual city (thus greatly
reducing the practical impact of the relatively low ’cross-city’ performance, i.e.
where a system trained on one city is used in another). We also fully address im-
portant legal issues, especially privacy, which can be a practical challenge (e.g.,
in Germany, there remain heavy restrictions that would otherwise apply to street
photography per the “Bundesverband Informationswirtschaft, Telekommunika-
tion und neue Medien” [4]). At the same time, this work can be directly used
in a specific setting: for instance, the documentation generated by the surface
detection described in our case study might in turn be used in a navigation tool
to reduce risk of falls in elderly people by reducing the probability they will need
to follow a route containing an unimproved surface.
In effect, this work treats accessibility mapping as primarily a strategy prob-
lem, rather than a technical machine learning problem. It reflects the fact that
there is a ‘bigger’ and more complex picture that is perhaps unique to accessi-
bility sensing. In articulating these concerns and providing an exemplar of how
to address them, we offer a clear road forwards in offering an automated ap-
proach, which we hope help resolve the wider challenge of inaccessibility in the18 M. Lange et al. built environment. Our approach of developing a set of practical principles that could be adopted more widely (rather than just focusing on one system) offers a means for addressing wider concerns about AI fairness with respect to people with disabilities, with the principles we have identified in respect of accessible navigation serving as a potential starting point for frameworks that apply to other settings. 5.3 Real world performance Our work is the only one so far to adopt a real-world approach towards assess- ment of performance, including in respect of appropriate metrics in line with [73]. This is an important consideration that should be taken up in this field: presently it is not possible to understand the performance of existing systems and thus to understand progress. The implications of this for our work is that we can reliably expect our results will generalize and thus have clearly illustrated the benefits of our camera centric approach for accessibility mapping. We expect (and sincerely hope) that a renewed focus on performance metrics that more di- rectly relate to the problem of accessible navigation will be something given an increased emphasis in this sphere. Going forwards, this would allow us to directly determine whether our work is more effective than others, as presently it is very difficult to compare real-world navigation performance as existing papers do not report ‘street segment’ performance. 5.4 Limitations This work has clearly shown the advantage of a given strategy in documenting accessibility barriers in the built environment, yet we still have some important limitations. First, whilst we identify appropriate surface types, this does not ad- dress the need to identify broken surfaces (e.g., cracks in the pavement) and other trip hazards. Second, the dataset only contains pictures from a six-day period without influence of rain or seasons like snow. The third concern is motion- blur, which occurs where there are quick movements to pull the apparatus up a curb: addressing this may increase performance (e.g., using optical flow to give less weight to frames that include this). Fourth, future work may have a larger dataset available, potentially increasing performance further, likewise with any approach that combines multiple sources of information, as opposed purely our on-ground assessment process. Finally, we note that our framework itself should evolve, as we develop our knowledge of fairer machine learning approaches for people with disabilities, and better accessibility documentation systems. 6 Conclusion and Future Work We have presented a new approach towards documenting accessibility barriers in the built environment and measuring the performance of a recognition system in this space, focusing on the practical problems faced by people with disabilities.
Title Suppressed Due to Excessive Length          19

This approach is pragmatic, reflecting that the problem of concern is an inter-
section of HCI concerns and applied machine learning. To explore this approach,
we presented a case study, which implemented an instance of our framework in
a fully automated pipeline that operates effectively in the navigation context.
Future work could explore more instances of this approach, thereby helping to
concrete this strategy for documenting barriers going forwards, as well as trans-
lating it to a real-world system.

References

 1. Accessable, https://www.accessable.co.uk/, [Online; accessed 2020-01-31]
 2. Convention on the rights of persons with disabilities (crpd) | united
    nations      enable,      https://www.un.org/development/desa/disabilities/
    convention-on-the-rights-of-persons-with-disabilities.html,                  [Online;
    accessed 2021-01-27]
 3. Fixmystreet, https://www.fixmystreet.com/, [Online; accessed 2016-09-18]
 4. Machine learning und die transparenzanforderungen der ds-gvo p. 44
 5. Openrouteservice (https://www.openrouteservice.org)
 6. Photoroute, http://www.photoroute.com/, [Online; accessed 2016-09-14]
 7. Routino (https://www.routino.org),
 8. Venues | axs map, https://www.axsmap.com/, [Online; accessed 2020-01-31]
 9. World report on disability 2011 (2011)
10. Ahmetovic, D., Manduchi, R., Coughlan, J.M., Mascetti, S.: Zebra crossing spotter:
    Automatic population of spatial databases for increased safety of blind travelers.
    p. 251–258. ACM (2015)
11. Ahmetovic, D., Manduchi, R., Coughlan, J.M., Mascetti, S.: Mind your crossings:
    Mining gis imagery for crosswalk localization. ACM Transactions on Accessible
    Computing (TACCESS) 9(4), 11 (2017)
12. Atkin, R.: Sight Line: Designing better streets for people with low vision (2010)
13. Bowtell, J.: Assessing the value and market attractiveness of the accessible tourism
    industry in europe: a focus on major travel and leisure companies. Journal of
    Tourism Futures 1(3), 203–222 (2015)
14. Carrington, P., Chang, K., Mentis, H., Hurst, A.: ”but, i don’t take
    steps”: Examining the inaccessibility of fitness trackers for wheelchair
    athletes. p. 193–201. ASSETS ’15, ACM, New York, NY, USA (2015).
    https://doi.org/10.1145/2700648.2809845,            http://doi.acm.org/10.1145/
    2700648.2809845
15. Chen, W.Y., Jang, Y., Wang, J.D., Huang, W.N., Chang, C.C., Mao, H.F., Wang,
    Y.H.: Wheelchair-related accidents: relationship with wheelchair-using behavior in
    active community wheelchair users. Archives of physical medicine and rehabilita-
    tion 92(6), 892–898 (2011)
16. Clarke, P., Ailshire, J.A., Bader, M., Morenoff, J.D., House, J.S.: Mobility, disabil-
    ity and the urban built environment. American Journal of Epidemiology 168(5),
    506–513 (2008)
17. Daveler, B., Salatin, B., Grindle, G.G., Candiotti, J., Wang, H., Cooper, R.A.:
    Participatory design and validation of mobility enhancement robotic wheelchair.
    Journal of Rehabilitation Research & Development 52(6) (2015)
20 M. Lange et al.
18. Drummond, C., Japkowicz, N.: Warning: Statistical benchmarking is addictive.
kicking the habit in machine learning. J. Exp. Theor. Artif. Intell. 22, 67–80 (3
2010). https://doi.org/10.1080/09528130903010295
19. Fast-Company: How apple made the watch work for wheelchair users
(https://www.fastcompany.com/3061283/how-apple-made-the-watch-work-
for-wheelchair-users) (2016)
20. Fotios, S., Uttley, J.: Illuminance required to detect a pavement obstacle of critical
size. Lighting Research & Technology 50(3), 390–404 (2018)
21. Froehlich, J.E., Brock, A., Caspi, A., Guerreiro, J., Hara, K., Kirkham, R.,
Schöning, J., Tannert, B.: Grand challenges in accessible maps. interactions (2019)
22. Garcia-Mendez, Y., Pearlman, J.L., Boninger, M.L., Cooper, R.A.: Health risks
of vibration exposure to wheelchair users in the community. The journal of spinal
cord medicine 36(4), 365–375 (2013)
23. Gharebaghi, A., Mostafavi, M.A., Chavoshi, S., Edwards, G., Fougeyrollas, P.:
The role of social factors in the accessibility of urban areas for people with motor
disabilities. ISPRS International Journal of Geo-Information 7(4), 131 (2018)
24. Ghilardi, M.C., Macedo, R.C., Manssour, I.H.: A new approach for automatic
detection of tactile paving surfaces in sidewalks. Procedia computer science 80,
662–672 (2016)
25. Guo, A., Kamar, E., Vaughan, J.W., Wallach, H., Morris, M.R.: Toward fairness in
ai for people with disabilities: A research roadmap. arXiv:1907.02227 [cs] (8 2019),
http://arxiv.org/abs/1907.02227, arXiv: 1907.02227
26. Gupta, M., Abdolrahmani, A., Edwards, E., Cortez, M., Tumang, A., Majali, Y.,
Lazaga, M., Tarra, S., Patil, P., Kuber, R., Branham, S.M.: Towards more uni-
versal wayfinding technologies: Navigation preferences across disabilities. pp. 1–
13. CHI ’20: CHI Conference on Human Factors in Computing Systems, ACM,
Honolulu HI USA (4 2020). https://doi.org/10.1145/3313831.3376581, https:
//dl.acm.org/doi/10.1145/3313831.3376581, [Online; accessed 2021-01-27]
27. Haklay, M., Weber, P.: Openstreetmap: User-generated street maps. IEEE Per-
vasive Computing 7(4), 12–18 (10 2008). https://doi.org/10.1109/MPRV.2008.80,
event: IEEE Pervasive Computing
28. Hammerla, N.Y., Kirkham, R., Andras, P., Ploetz, T.: On preserving statistical
characteristics of accelerometry data using their empirical cumulative distribution.
p. 65–68. ACM (2013)
29. Hammerla, N.Y., Plötz, T.: Let’s (not) stick together: pairwise similarity biases
cross-validation in activity recognition. p. 1041–1051. ACM (2015)
30. Hara, K., Azenkot, S., Campbell, M., Bennett, C.L., Le, V., Pannella, S., Moore, R.,
Minckler, K., Ng, R.H., Froehlich, J.E.: Improving public transit accessibility for
blind riders by crowdsourcing bus stop landmark locations with google street view:
An extended analysis. ACM Transactions on Accessible Computing (TACCESS)
6(2), 5 (2015)
31. Hara, K., Chan, C., Froehlich, J.E.: The design of assistive location-based tech-
nologies for people with ambulatory disabilities: A formative study. p. 1757–1768.
ACM (2016)
32. Hara, K., Le, V., Froehlich, J.: Combining crowdsourcing and google street view
to identify street-level accessibility problems. p. 631–640. ACM (2013)
33. Hara, K., Sun, J., Moore, R., Jacobs, D., Froehlich, J.: Tohme: detecting curb
ramps in google street view using crowdsourcing, computer vision, and machine
learning. p. 189–204. ACM (2014)
34. Haresamudram, H., Anderson, D.V., Plötz, T.: On the role of features in human
activity recognition. p. 78–88. ACM (2019)Title Suppressed Due to Excessive Length 21
35. Harpur, P.: Time to be heard: How advocates can use the convention on the rights
of persons with disabilities to drive change. Tech. rep., Rochester, NY (4 2011),
https://papers.ssrn.com/abstract=1804734, [Online; accessed 2021-01-27]
36. He, K., Zhang, X., Ren, S., Sun, J.: Deep residual learning for image recognition.
p. 770–778 (2016)
37. Holloway, C., Tyler, N.: A micro-level approach to measuring the ac-
cessibility of footways for wheelchair users using the capability model.
Transportation Planning and Technology 36(7), 636–649 (10 2013).
https://doi.org/10.1080/03081060.2013.845434
38. Iwasawa, Y., Nagamine, K., Yairi, I.E., Matsuo, Y.: Toward an automatic road
accessibility information collecting and sharing based on human behavior sensing
technologies of wheelchair users. Procedia Computer Science 63, 74–81 (2015)
39. Iwasawa, Y., Yairi, I.E.: Life-logging of wheelchair driving on web maps for visu-
alizing potential accidents and incidents. p. 157–169. Springer (2012)
40. Iwasawa, Y., Yairi, I.E., Matsuo, Y.: Combining human action sensing of wheelchair
users and machine learning for autonomous accessibility data collection. IEICE
Transactions on Information and Systems 99(4), 1153–1161 (2016)
41. Jackson, D., Nicholson, J., Stoeckigt, G., Wrobel, R., Thieme, A., Olivier,
P.: Panopticon: A parallel video overview system. pp. 123–130. Annual
ACM Symposium on User Interface Software and Technology, UIST 2013
(11 2013). https://doi.org/10.1145/2501988.2502038, https://research.monash.
edu/en/publications/panopticon-a-parallel-video-overview-system, [On-
line; accessed 2020-02-01]
42. Kasemsuppakorn, P., Karimi, H.A.: Data requirements and a spatial database for
personalized wheelchair navigation. p. 31–34. Singapore Therapeutic, Assistive &
Rehabilitative Technologies (START) Centre (2008)
43. Kerr, J., Rosenberg, D., Frank, L.: The role of the built environ-
ment in healthy aging: Community design, physical activity, and health
among older adults. Journal of Planning Literature 27(1), 43–60 (2 2012).
https://doi.org/10.1177/0885412211415283
44. Kirby, R.L., Worobey, L.A., Cowan, R., Pedersen, J.P., Heinemann, A.W., Dyson-
Hudson, T.A., Shea, M., Smith, C., Rushton, P.W., Boninger, M.L.: Wheelchair
skills capacity and performance of manual wheelchair users with spinal cord injury.
Archives of Physical Medicine and Rehabilitation 97(10), 1761–1769 (10 2016).
https://doi.org/10.1016/j.apmr.2016.05.015
45. Kirby, R., Swuste, J., Dupuis, D.J., MacLeod, D.A., Monroe, R.:
The wheelchair skills test: A pilot study of a new outcome measure.
Archives of Physical Medicine and Rehabilitation 83(1), 10–18 (1 2002).
https://doi.org/10.1053/apmr.2002.26823
46. Kirkham, R.: Can disability discrimination law expand the availability of wearable
computers? Computer 48(6), 25–33 (2015)
47. Kirkham, R.: Using european human rights jurisprudence for incorporating values
into design. In: Proceedings of the 2020 ACM Designing Interactive Systems Con-
ference, p. 115–128. Association for Computing Machinery, New York, NY, USA
(7 2020), https://doi.org/10.1145/3357236.3395539, [Online; accessed 2021-01-
26]
48. Kirkham, R., Ebassa, R., Montague, K., Morrissey, K., Vlachokyriakos, V., Weise,
S., Olivier, P.: Wheeliemap: An exploratory system for qualitative reports of inac-
cessibility in the built environment. p. 38. ACM (2017)You can also read