Electrophysiological biomarkers of behavioral dimensions from cross-species paradigms
←
→
Page content transcription
If your browser does not render page correctly, please read the page content below
Translational Psychiatry                                                                                                                              www.nature.com/tp

ARTICLE                  OPEN

Electrophysiological biomarkers of behavioral dimensions from
cross-species paradigms
James F. Cavanagh1, David Gregg2, Gregory A. Light 3,4, Sarah L. Olguin2, Richard F. Sharp3, Andrew W. Bismark4, Savita G. Bhakta3,
                                                                      ✉
Neal R. Swerdlow 3, Jonathan L. Brigman 2 and Jared W. Young 3,4

© The Author(s) 2021

    There has been a fundamental failure to translate preclinically supported research into clinically efficacious treatments for
    psychiatric disorders. One of the greatest impediments toward improving this species gap has been the difficulty of identifying
    translatable neurophysiological signals that are related to specific behavioral constructs. Here, we present evidence from three
    paradigms that were completed by humans and mice using analogous procedures, with each task eliciting candidate a priori
    defined electrophysiological signals underlying effortful motivation, reinforcement learning, and cognitive control. The effortful
    motivation was assessed using a progressive ratio breakpoint task, yielding a similar decrease in alpha-band activity over time in
    both species. Reinforcement learning was assessed via feedback in a probabilistic learning task with delta power significantly
    modulated by reward surprise in both species. Additionally, cognitive control was assessed in the five-choice continuous performance task,
    yielding response-locked theta power seen across species, and modulated by difficulty in humans. Together, these successes, and also the
    teachings from these failures, provide a roadmap towards the use of electrophysiology as a method for translating findings from the
    preclinical assays to the clinical settings.

    Translational Psychiatry (2021)11:482 ; https://doi.org/10.1038/s41398-021-01562-w

INTRODUCTION                                                                                 Candidate domains that are deficient in psychiatric disorders
Many clinical treatment trials in psychiatry have failed at the cost of                   include effortful motivation, reinforcement learning, and cognitive
time, effort, money, and the hope of the patients tested. These                           control. Effortful motivation is recognized as a core contributor to
translational failures are often attributed to either a lack of consistent                psychosocial impairments in psychiatric conditions, ranging from
quantification of the same neural processes across species [1, 2] or                       amotivation in people with schizophrenia and depression to
to the use of “fast and dirty” behavioral techniques that have little-                    increased goal-directed activity in mania. There are various
to-no relevance to human testing [3]. In response, the National                           methods for assessing effort-based decision making, each with
Institutes of Mental Health (NIMH) formed the Cognitive Neu-                              associated deficits observed across psychiatric conditions [6–9].
roscience Treatment Research to Improve Cognition in Schizophre-                          Motivational deficits can also be measured across species,
nia (CNTRICS) to identify cognitive systems and component                                 although techniques vary widely [10–12]. One method for
processes that could be tested across species [1]. Continuing this                        measuring effortful motivation is the progressive ratio breakpoint
theme, NIMH also initiated the Research Domain Criteria (RDoC)                            task, linked to a single, well-defined action requirement. Motiva-
initiative [4, 5], promoting a focus on specific behavioral dimensions                     tion is measured by the point that the participant stops
and related neurophysiological circuits instead of end phenotypes. A                      responding to gain a reward, is reduced in people with
common theme across these new paradigms is the need for brain-                            schizophrenia [13, 14], and accounts for 24% of the variance in
based neural signals that are specifically linked to behavioral                            their global cognitive functioning [15]. A reduced breakpoint is
dimensions, that must be sensitive to systemic alterations due to                         also observed in animal models relevant to schizophrenia [16],
mental health disorders, and that should ideally be translatable                          while an increased breakpoint is observed in animal models of
between the species. Ultimately, the availability of specific, sensitive,                  mania [17]. Thus, effortful motivation can be measured in a
and translatable neural signals would increase the likelihood of                          manner consistent across species.
positive animal trial results being translated to positive clinical trial                    Another promising experimental domain is reinforcement
results. Motivated by a specific UH2/3 funding mechanism from the                          learning, which requires an agent to learn stimulus-action pairings
NIMH, we aimed to test three candidate behavioral assays and                              based on rewarding or punishing outcomes. These outcomes are
assess the homology of concurrent neurophysiologic responses                              often delivered probabilistically, requiring long-term integration of
across species (UH2 phase), with future studies confirming                                 action values [18, 19]. Probabilistic reinforcement learning
pharmacologic sensitivity across species (UH3 phase).                                     paradigms are naturally transferrable across vertebrates [20–23],

1
 Psychology Department, University of New Mexico, Albuquerque, NM, USA. 2Department of Neurosciences, University of New Mexico School of Medicine, Albuquerque, NM
87131, USA. 3Department of Psychiatry, University of California San Diego, 9500 Gilman Drive MC 0804, La Jolla, CA 92093-0804, USA. 4VISN-22 Mental Illness Research Education
and Clinical Center, VA San Diego Healthcare System, San Diego, CA, USA. ✉email: jaredyoung@ucsd.edu

Received: 19 January 2021 Revised: 20 July 2021 Accepted: 11 August 2021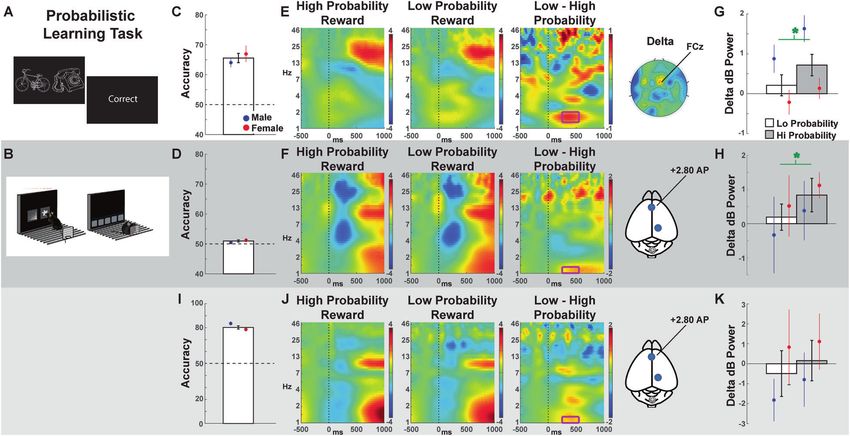
J.F. Cavanagh et al.
                  2
1234567890();,:

                      Fig. 1 Schematic electroencephalograph (EEG) recording in humans and mice. The present studies utilized EEG recordings in humans and
                      mice while they performed tasks that probed RDoC-relevant domains of functioning, including effortful motivation, reward learning, and
                      cognitive control. Humans used a joystick to respond to on-screen stimuli, while mice responded using a touchscreen. Scalp (human) and
                      dura (mice) EEG recordings were recorded during the execution of these tasks. Time-frequency regions-of-interest were contrasted between
                      task conditions to compare neural signatures of these RDoC domains.

                      and are thus an ideal candidate for domain consistency.                  shared neural substrates of task engagement are necessary to
                      Probabilistic learning deficits are observed in people with               increase confidence in any treatment translated across species.
                      psychiatric conditions, such as schizophrenia [24, 25], bipolar          While there are numerous studies advancing candidate biomar-
                      disorder [26], and depression [27–29], bolstering the translational      kers of specific domains, many techniques are inherently ill-
                      utility of findings. Reinforcement learning theory provides a             suited for translating behavioral or neurophysiology between
                      quantification of abstract processes [30], facilitating an interpreta-    species. Fixed-head techniques like fMRI in humans or calcium
                      tion of neural signals by their confirmation to theorized                 imaging in animals have limited translatability. Invasive record-
                      parameters and computations.                                             ings like depth electrophysiology are compelling but such
                         Finally, cognitive control is a domain that is reliably associated    studies are rare in humans. Electrophysiological recordings
                      with psychiatric distress. Cognitive control requires goal-driven        naturally encompass multiple scales of measurement in a
                      action selection over prepotent tendencies [31, 32], and it can be       hierarchical, integrated manner. For example, local fields couple
                      elicited using several paradigms including various continuous            to scalp‐recorded EEG: regardless of scale (depth, dura, scalp,
                      performance tests (CPTs). Prior to the development of the five-           etc.), field activity is always measured [38]. Thus, electrophysiol-
                      choice (5 C)-CPT [33], cognitive control and attention were not          ogy is uniquely well-suited for addressing questions about
                      typically measurable in the same task in rodents. The 5C-CPT has         translatable neural signal biomarkers.
                      since been reverse-translated for use in humans and used to                 Even with the methodologic promise of comparative electro-
                      provide evidence that cognitive control is deficient in schizo-           physiology, a major impediment toward improving this species
                      phrenia [34] and bipolar disorder [35]. Cross-species pharmacolo-        gap has been the difficulty of developing paradigms that 1) can
                      gical predictive validity has been demonstrated by the effects of        quantify EEG responses related to specific behaviors, 2) are
                      amphetamine, which improves 5C-CPT performance in humans,                impacted by mental health disorders, and 3) are suitable for both
                      rats, and mice [35, 36]. Importantly, for cognitive control, a           human and animal studies. Fortunately, the advent of touchscreen
                      measure of response inhibition (false alarm rate) is functionally        technology for rodents has greatly increased the sophistication of
                      separable from the more traditional impulsivity measure of               behavioral testing. Here, we detail RDoC-relevant behavioral
                      premature responses, as evidenced by dopamine D4 receptor                domains impacted by mental health (effortful motivation,
                      and 5-HT2C mechanism sensitivity, respectively [37].                     reinforcement learning, and cognitive control) that can be
                         Across these three task domains of effortful motivation,              quantified in similar tasks across humans and mice and that are
                      reinforcement learning, and cognitive control it is possible to          associated with an a priori defined candidate spectral EEG
                      assess behaviors with preserved consistency across species with          biomarker (Fig. 1). Only some of these behavioral and neural
                      outcomes that are sensitive to deficits in clinical populations.          signatures were successfully translated here—yet even failures
                      However, behavioral consistency has proven insufficient, and              yielded critical lessons for advancing this field.

                                                                                                                   Translational Psychiatry (2021)11:482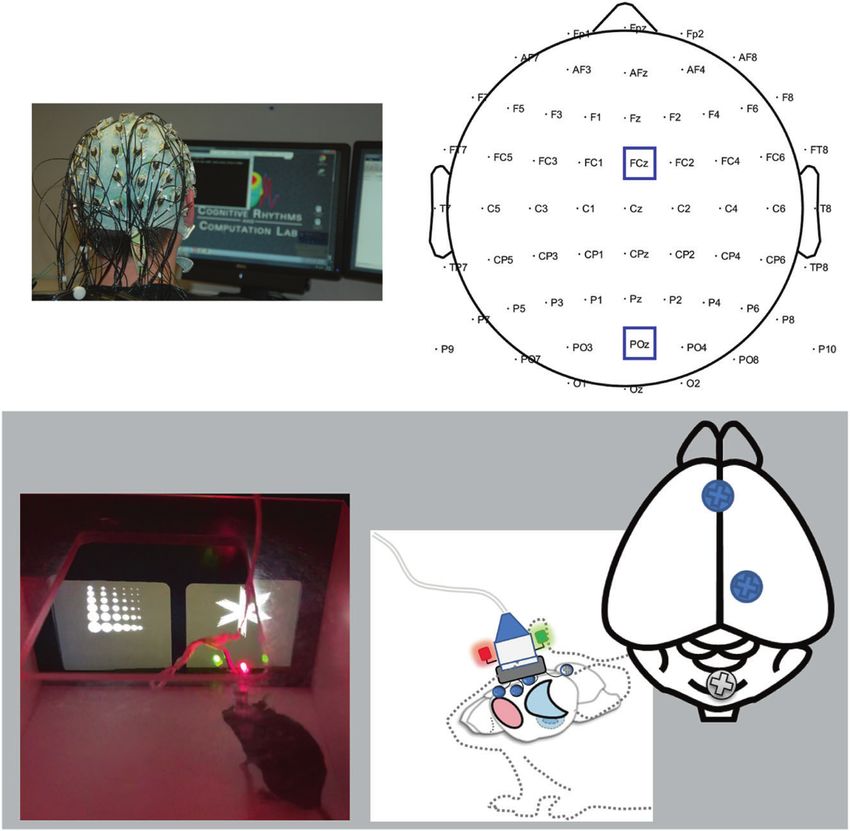
J.F. Cavanagh et al.
                                                                                                                                                                     3

Fig. 2 The progressive ratio breakpoint task (PRBT) required the subject to continuously engage in behavior with a diminishing
probability of reward. A In humans, participants had to rotate a joystick an increasing number of times (e.g. 5, 15, 35…) to accumulate
rewards. B Mice touched the screen an increasing number of times for the magazine to dispense liquid reward. C–D Breakpoints for each
species including means split by sex. E–F Time-frequency plots of the earliest vs. the last trials at POz in humans or the posterior lead in mice.
For the sake of effective visual comparison, the time dimension is −500 to 1000 locked to markers placed every second (for humans) or every
trial (for mice). The magenta box shows the alpha-band tf-ROI. Since the baseline for both species was spread across all trials, all power values
are relative (thus “negative” in early trials). G–H EEG tf-ROI quantification of the early vs. last difference in posterior alpha. Bars indicate the
group means (± SEM), green asterisks indicate statistically significant (p < 0.05) within-subject differences.

METHODS AND MATERIALS                                                           performance was calculated as the total number of correct target
Human participants                                                              selections aggregated across the three blocks of 80 trials.
The human portion of this study was conducted at the UCSD Medical
Center, with approval from the UCSD Human Subject Institutional Review          Five-choice continuous performance task (5C-CPT)
Board. Healthy men and women (18–35 years; n = 57) were recruited from          Participants were instructed to move the joystick in the direction that a
the community and monetarily compensated for participation. First,
                                                                                circle appeared (target stimuli) but inhibit from responding if five circles
subjects underwent phone screening to assess current and past medical
                                                                                simultaneously appeared (nontarget stimuli) (Fig. 4A). This new 5C-CPT
and psychiatric history, medication and recreational drug use, and family       variant had two different difficulty conditions. In easy conditions, stimuli
history of psychosis. Following informed consent, participants completed        were presented for 100 ms. In hard conditions, stimuli were presented for
an in-depth screening visit, including a physical examination, urine            10 ms but then a solid white mask was presented over the stimulus array
toxicology screen, and urine pregnancy test. All exclusion criteria and         for 90 ms. All target and nontarget stimuli were presented in a
data for cohort characterization are presented in the Supplemental
                                                                                pseudorandom order (to ensure no more than three of the same trial
Materials. EEG equipment problems with two participants resulted in
                                                                                types in a row), with a 1 sec response window available for all trials and a
n = 55 participants with available behavioral and EEG recordings across         variable intertrial interval (ITI; 500, 1000, or 1500 ms). The full task consisted
the three tasks.                                                                of 216 trials: 90 target and 18 nontarget stimuli for each of the difficult
                                                                                conditions. Composite metrics of task performance were used in the
Progressive ratio breakpoint task (PRBT)                                        analysis of performance, including hit rate, false alarm rate (FAR), d prime,
This version of the PRBT has been detailed elsewhere [15] (Fig. 2A).            and bias.
Participants were required to rotate the same arcade joystick handle in the
indicated direction to be “rewarded” (50 points/level), with the number of
                                                                                Human electrophysiological recording and preprocessing
rotations needed set to a progressive ratio schedule (5, 15, 35, 70, 120,
                                                                                Continuous electrophysiological (EEG) data were recorded using a BioSemi
etc.). Participants were asked to earn as many points as possible but were      Active Two system. Data were recorded in DC mode from 64 scalp leads,
told that they could quit any time, ending the entire testing session. A        four electrooculogram (EOG) leads recorded at the superior and inferior
white dot was used as feedback to indicate four successful rotations. The       orbit of the left eye and outer canthi of each eye, and one nose and two
collected “points” held neither value nor were subjects verbally                mastoid electrodes for offline re-referencing. The electrode offsets were
encouraged during task performance. After a short practice session to
                                                                                kept below 25 mV and all channels were referenced to the system’s
acclimate to the joystick rotations and task feedback, the test session was
                                                                                internal loop (CMS/DRL electrodes). All data were collected using a 512 Hz
initiated. After rotating the joystick a sufficient number of times to attain    sampling rate utilizing a first-order antialiasing filter. Custom Matlab scripts
each reward level, a screen appeared indicating they had earned 50 points       and EEGLab [39] functions were used for all data processing. Data were
and the required direction of rotations alternated (i.e., clockwise to          first epoched around the imperative stimuli and then average referenced.
counter-clockwise) to minimize perseverative motor effects. The task            Bad channels and bad epochs were identified using a conjunction of the
ended when patients either completed all possible reward levels, verbally       FASTER algorithm [40] and pop_rejchan from EEGLab and were subse-
indicated they no longer wanted to continue the task, or failed to make a
                                                                                quently interpolated and rejected, respectively. Eye blinks were removed
response for five consecutive minutes. The breakpoint was quantified as
                                                                                following independent component analysis in EEGLab.
the largest number of levels completed before the end of the task.

                                                                                Animal subjects
Probabilistic learning task (PLT)                                               Male and female C57BL/6 J mice were obtained from The Jackson
This version of the PLT has also been detailed elsewhere [15] (Fig. 3A).        Laboratory (Bar Harbor, ME), housed in same-sex groupings of two per
Participants were presented a stimulus pair (e.g., bicycle/phone, chair/clip,   cage in a temperature- and humidity-controlled vivarium under a reverse
plug/flashlight) on a computer monitor and instructed to select the
                                                                                12 h light/dark cycle (lights off:0800 h) and tested during the dark phase. A
“target” stimulus using a digital four-switch USB arcade-style joystick.
                                                                                total of 12 male and 12 female mice were used. All experimental
Participants were given feedback after each trial about whether their           procedures were performed in accordance with the National Institutes of
response was “correct” or “incorrect.” Reward probabilities for the target/     Health Guide for Care and Use of Laboratory Animals and were approved
nontarget stimulus were set within a block of 80 trials (80/20, 70/30, and      by the University of New Mexico Health Sciences Center Institutional
60/40), but stimuli differed between trial blocks (first block was bicycle/      Animal Care and Use Committee. See Supplemental Materials for
phone at 80/20, then the next block was chair/clip at 60/40, etc.). Overall
                                                                                information on touchscreen pretraining. All rewarding outcomes included

Translational Psychiatry (2021)11:482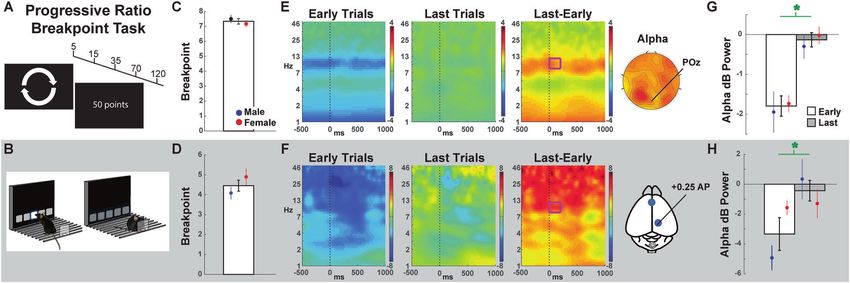
J.F. Cavanagh et al.
4

    Fig. 3 The probabilistic learning task (PLT) required the subject to select the stimulus that probabilistically led to reward most often.
    A–B In humans and mice, each trial required a choice between two stimulus icons. C–D Total accuracies for each species, including means split
    by sex. E–F Time-frequency plots of high vs. low probability rewards at FCz in humans or the anterior lead in mice. The magenta box shows
    the delta-band tf-ROI. G–H EEG tf-ROI quantification of the difference in reward expectation conditions in frontal delta power. I–K Replication
    with a second cohort of mice on a simpler discrimination task. Bars are means (± SEM), green asterisks indicate statistically significant (p < 0.05)
    within-subject differences.

    the delivery of an auditory tone signaling the subsequent availability of         transformed (FFT) power spectrum of single-trial EEG data with the FFT
    strawberry milkshake.                                                             power spectrum of a set of complex Morlet wavelets defined as a
                                                                                      Gaussian-windowed complex sine wave: ei2πtfe-t^2/(2xσ^2), where t is time, f
                                                                                      is frequency (which increased from 1–50 Hz in 50 logarithmically spaced
    Mouse progressive ratio breakpoint task (PRBT)                                    steps), and the width (or “cycles”) of each frequency band was set to
    During the PRBT, mice were presented with a single illuminated square in          increase from 3/(2πf) to 10/(2πf) as frequency increased. Then, the time
    the center of the touchscreen, which produced a strawberry milkshake              series was recovered by computing the inverse FFT. The end result of this
    reward (40 µL) when pressed. The stimulus remained on the screen until            process is identical to time-domain signal convolution, and resulted in
    the required response number was made. Each session lasted 60 min. The
                                                                                      estimates of instantaneous power taken from the magnitude of the
    number of touches required for a reward increased by a step every three           analytic signal. Each epoch was then cut in length (cues: −500 to
    trials (e.g.: 1,1,1,2,2,2,4,4,4,7,7,7, etc.). The breakpoint was the last ratio   +1000 ms; responses: -1000 to +500 ms).
    completed at the end of the 1-h session. Mice completed one session                  Averaged power was normalized by conversion to a decibel (dB) scale
    of PRBT.                                                                          (10*log10[power(t)/power(baseline)]), allowing a direct comparison of
                                                                                      effects across frequency bands. The baseline consisted of averaged power
    Mouse probabilistic learning task (PLT)                                           -300 to -200 ms before all task-specific stimuli, except the response-locked
    Throughout each session of the PLT, mice were presented with three pairs          mouse 5C-CPT trials, which benefitted from greater trial-specific clarity by
    of unique stimuli (fan/marble, honey/cave, spider/fan) in three separate 20-      using a preresponse −800 to −700 ms window. A 100 ms duration is often
    trial blocks. For the first block, one stimulus was rewarded 90% of the time       used as an effective baseline, since pixel-wise time-frequency data points
    and the other was rewarded 10% of the time. The next blocks included 80/          have already been resolved over smoothed temporal and frequency
    20 and then 70/30 reinforcement rates. The mice were given two hours to           dimensions with the wavelets. For the PRBT, the entire duration of all
    complete the task. Mice were tested for 1–10 consecutive sessions.                epochs was used as the baseline.

    Mouse five-choice continuous performance task (5C-CPT)                             Statistical analysis
    Mice were trained in the 5C-CPT as previously described [36] (see                 Species were analyzed with separate mixed-effects models. For mice,
    Supplemental Materials and Supplemental Figure S1). Target trials were            individual sessions were concatenated and each mouse was treated as a
    indicated by illumination of a single stimulus window; nontarget trials           random effect, similar to humans. The contrast conditions within each task
    consisted of illumination of all five windows. Hits and correct rejections         were treated as fixed effects. For mouse data, only trials with at least 30
    were rewarded. False alarms resulted in a 10 s timeout period. Mice were          epochs were used in the 5C-CPT or PLT (PRBT always used five trials at the
    first trained on a 2:1 ratio (2 target trials to 1 nontarget) for five sessions.    beginning and five trials at the end). In the human dataset, there were
    They were then tethered to the recording apparatus for two sessions of 2:1        clear a priori hypotheses and there was more level-2 data (more subjects),
    to acclimate to the head stage, and then moved to a 5:1 ratio. Similar to         so a smaller threshold was used for level-1 rejection (trials). For the 5C-CPT,
    the human 5C-CPT, two different difficulty conditions were included, with          this minimum was ten trials and for the PLT, the minimum was 20 trials. For
    easy (3 s response window) and hard (1.5 s response window) trials across         the PRBT, 1-s epochs were averaged for the first 50 s and the last 50 s of
    ten recording sessions.                                                           the task.
                                                                                         Analysis of Variance (ANOVAs) and t tests were used to test hypotheses
                                                                                      about condition-specific differences within each task, separately for each
    Human and mouse EEG processing                                                    species. All tests were two-tailed. We also determined whether sex
    For the sake of descriptive simplicity, both the scalp-recorded signal in         moderated these effects, although there were no specific hypotheses
    humans and the dura-recorded signal in mice are referred to as “EEG.”             about the role of sex. Test statistics are shown in Tables 1 & 2. Simple
    Time-frequency measures were computed by multiplying the fast Fourier             effects contrasts are shown in Table 3 along with the time and frequency

                                                                                                             Translational Psychiatry (2021)11:482
J.F. Cavanagh et al.
5
Fig. 4 The five-choice continuous performance task (5C-CPT) had two levels of dbifficulty. A–B In humans, difficulty was manipulated with
easy (unmasked) vs. hard (masked) visual contrast conditions. Difficulty altered d prime but not bias. C–D In mice, difficulty was modulated
with easy (3 s delay) vs. hard (1.5 s delay) conditions. Task demand did not change d prime or bias in mice. E–F Time-frequency plots of
response-locked data at FCz in humans or the anterior lead in mice. Since a correct nontarget (nogo) condition does not require a response,
these epochs were time-locked to the end of the delay period. The magenta boxes show the theta-band tf-ROI. G–H) EEG tf-ROI quantification
of the go easy vs. go hard difference in preresponse theta power. Green asterisks indicate statistically significant (p < 0.05) within-subject
differences.
ranges for each tf-ROI. All effect sizes are presented as partial eta-squared the screen. In both cases, the number of actions required for the
(pη2) or Cohen’s d (mean difference divided by the pooled standard next reward progressively increased. The point at which the
deviation). subject stopped responding was identified as their breakpoint and
was used as an index of effortful motivation. Previous EEG studies
have implicated alpha power as a concomitant of effortful
RESULTS behavior in humans [41–43], including changes due to physical
Statistical differentiation followed an a priori approach, where and mental fatigue [44, 45]. Here, we examined if this relationship
each task had a predicted spatial, temporal, and frequency range was present during the PRBT and if it was common between
for the contrast of interest. These time-frequency regions-of- species. The alpha-band was defined as 8–12 Hz, and electrode
Interest (tf-ROIs) were broadly defined based on well-replicated POz was selected to be within the mass of broad posterior alpha.
findings from the human EEG literature (detailed for each task Epochs were locked to the first 50 and last 50 s at electrode POz in
below). In the discussion, we note how the exact tf-ROIs humans, and to the first five and last five rewarded responses in
discovered here will be used in future pharmacologic studies, the posterior lead in rodents. Since this alpha-band effect was
providing a chance for direct replication and theoretical extension expected to be relatively consistent across events, the time
of the candidate biomarkers. Each figure shows the tf-ROI in window was arbitrarily set from 0–200 ms postevent. It was
magenta, as well as topographic plots highlighting the target hypothesized that alpha power at this posterior lead would be
electrode. larger at the end of the task, as indicated for physical vs. cognitive
effort [46].
Predictions: PRBT
This task required subjects to engage in active behavior to gain a Outcomes: PRBT
reward at each level. In humans, levels increased after rotating the In humans, the breakpoint was around 7 (Fig. 2C). In mice, the
joystick, while in mice, levels increased after sufficient touches to breakpoint was around 4 (Fig. 2D). There were no sex differences
Translational Psychiatry (2021)11:482J.F. Cavanagh et al.
6
Table 2. Test statistics for 2 (sex) * 2 (condition) ANOVAs for
behavioral performance on the PLT and 5 CCPT.
= 0.92, pη2 = 0.00
F = 0.89, p = 0.34,
F = 0.05, p = 0.83,
F = 0.01, p = 0.91,
PLT df Main: Main: sex Prob* sex
probability
F = 0.01, p
pη = 0.05
Prob* sex
= 0.01
= 0.00
Human: accuracy 1.51 F = 54.40, F = 0.87, F = 0.60,
3-way
p < 0.001, p = 0.36, p = 0.44,
2
2
2
pη = 0.52 pη = 0.02 pη = 0.01
2 2 2
pη
pη
Mouse: a 1.18 F = 0.02, F = 2.24, F = 0.34,
ccuracy p = 0.90, p = 0.15, p = 0.55,
pη = 0.00 pη = 0.11 pη = 0.02
2 2 2
F = 9.25, p < 0.01,
F = 0.74, p = 0.41,
F = 0.15, p = 0.71,
F =0.23, p = 0.64, 5C-CPT df Main: Main: Diff* sex
difficulty sex
pη = 0.37
= 0.06
pη = 0.00
= 0.03
Main: sex
Human: hit rate 1.53 F = 23.07 F = 1.41 F = 0.28
Diff* sex
p < 0.001 p = 0.24 p = 0.60
pη = 0.31 pη = 0.03 pη = 0.00
2 2 2
2
2
2
2
pη
pη
Mouse:h 1.13 F = 0.58 F = 0.02 F = 3.08
it rate p = 0.46 p = 0.89 p = 0.10
pη = 0.04 pη = 0.00 pη = 0.17
2 2 2
Human: FA 1.53 F = 2.01 F = 0.97 F = 0.46
F = 7.01, p = 0.02,
F = 6.67, p = 0.02,
Main: probability
F = 0.73, p = 0.38,
F = 0.50, p =0.50,
p = 0.16 p = 0.33 p = 0.50
pη = 0.04 pη = 0.02 pη = 0.01
2 2 2
F = 4.33 F = 2.32 F = 0.11
pη = 0.29
= 0.39
Mouse: 1.13
pη = 0.01
= 0.05
Resp* sex
FA p = 0.06 p = 0.15 p = 0.75
pη = 0.24 pη = 0.14 pη = 0.01\
2 2 2
2
2
2
2
pη
pη
Human: d prime 1.53 F = 28.78 F = 3.27 F = 0.52
p < 0.001 p = 0.08 p = 0.47
pη = 0.36 pη = 0.06 pη = 0.01
2 2 2
1.16
1.11
0.51, pη2 = 0.05
Test statistics for two (sex) * two (condition) ANOVAs for EEG time-frequency regions-of-interest (tf-ROIs).
df
F = 9.22, p =
F = 0.47, p =
0.004, pη2 =
Mouse: 1.13 F = 0.91 F = 0.53 F = 0.13
Resp* diff
d prime p = 0.34 p = 0.48 p = 0.72
Human
pη = 0.07 pη = 0.04 pη = 0.01
Mouse
2 2 2
0.15
PLT
Human: bias 1.53 F = 1.33 F = 1.72 F = 0.0
p = 0.25 p = 0.20 p = 0.99
pη = 0.03 pη = 0.03 pη = 0.00
2 2 2
Mouse:b 1.13 F = 3.48 F = 3.52 F = 1.98
ias p = 0.09 p = 0.08 p = 0.18
F = 0.02, p = 0.90,
F = 4.16, p = 0.06,
F = 0.63, p = 0.43,
F = 0.73, p = 0.42,
pη = 0.21 pη = 0.21 pη = 0.13
2 2 2
Human: hit RT 1.53 F = 146.59 F = 1.76, F = 2.80, p
Time* sex
p = 0.19, = 0.10, pη2
pη = 0.00
= 0.19
pη = 0.01
= 0.08
Main: sex
p < 0.001
pη = 0.73 pη = 0.03 = 0.05
2 2
Mouse: 1.13 F = 9.29 F = 1.18, F = 1.45, p
2
2
2
2
pη
pη
hit RT p = 0.008 p = 0.30, = 0.25, pη2
pη 0.38 pη = 0.07 = 0.09
2 2
Bold values represent p values and effect sizes.
F = 6.39, p = 0.02,
F = 0.45, p = 0.50,
F = 1.13, p = 0.30,
F = 0.21, p = 0.66,
Main: difficulty
in either the number of trials completed or the breakpoint (human
pη = 0.11
t’s < 1, mouse t’s < 1.52). Following minimum epoch count
pη = 0.00
= 0.06
= 0.02
Main: sex
requirements, and due to two technical problems in human
EEG, there were n = 52 humans (M = 24, F = 28) and n = 20 mice
2
2
2
2
pη
pη
(M = 11, F = 9). Both the humans and mice had a significant late
> early alpha power contrast (Table 1). There were no main or
Bold values represent p values and effect size..
interactive effects with sex for either species.
Unlike the other experiments in this report, and to the best of
F = 82.41, p < 0.001,
F = 19.03, p < 0.001,
F = 36.40, p < 0.001,
F = 4.44, p = 0.049,
our knowledge, the hypothesis of an alpha-band marker of
breakpoint-related effort had not been tested. This alpha
Main: response
difference (last minus first) was proposed to scale with greater
Main: time
pη = 0.42
pη = 0.20
pη = 0.62
pη = 0.68
motivation loss, and it was indeed negatively correlated with the
breakpoint in humans (ρ (52) = −0.28, p = 0.046; Supplemental
Figure S2). Notably, time-on-task, as measured by the number of
2
2
2
2
seconds on the PRBT did not correlate with breakpoint (rho(52) =
−0.15, p = 0.30). This outcome highlights the fact that participants
1.50
1.18
1.51
achieved a higher breakpoint through effort, which correlated
1.9
df
df
with alpha-band difference, not time. A stepwise regression
verified this specific relationship, where seconds did not correlate
5C-CPT
Table 1.
Human
Human
Mouse
Mouse
with the alpha difference (F < 1), yet the addition of the breakpoint
PRBT
in the next level led to a significant F change (F(2,49) = 4.03, p =
Translational Psychiatry (2021)11:482J.F. Cavanagh et al.
7
Table 3. Summary of simple effects.
Low freq High freq Start time End time t df p d Match?
PRBT alpha Human 8 12 0 200 6.14 51 high reward probability. For the 5C-CPT, the simple effect is the go hard > go easy condition.
0.02, R2 change = 0.10). The analysis of mouse performance this delta-band contrast, a separate cohort (N = 12: M = 6, F = 6)
required some different operational definitions and statistical was tested over g days on a single pair of stimuli that had 100 vs.
approaches, since they always had one hour to complete the task 50% probabilities of reward. All mice performed at around 80%
and most mice stopped at a breakpoint of “four” while a few accuracy (i.e., they selected the 100% rewarding option 80% of the
stopped at “seven.” In mice, there was no relationship between time: t(11) = 20.90, p < 0.001, d = 6.03), suggesting a high level of
alpha power and the number of epochs completed (rho(22) = intrinsic exploration (Fig. 3I). Critically, time-frequency contrasts
−0.09, p = 0.70), although this may be due to a reduced sample revealed a surprise-evoked delta-band burst in the same tf-ROI
size. When analyzed as two groups, the mice with a breakpoint of (Fig. 3J-K). Although this cohort did not reveal a significant
“four” had a nonsignificantly higher alpha power than those with a statistical differentiation between conditions (t(11) = 0.89, p =
breakpoint of “seven” (t(18) = 1.21, p = 0.24), supporting the 0.39, d = 0.18), this may still be expected from a true effect. The
premise that a higher sample size may have yielded the same p-value alone is a poor metric for assessing replicability; effect
correlation seen in humans. sizes and confidence intervals are more useful for assessing the
utility of an experimental outcome [52, 53]. Here, we observed
Predictions: PLT that the mean difference between conditions were in fact the
Trials that resulted in correct feedbacks were used for all analyses. In exact same number (first cohort: mean difference = 0.65 dB, CI =
mice, rewarded responses were immediately indicated by a 1 s, pure 0.14, 1.15; second cohort mean difference = 0.65 dB, CI = −0.97,
noise tone concomitant with the illumination of the magazine light 2.27). Although not included in the a priori hypotheses, analyses
and delivery of the reward. Comparisons were split based on the for EEG time-frequency region of interests for punishment-related
probabilistic aspect of the reward feedback, creating high prob- theta with statistical analyses (Supplemental Tables S1 & S2), with
ability (i.e., target response followed by reward) vs. low probability corresponding theta power representation (Supplemental
(i.e., nontarget response followed by reward) contrasts. While this Figure S3), are described, in addition to correlations to mouse
contrast is ideal for comparing the same process without accuracy related to reward- and punishment-associated delta
interference from different sensory or imperative events, it power differences (Supplemental Figure S4).
unfortunately conflicted with our strong epoch count requirements
(see Methods and Materials). These criteria led to the necessity of Predictions: 5C-CPT
limiting these analyses to only the humans and mice who Only hits on target trials and correct rejections on nontarget trials
experienced the minimum amount of both trial types. Epochs were were used for EEG analysis. This novel 5C-CPT also introduced two
locked to rewarding feedbacks at electrode FCz in humans—where varying difficulty levels using backward masks. In humans, these
the reward positivity ERP component is maximal [47–49]—and at were easy (standard, unmasked) and hard (masked) visual contrast
the frontal lead in rodents. We hypothesized that low vs. high conditions. In rodents, we utilized supposedly easy (3 s delay) and
probability rewards would elicit a frontal midline delta-band power hard (1.5 s delay) conditions. In mice, rewards were immediately
burst [47, 50]. While this reward-locked delta burst is reliably indicated by a 1 s, pure noise tone concomitant with the
observed in humans, the timing and frequency varies between the illumination of the magazine light and delivery of reward. These
published studies [47, 49–51]. Here, the temporal window was rewards were locked to the response on hits and the end of the
defined from 250 to 550 ms post-feedback; however, the frequency delay period on correct rejections. The nontarget vs. target
window was 1.3–2 Hz for humans and 1–1.4 Hz for mice. contrasts were expected to elicit frontal midline theta power,
which is a reliable indicator of cognitive conflict [54, 55]. However,
Outcomes: PLT it was not possible to verify that cues were visually attended to by
For humans, overall PLT accuracy was greater than chance, with no the mice, so response-locked epochs were used for both species.
difference between the sexes (Table 2). For mice, overall accuracy Epochs were locked to responses at electrode FCz in humans and
did not differ from chance. However, many mice were excluded the frontal lead in rodents. Since there were no responses for
from subsequent analysis due to a low number of epochs; the correct rejections, nontarget trials were time-locked to the end of
accuracy of the cohort used in EEG analysis was significantly higher the temporal epoch. The theta-band was defined as 4–8 Hz. Since
than chance (t(13) = 2.26, p = 0.04, d = 0.60), with no difference conflict-specific theta power peaks at FCz before response
between sexes (t < 1). Following these minimum epoch require- execution [56, 57], the temporal window was defined as −500
ments for high and low probability events, the sample sizes of EEG to 0 ms preresponse. This frontal theta effect was hypothesized to
analyses were reduced (human: M = 7, F = 11; mouse: M = 5, F = 8). be parametrically enhanced in the hard vs. easy contrast.
Both the humans and mice had a significant low > high probability
delta-band contrast, with a significant main effect of sex in humans Outcomes: 5C-CPT
(males > female), (Table 1). In humans, the difficulty manipulation (masking), caused a
While this carefully contrasted delta-band effect in mice is significantly lower hit rate, longer RTs, and lower d prime,
compelling, it was disappointing that the mice performed so indicative of worse attention but no change to false alarms
indiscriminately during EEG assessment. To test the reliability of (response inhibition) or, importantly, bias of responding. There
Translational Psychiatry (2021)11:482J.F. Cavanagh et al.
8
were no main or interactive effects with sex, (Table 2). In mice, the able to be well-controlled within each species, facilitating a
difficulty manipulation (stimulus duration), induced faster RTs but comparison of the underlying process (e.g., low vs. high
no changes to performance measures. There were no main or probability corresponding to high vs. low reinforcement predic-
interactive effects with sex (Table 2). Following minimum epoch tion error), without interference from different sensory or
count requirements, there were n = 55 humans (M = 26, F = 29) imperative stimuli. The prediction of a delta-band enhancement
and n = 11 mice (M = 8, F = 3). In humans, there were significant to reward surprise was borne out in both species. An additional
main effects of preresponse theta power to response (target > study with easier discriminability replicated the observation of the
nontarget) and difficulty (hard > easy), and an interaction (hard delta-band effect with consistent confidence intervals, albeit not
target > easy target > nontarget) (Table 1). For mice, there was the statistical differentiation. This spectral representation of the
only a significant main effect of response (target > nontarget). All reward positivity ERP component has been described in humans,
other F tests < 1 (Table 1). Since the response data were locked to particularly its sensitivity to formal estimates of reward prediction
different events (there were no responses on nontarget trials), this error [50]. These findings are the first demonstration of this same
response contrast was not an effective assessment of cognitive spectral response in dura-recording from rodents, although a
control, more likely reflecting attentive functioning. The contrast similar slow cingulate-recorded ERP response in this same time
between difficulty conditions is better-suited as an assessment of range was observed in the difference between the reward and
control since the imperative events were identical. Preresponse punishment trials in rats [61]. Mice are a prey species and are more
theta was only modulated by difficulty in humans (hard target > sensitive to punishment [62, 63] than rats in similar paradigms
easy target), while there was no effect in mice (Table 3). There [64]. Although not specified by our a priori predictions, we also
were no main or interactive effects with sex for either species investigated punishment surprise-evoked theta power (Supple-
(Tables 2 and 3). mental Figure S4). However, this response was not significantly
modulated in mice.
DISCUSSION Cognitive control: 5C-CPT
Here, we report that consistent behaviors and related neural The 5C-CPT assesses cognitive control and is sensitive to deficits in
signatures can be elicited across various tasks and domains in clinical populations and modulations by pharmacologic agents.
humans and mice. These candidate EEG responses displayed Although humans easily maintain focus on the screen between
remarkable temporal, spatial, and frequency consistency between stimuli (enabling EEG assessment locked to stimulus presentation),
species, largely consistent with our a prior hypotheses. Specifically, such assessment is much more difficult in mice given their need to
the PRBT (effortful motivation) and PLT (reward learning) revealed turn around toward the food delivery area, thereby increasing
consistent neural signatures of posterior alpha and reward delta misses to the moment of stimulus presentation, limiting stimulus-
respectively, seen in both humans and mice while performing locked EEG events. Without aggressive implementation changes,
these tasks. Additionally, the 5C-CPT revealed consistent target- such as head-fixing, mice are unlikely to reliably visually attend to
locked theta across species. the screen during the ITI, driving stimulus-locked EEG events,
unlike humans. The addition of different auditory tones for target
Effortful motivation: PRBT and nontarget trials may be needed for effective stimulus-locked
The behavioral performance of humans and mice in the PRBT was manipulation for future trials, though the need for trial-and-error
consistent with earlier reports [15, 16, 58]. Previous EEG studies parameterization will likely delay the utilization of this task. The
have implicated alpha power with effortful behavior in humans response-locked differentiation of EEG signals to target and
[41–43], including changes due to physical and mental fatigue nontarget trials presented here is technically a misnomer because
[44, 45]. More recently, diminished alpha power was described in correct rejections to nontarget trials do not include a response.
mice lacking metabotropic glutamate receptor 5 [59], and rats These EEG “responses” were at the end of the hold period, thus,
lacking the Fmr1 gene [60], although it is not clear if this was tied the intrinsic EEG response differed between conditions, by
to motivational state since it was simply in awake rodents. Our definition. The novel difficulty manipulation was, therefore, used
present data, therefore, add to human literature showing a to assess related domain constructs on hit trials where the
duration-specific decline in posterior alpha power in humans, imperative event (i.e., a response to targets) was identical.
confirming this same effect in mice performing the PRBT, thereby Response-locked theta was strongly enhanced in more difficult
enabling assessment of both patient populations and their rodent hit trials in humans. While response-locked theta was seen in mice,
models. The scale of this alpha power decline correlated with the no effect of difficulty was observed on performance or this EEG
breakpoint in humans, but evidence for a similar relationship in response in mice. This difference likely reflects the ineffectiveness
mice was uncertain, likely due to lower sample sizes. Some of manipulating trial difficulty based on stimulus durations by trial
evidence in support of the relationship emerged when comparing type in mice—shorter delays make target trials more difficult but
the alpha power of animals with differing breakpoints and makes withholding from nontarget trials easier. Ultimately, more
requires future study. Given that posterior alpha is the single work is required for manipulation of spatial attention and
most dominant background rhythm in humans, these data parameterization of difficulty in mice (e.g., a similar backward
support the idea that some common neural architecture is mask used in humans), although the addition of discriminant
preserved across mammalian species that is stimulated during auditory tones may be able to address multiple issues. A wealth of
the performance of the same task. Future studies will have to prior findings suggests that it is too early to rule out frontal theta
confirm that this neural correlate of effortful performance is as a viable candidate for cross-species translation. Posterror
altered across clinical populations and in animals manipulated to cingulate theta power enhancement has been shown in humans
be relevant to the population, and whether it is sensitive to and rats [65], as has a cue-locked dopamine-dependent theta
pharmacologic agents. signal [66]. These data, therefore, provide support but require
further work.
Reward learning: PLT
While humans were predictably effective at performing this task, Limitations and future directions
mice performed just above chance, unless the task was simplified. While the mere concept of comparing cross-species brain
Despite these addressable difficulties in training and performance, responses deserves a critical appraisal, there is good reason to
the similarities between tasks facilitates comparison of EEG theorize that some electrophysiological activities remain pre-
responses during task completion. The analytic contrasts were served across species. Although classic EEG frequencies are non-
Translational Psychiatry (2021)11:482J.F. Cavanagh et al.
9
specifically related to cognitive constructs and are likely to simply will soon be further evaluated as electrophysiological signatures of
reflect the intrinsic computations of the generative cortex, event- behavioral dimensions from cross-species paradigms.
related local field oscillations are closely linked to any neuronal
mechanism that implements neural computations [67–70]. There
is a marked preservation of temporal activity across vertebrate CODE AVAILABILITY
brains, likely due to architectural adjustments that evolved to All data and Matlab codes are available on Openneuro.org, accession #ds003638.
prioritize retention of temporal coding schemes [71]. Increasing
evidence also confirms neurodevelopmental CNS synchronization
in EEG responses between humans and rodents, as well as the REFERENCES
consistent impact of alcohol and auditory stimuli on these event- 1. Barch DM, Carter CS. Measurement issues in the use of cognitive neuroscience
related oscillations [65, 72–74]. These theoretical justifications and tasks in drug development for impaired cognition in schizophrenia: a report of
the second consensus building conference of the CNTRICS initiative. Schizophr
empirical outcomes are compelling, and they dovetail with the
Bull. 2008;34:613–8.
potential for assessing electrophysiology in each species. 2. Young JW, Light GA. Cross-species neurophysiological biomarkers of attentional
Statistical effects reported here were modest. As noted earlier, dysfunction in Schizophrenia: bridging the translational gap. Neuropsycho-
modulation of these exact tf-ROIs will be tested in future studies pharmacology. 2018;43:230–1.
as a continuation of the novel UH funding mechanism via an 3. Sarter M. Animal cognition: defining the issues. Neurosci Biobehav Rev.
overall “learn-confirm” design strategy. This report serves to 2004;28:645–50.
convey a crystallized set of parameters that will be used in future 4. Insel T, Cuthbert B, Garvey M, Heinssen R, Pine DS, Quinn K, et al. Research
tests of pharmacologic modulation. With additional experiments domain criteria (RDoC): toward a new classification framework for research on
and increased sample sizes in mice (comparable to that of mental disorders. Am J Psychiatry. 2010;167:748–51.
5. Cuthbert BN, Insel TR. Toward new approaches to psychotic disorders: the NIMH
humans), the degree of test-retest reliability will be established
research domain criteria project. Schizophr Bull. 2010;36:1061–2.
and further consistencies may be revealed across species. We 6. Bryce CA, Floresco SB. Perturbations in effort-related decision-making driven by
included both males and females of both species and, while sex acute stress and corticotropin-releasing factor. Neuropsychopharmacology.
differences in learning have been reported [75–77], we largely 2016;41:2147–59.
have not seen such sex differences. These future studies will add 7. Cocker PJ, Hosking JG, Benoit J, Winstanley CA. Sensitivity to cognitive effort
to our current knowledge. mediates psychostimulant effects on a novel rodent cost/benefit decision-
These data only compared findings from a single electrode in making task. Neuropsychopharmacology. 2012;37:1825–37.
humans with a single dura lead in mice. While this theory-driven 8. Horan WP, Reddy LF, Barch DM, Buchanan RW, Dunayevich E, Gold JM, et al.
reduction of spatial dimensionality is appropriate with our a priori Effort-based decision-making paradigms for clinical trials in schizophrenia: part 2
- External validity and correlates. Schizophr Bull. 2015;41:1055–65.
hypotheses and the preliminary goals of this study, it offers only a
9. Reddy LF, Horan WP, Barch DM, Buchanan RW, Dunayevich E, Gold JM, et al.
fraction of assessable EEG activities in each species. Any Effort-based decision-making paradigms for clinical trials in schizophrenia: part 1
conclusion of translational similarity is also based on a qualitative - psychometric characteristics of 5 paradigms. Schizophr Bull. 2015;41:1045–54.
assessment of common within-species statistical effects. While this 10. Floresco SB, Ghods-Sharifi S. Amygdala-prefrontal cortical circuitry regulates
simplicity is beneficial here, future comparative studies could effort-based decision making. Cereb Cortex. 2007;17:251–60.
utilize data normalization, computational modeling, and covar- 11. Hosking JG, Floresco SB, Winstanley CA. Dopamine antagonism decreases will-
iance statistics for quantitative assessments of common neural ingness to expend physical, but not cognitive, effort: a comparison of two rodent
signatures between species. Notably, these data-driven strategies cost/benefit decision-making tasks. Neuropsychopharmacology. 2015;40:1005–15.
require a large amount of data, and thus they are not likely to be 12. Salamone JD, Correa M, Farrar AM, Nunes EJ, Pardo M. Dopamine, behavioral
economics, and effort. Front Behav Neurosci. 2009;3:13.
undertaken unless they follow compelling findings from small-
13. Wolf DH, Satterthwaite TD, Kantrowitz JJ, Katchmar N, Vandekar L, Elliott MA,
scale hypothesis-driven studies, as presented here. et al. Amotivation in schizophrenia: integrated assessment with behavioral,
clinical, and imaging measures. Schizophr Bull. 2014;40:1328–37.
14. Strauss GP, Whearty KM, Morra LF, Sullivan SK, Ossenfort KL, Frost KH. Avolition in
CONCLUSION schizophrenia is associated with reduced willingness to expend effort for reward
The failure of preclinical models based on behavioral measures on a Progressive Ratio task. Schizophr Res. 2016;170:198–204.
alone is well-established. If we are to understand the complex 15. Bismark AW, Thomas ML, Tarasenko M, Shiluk AL, Rackelmann SY, Young JW,
neural mechanisms underlying cognitive deficits in psychiatric et al. Relationship between effortful motivation and neurocognition in schizo-
disorders, novel approaches linked to neural outcomes must be phrenia. Schizophr Res. 2018;193:69–76.
16. Young JW, Markou A. Translational rodent paradigms to investigate neuro-
taken. This field is most likely to advance by investigating similar
mechanisms underlying behaviors relevant to amotivation and altered reward
bio-signals between species. The comparison of mouse and processing in schizophrenia. Schizophr Bull. 2015;41:1024–34.
human event-related EEG responses is, therefore, an appropriate 17. Young JW, Geyer MA, Halberstadt AL, van Enkhuizen J, Minassian A, Khan A, et al.
next step, based not only on the methodological advantages but Convergent neural substrates of inattention in bipolar disorder patients and
also the theoretical similarities between potentially preserved dopamine transporter-deficient mice using the 5-choice CPT. Bipolar Disord.
neural mechanisms. Here, we present three tasks that are for the 2020;22:46–58.
first time revealing a common translational event-related EEG 18. Frank MJ, Seeberger LC, O’Reilly RC. By carrot or by stick: cognitive reinforcement
responses between humans and mice. learning in parkinsonism. Science (80-). 2004;306:1940–3.
Importantly, the PRBT revealed that arousal-related posterior 19. Ragland JD, Cohen NJ, Cools R, Frank MJ, Hannula DE, Ranganath C. CNTRICS
imaging biomarkers final task selection: Long-term memory and reinforcement
alpha appears common between species, and it should be easy to
learning. Schizophr Bull. 2012;38:62–72.
assess the generalizability of this effect within a variety of other 20. Amitai N, Young JW, Higa K, Sharp RF, Geyer MA, Powell SB. Isolation rearing
tasks. From the PLT, we reveal a very compelling similarity effects on probabilistic learning and cognitive flexibility in rats. Cogn Affect
between species based on a common computation defined by Behav Neurosci. 2014;14:388–406.
reinforcement learning: the degree of reward surprise coded 21. Amodeo DA, Jones JH, Sweeney JA, Ragozzino ME. Differences in BTBR T+ tf/J
within mid-frontal delta-band power. These two successful and C57BL/6J mice on probabilistic reversal learning and stereotyped behaviors.
paradigms—PLT and PRBT—are both currently being assessed Behav Brain Res. 2012;227:64–72.
with pharmacologic manipulations across species. While the 5C- 22. Bari A, Theobald DE, Caprioli D, Mar AC, Aidoo-Micah A, Dalley JW, et al. Serotonin
CPT presented potential consistencies with target-locked theta modulates sensitivity to reward and negative feedback in a probabilistic reversal
learning task in rats. Neuropsychopharmacology. 2010;35:1290–301.
seen across species, more work is required for parametric
23. Hyman JM, Holroyd CB, Seamans JK. A novel neural prediction error found in
confirmation in mice. The candidate biomarkers advanced here anterior cingulate cortex ensembles. Neuron. 2017;95:447–56.e3.
Translational Psychiatry (2021)11:482J.F. Cavanagh et al.
10
24. Reddy LF, Waltz JA, Green MF, Wynn JK, Horan WP. Probabilistic reversal learning 52. Colquhoun D. The reproducibility of research and the misinterpretation of P
in schizophrenia: stability of deficits and potential causal mechanisms. Schizophr values. R Soc Open Sci. 2017;4:1–22.
Bull. 2016;42:942–51. 53. Halsey LG, Curran-Everett D, Vowler SL, Drummond GB. The fickle P value gen-
25. Waltz JA, Frank MJ, Robinson BM, Gold JM. Selective reinforcement learning erates irreproducible results. Nat Methods. 2015;12:179–85.
deficits in schizophrenia support predictions from computational models of 54. Harper J, Malone SM, Bernat EM. Theta and delta band activity explain N2 and P3
striatal-cortical dysfunction. Biol Psychiatry. 2007;62:756–64. ERP component activity in a go/no-go task. Clin Neurophysiol. 2014;125:124–32.
26. Ryu V, Ha RY, Lee SJ, Ha K, Cho HS. Behavioral and electrophysiological alterations 55. Cavanagh JF, Frank MJ. Frontal theta as a mechanism for cognitive control.
or reinforcement learning in manic and euthymic patients with bipolar disorder. Trends Cogn Sci. 2014;18:1–8.
CNS Neurosci Ther. 2017;23:248–56. 56. Cohen MX, Cavanagh JF. Single-trial regression elucidates the role of prefrontal
27. Bakic J, Pourtois G, Jepma M, Duprat R, De Raedt R, Baeken C. Spared internal but theta oscillations in response conflict. Front Psychol. 2011;2:30.
impaired external reward prediction error signals in major depressive disorder 57. Cavanagh JF, Zambrano-Vazquez L, Allen JJB. Theta lingua franca: a common mid-
during reinforcement learning. Depress Anxiety. 2017;34:89–96. frontal substrate for action monitoring processes. Psychophysiology. 2012;49:220–38.
28. Kunisato Y, Okamoto Y, Ueda K, Onoda K, Okada G, Yoshimura S, et al. Effects of 58. Carter RJ, Lione LA, Humby T, Mangiarini L, Mahal A, Bates GP, et al. Character-
depression on reward-based decision making and variability of action in prob- ization of progressive motor deficits in mice transgenic for the human Hun-
abilistic learning. J Behav Ther Exp Psychiatry. 2012;43:1088–94. tington’s disease mutation. J Neurosci. 1999;19:3248–57.
29. Pizzagalli DA, Jahn AL, O’Shea JP. Toward an objective characterization of an 59. Aguilar DD, Strecker RE, Basheer R, McNally JM. Alterations in sleep, sleep spindle,
anhedonic phenotype: a signal-detection approach. Biol Psychiatry. 2005;57:319–27. and EEG power in mGluR5 knockout mice. J Neurophysiol. 2020;123:22–33.
30. Sutton RS, Barto AG. Reinforcement learning: an introduction. Cambridge: MIT 60. Kozono N, Okamura A, Honda S, Matsumoto M, Mihara T. Gamma power
Press; 1998. abnormalities in a Fmr1-targeted transgenic rat model of fragile X syndrome. Sci
31. Luck SJ, Ford JM, Sarter M, Lustig C. CNTRICS final biomarker selection: control of Rep. 2020;10:1–9.
attention. Schizophr Bull. 2012;38:53–61. 61. Warren CM, Hyman JM, Seamans JK, Holroyd CB. Feedback-related negativity
32. Lustig C, Kozak R, Sarter M, Young JW, Robbins TW. CNTRICS final animal model observed in rodent anterior cingulate cortex. J Physiol Paris. 2015;109:87–94.
task selection: control of attention. Neurosci Biobehav Rev. 2013;37:2099–110. 62. van Enkhuizen J, Henry BL, Minassian A, Perry W, Milienne-Petiot M, Higa KK, et al.
33. Young JW, Light GA, Marston HM, Sharp R, Geyer MA. The 5-choice continuous Reduced dopamine transporter functioning induces high-reward risk-preference
performance test: Evidence for a translational test of vigilance for mice. PLoS consistent with bipolar disorder. Neuropsychopharmacology. 2014;39:3112–22.
ONE. 2009;4:e4227. 63. Young JW, Jentsch JD, Bussey TJ, Wallace TL, Hutcheson DM. Consideration of
34. Young JW, Geyer MA, Rissling AJ, Sharp RF, Eyler LT, Asgaard GL, et al. Reverse species differences in developing novel molecules as cognition enhancers.
translation of the rodent 5C-CPT reveals that the impaired attention of people Neurosci Biobehav Rev. 2013;37:2181–93.
with schizophrenia is similar to scopolamineinduced deficits in mice. Transl 64. Zeeb FD, Robbins TW, Winstanley CA. Serotonergic and dopaminergic modula-
Psychiatry. 2013;3:e324–10. tion of gambling behavior as assessed using a novel rat gambling task. Neu-
35. Young JW, Roberts BZ, Breier M, Swerdlow NR. Amphetamine improves rat ropsychopharmacology. 2009;34:2329–43.
5-choice continuous performance test (5C-CPT) irrespective of concurrent low- 65. Narayanan NS, Cavanagh JF, Frank MJ, Laubach M. Common medial frontal
dose haloperidol treatment. Psychopharmacol (Berl). 2020;237:1959–72. mechanisms of adaptive control in humans and rodents. Nat Neurosci.
36. MacQueen DA, Minassian A, Kenton JA, Geyer MA, Perry W, Brigman JL, et al. 2013;16:1–10.
Amphetamine improves mouse and human attention in the 5-choice continuous 66. Parker KL, Chen K-H, Kingyon JR, Cavanagh JF, Narayanan NS. Medial frontal ∼4-
performance test. Neuropharmacology. 2018;138:87–96. Hz activity in humans and rodents is attenuated in PD patients and in rodents
37. Young JW, Powell SB, Scott CN, Zhou X, Geyer MA. The effect of reduced dopamine with cortical dopamine depletion. J Neurophysiol. 2015;114:1310–20.
D4 receptor expression in the 5-choice continuous performance task: separating 67. Bastos AM, Usrey WM, Adams RA, Mangun GR, Fries P, Friston KJ. Canonical
response inhibition from premature responding. Behav Brain Res. 2011;222:183–92. microcircuits for predictive coding. Neuron. 2012;76:695–711.
38. Buzsáki G, Anastassiou CA, Koch C. The origin of extracellular fields and currents 68. Friston K. A theory of cortical responses. Philos Trans R Soc L B Biol Sci.
— EEG, ECoG, LFP and spikes. Nat Rev Neurosci. 2012;13:407–20. 2005;360:815–36.
39. Delorme A, Makeig S. EEGLAB: an open source toolbox for analysis of single-trial 69. Siegel M, Donner TH, Engel AK. Spectral fingerprints of large-scale neuronal
EEG dynamics including independent component analysis. J Neurosci Methods. interactions. Nat Rev Neurosci. 2012;13:121–34.
2004;134:9–21. 70. Womelsdorf T, Valiante TA, Sahin NT, Miller KJ, Tiesinga P. Dynamic circuit motifs
40. Nolan H, Whelan R, Reilly RB. FASTER: fully automated statistical thresholding for underlying rhythmic gain control, gating and integration. Nat Neurosci.
EEG artifact rejection. J Neurosci Methods. 2010;192:152–62. 2014;17:1031–39.
41. Kardan O, Adam K, Mance I, Churchill NW, Vogel EK, Berman MG. Distinguishing 71. Buzsáki G, Logothetis N, Singer W. Scaling brain size, keeping timing: evolu-
cognitive effort and working memory load using scale-invariance and alpha tionary preservation of brain rhythms. Neuron. 2013;80:751–64.
suppression in EEG. Neuroimage. 2020;211:116622. 72. Robble MA, Schroder HS, Kangas BD, Nickels S, Breiger M, Iturra-Mena AM, et al.
42. Pathania A, Leiker AM, Euler M, Miller MW, Lohse KR. Challenge, motivation, and Concordant neurophysiological signatures of cognitive control in humans and
effort: neural and behavioral correlates of self-control of difficulty during practice. rats. Neuropsychopharmacology. 2021;46:1–11.
Biol Psychol. 2019;141:52–63. 73. Ehlers CL, Wills DN, Desikan A, Phillips E, Havstad J. Decreases in energy and
43. Seifi Ala T, Graversen C, Wendt D, Alickovic E, Whitmer WM, Lunner T. An increases in phase locking of event-related oscillations to auditory stimuli occur
exploratory study of EEG alpha oscillation and pupil dilation in hearing-aid users during adolescence in human and rodent brain. Dev Neurosci. 2014;36:175–95.
during effortful listening to continuous speech. PLoS ONE. 2020;15:e0235782. 74. Ehlers CL, Phillips E, Wills D, Benedict J, Sanchez-Alavez M. Phase locking of
44. Barwick F, Arnett P, Slobounov S. EEG correlates of fatigue during administration event-related oscillations is decreased in both young adult humans and rats with
of a neuropsychological test battery. Clin Neurophysiol. 2012;123:278–84. a history of adolescent alcohol exposure. Addict Biol. 2020;25:1–12.
45. Moraes H, Deslandes A, Silveira H, Ribeiro P, Cagy M, Piedade R, et al. The effect of 75. Chen CS, et al. Divergent strategies for learning in males and females. Curr Biol.
acute effort on EEG in healthy young and elderly subjects. Eur J Appl Physiol. 2020;31:1–12.
2011;111:67–75. 76. Marquardt K, Sigdel R, Caldwell K, Brigman JL. Prenatal ethanol exposure impairs
46. Smit AS, Eling PA, Hopman MT, Coenen AML. Mental and physical effort affect executive function in mice into adulthood. Alcohol Clin Exp Res. 2014;38:2962–8.
vigilance differently. Int J Psychophysiol. 2005;57:211–7. 77. Cavanagh JF, Frank MJ, Klein TJ, Allen JJB. Frontal theta links prediction errors to
47. Cavanagh JF, Bismark AW, Frank MJ, Allen JJB. Multiple dissociations between behavioral adaptation in reinforcement learning. Neuroimage. 2010;49:3198–209.
comorbid depression and anxiety on reward and punishment processing: evi-
dence from computationally informed EEG. Comput Psychiatry. 2018;3:1–17.
48. Proudfit GH. The reward positivity: from basic research on reward to a biomarker
for depression. Psychophysiology. 2015;52:449–59.
ACKNOWLEDGEMENTS
49. Webb CA, Auerbach RP, Bondy E, Stanton CH, Foti D, Pizzagalli DA. Abnormal
We thank our colleagues Drs. Mark Geyer and Arpi Minassian for their continued
neural response to feedback in depressed adolescents. J Abnorm Psychol.
support, Dr. Johnny Kenton for his editing support, in addition to our steering
2016;126:19–31.
committee for their advice, including Drs. Jeff Daskalakis, Patricio O’Donnell, Steven
50. Cavanagh JF. Cortical delta activity reflects reward prediction error and related
Siegel, Vikaas Sohal, and Catherin Winstanley, as well as NIMH Program Officers Drs.
behavioral adjustments, but at different times. Neuroimage. 2015;110:205–16.
Lois Winsky, Jamie Driscoll, and Bettina Buhring. Expert technical assistance was
51. Bernat EM, Nelson LD, Baskin-Sommers AR. Time-frequency theta and delta
provided by Benjamin Z. Roberts and John Nungaray. The current project was funded
measures index separable components of feedback processing in a gambling
by NIMH UH2 MH109168.
task. Psychophysiology. 2015;52:626–37.
Translational Psychiatry (2021)11:482You can also read