A Meta-Analysis of Human Personality and Robot Acceptance in Human-Robot Interaction
←
→
Page content transcription
If your browser does not render page correctly, please read the page content below
A Meta-Analysis of Human Personality and Robot Acceptance in
 Human-Robot Interaction

CONNOR ESTERWOOD, School of Information, University of Michigan, USA
KYLE ESSENMACHER, School of Information, University of Michigan, USA
HAN YANG, School of Information, University of Michigan, USA
FANPAN ZENG, School of Information, University of Michigan, USA
LIONEL P. ROBERT, School of Information, Robotics Institute, University of Michigan, USA

ABSTRACT:
Human personality has been identified as a predictor of robot acceptance in the human–robot interaction (HRI)
literature. Despite this, the HRI literature has provided mixed support for this assertion. To better understand the
relationship between human personality and robot acceptance, this paper conducts a meta-analysis of 26 studies.
Results found a positive relationship between human personality and robot acceptance. However, this
relationship varied greatly by the specific personality trait along with the study sample’s age, gender
diversity, task, and global region. This meta-analysis also identified gaps in the literature. Namely, additional
studies are needed that investigate both the big five personality traits and other personality traits, examine a
more diverse age range, and utilize samples from previously unexamined regions of the globe.

CCS Concepts: • Computer systems organization → Robotics; • Human-centered computing → Human
computer interaction (HCI).

Additional Key Words and Phrases: Personality; Robot Acceptance; Individual Differences; Human-Robot
Interaction; HRI; Meta-Analysis; Anxiety; Adaptability; Enjoyment; Sociability; Social Presence; Trust

ACM Reference Format:
Connor Esterwood, Kyle Essenmacher, Han Yang, Fanpan Zeng, and Lionel P. Robert. 2021. A Meta-Analysis of
Human Personality and Robot Acceptance in Human-Robot Interaction. In CHI Conference on Human Factors in
Computing Systems (CHI ’21), May 8–13, 2021, Yokohama, Japan. ACM, New York, NY, USA, 26 pages. https://
doi.org/10.1145/3411764.3445542

1 INTRODUCTION
In the study of human-robot interaction, human personality has been identified as a predictor of whether
humans will accept robots. Examples include studies that employ a human’s personality trait score to predict
whether that person will accept a robot in a given context [2, 3, 8, 15, 18, 35, 53, 59, 86, 87, 90, 100, 102]. There is now
a tendency to assume that at least one of the Big Five personality traits can be used to understand whether
a person will accept a robot [81, 82]. Despite this intuitive appeal, several literature reviews on the topic have
highlighted inconsistencies in the relationship between human personality and the acceptance of robots [28, 82].
However, none of those studies engaged in a systematic quantitative meta-analysis to empirically examine this
relationship. This leaves open questions regarding

 1
CHI ’21, May 8–13, 2021, Yokohama, Japan Esterwood et al., 2021

the importance of human personality in predicting the acceptance of robots. In the absence of such an analysis,
it is difficult to know whether or when human personality can be used to predict robot acceptance. It is also
difficult to confidently deploy effective design solutions based on this knowledge.
 The goal of this study was to conduct a quantitative meta-analysis to answer these questions: Can human
personality be used to predict robot acceptance, and if so, when? This paper focuses on personality and robot
acceptance because they represent two vital concepts in our broader nomological networks used to understand
human-robot interactions. Human personality is a stable human trait that is always present across different
interactions and contexts, supporting its use as a robust predictor of human attitudes and behaviors [11, 29, 32, 62,
89]. Technology acceptance has long been associated with the ability to fully leverage that technology [83]. More
specifically, robot acceptance has been positively associated with human–robot interactions and successful
human–robot collaborations [13, 44, 67]. We conducted a meta-analysis because it could allow us to answer
these questions (i.e. Can human personality be used to predict robot acceptance, and if so, when?) in the face
of conflicting or mixed results by leveraging multiple studies on human personality and robot acceptance. This
meta-analysis allowed us to overcome the limitations of any single HRI study suffering from small sample and
effect sizes (see:[82]). A meta-analysis can also help to identify gaps in the literature that need further study. In
all, this meta-analysis allowed us to expand and clarify our understanding of the relationship between two
essential concepts used to view human interactions with robots.

2 BACKGROUND
Personality can be defined as an individual’s “characteristic pattern of behaviours in the broad sense (including
thoughts, feelings, and motivation)” [6, Pg.527]. Therefore, it is not surprising that personality can predict an
individual’s future cognition, emotion and behavior [57, 75]. Personality has been especially useful when
attempting to comprehend the ways in which people respond to others and the quality of these interactions
overall [25, 75, 96]. Scholars across several disciplines including sociology [33, 68], psychology [9, 27], political
science [23, 34, 91], human computer interaction (HCI) [55, 77, 99], and organizational behavior [5, 27, 75] have
each examined the ability of personality to predict certain human behaviors.
 Theories of personality can be generally categorized into five schools of thought [66]. Although each
school of thought is unique and distinct they also overlap in many ways. To date, there is no single unified theory
of personality but, rather a range of approaches with different emphases. A comprehensive review and discussion
of each approach is outside the scope of this paper (see [66] for review). However, we present a summary of each
of these approaches.
 The first approach is the trait based approach to personality psychology. The trait based approach takes the
view that sets of traits or “organized dispositions within the individual” [66, Pg.30], make up the backbone of
personality and can be utilized to predict human behavior [1, 65]. There is debate within this school of
thought on the precise number of traits as well as which sets of traits most accurately represent personality.
Different sets of traits each have some form of empirical support but the set garnering the most empirical
support is the Big Five [66]. The Big Five personality traits are: extraversion, neuroticism, openness,
agreeableness, and conscientiousness [50, 63]. The trait based approach to personality typically relies on self-
reports that categorize individuals based on their scores across trait-related items [66]. The second approach is
the psycho-dynamic approach to personality psychology. This approach emphasizes the importance of emotional
responses and emotional conflict [31]. This approach also emphasizes the role of the unconscious mind [66]. The
third approach is the cognitive/social learning approach. This approach takes the view that personality is
formed via cognition. The cognitive/social learning approach focuses on individual differences related to
thinking, planning, and problem solving [66, 69, 70]. The fourth approach is the humanistic view
 2
A Meta-Analysis of Human Personality and Robot Acceptance in Human-Robot Interaction CHI ’21, May 8–13, 2021, Yokohama, Japan

 of personality. This approach sees personality as a manifestation of searches for meaning, personal
 constructs, life narrative, and self-actualization [66]. Finally, there is the evolutionary psychology approach.
 This approach revolves around personality as a neurological or biological mechanism developed for
 evolutionary purposes. This approach focuses on biological stimuli and responses as a means of explaining
 personality and individual behavior [14, 66]. Although these schools of thought differ in distinct ways, they
 all see personality as a predictor of human behavior. Each of these theories differentiates the mechanisms
 through which personality is formed and expressed, but they hold in common a belief that personality exists,
 differs among individuals, and can lead to differences in behavior.
 For the proposes of this review we adopted the trait based approach to personality. We used this approach
 because of its popularity in the HRI literature. This perspective views human personality as more than just a
 single factor and capable of being divided into a variety of different personality traits. This division or
 specification allows researchers a more precise approach to linking a particular personality trait to a
 particular outcome [42, 66, 94]. At present, the Big Five personality traits are the predominant set of traits
 used across many fields [57, 81, 82], including HRI studies [28, 55, 77, 81, 82, 99]. The personality traits that make
 up the Big Five are extroversion, agreeableness, conscientiousness, neuroticism (sometimes called emotional
 instability), and openness to experience [36, 50, 65]. Agreeableness can be defined as the extent to which
 someone is cooperative and friendly [75]. Conscientiousness is the extent that individuals are careful,
 deliberative, and self-aware of their actions [94]. Extroversion is often presented as a spectrum with two poles
 one being extroversion and the other introversion. Extroversion is the extent to which an individual is
 outgoing, assertive, talkative, and sociable [80], whereas introversion is the degree to which someone is shy,
 enjoys being quiet, and enjoys being alone [25]. Neuroticism is the degree to which someone is easily angered,
 not well-adjusted, insecure, or lacking in self-confidence [25]. Finally, openness to experience is often defined as
 the degree to which one is imaginative, curious, and broadminded [64].
 Robot acceptance is a common outcome of interest in many human-robot interaction (HRI) personality
 studies. Acceptance can be conceptualized in a variety of ways. This paper defines robot acceptance as “the
 demonstrable willingness within a user group to employ technology for the tasks it is designed to support” [24,
 Pg.1]. Based on this definition, prior work has examined and applied aspects of the commonly employed the
 Unified Theory of Acceptance and Use of Technology (UTAUT) model [98] to many different domains [26, 52].
 Heerink et al. [44], applied the UTAUT model to the HRI domain and provided a “toolkit” with which to examine
 acceptance of robots. This model’s components and a discussion are covered in Section 4.2.
 Research on personality and robot acceptance has found mixed results. Of the personality traits investigated,
 the most measured trait is extroversion. These studies typically found positive correlations between extroversion
 and acceptance [2, 3, 8, 15, 18, 86, 87], with the exception of two studies that found negative correlations
 between some acceptance outcomes and extroversion [53, 102], thereby painting a more complex picture of
 these relationships. In terms of neuroticism, existing studies differed significantly from one another. Most
 studies looking at this personality trait and acceptance outcomes identified negative correlations between
 neuroticism and robot acceptance [8, 86, 90, 102] whereas others found positive correlations [53, 87, 100]. The
 trait of openness also saw contradiction but only from one study indicating negative correlations [53]; the
 remainder argued for a positive, albeit weak, correlation [8, 12, 18, 86]. The least commonly measured
 personality traits were agreeableness and conscientiousness. Results on agreeableness were largely consistent
 showing a positive correlation with acceptance [8, 18, 53, 86, 93]; in constrast, [21] provided evidence of a
 negative correlation. Results related to conscientiousness were mixed with some showing positive
 correlations [8, 21, 86] and others showing negative [53, 59]. Taken as a whole, it is clear that there are mixed
 results on the subject thus warranting further investigation of the matter.
 3
CHI ’21, May 8–13, 2021, Yokohama, Japan Esterwood et al., 2021

 Many researchers have sought to examine these connections. The field of HRI has seen increasing
discussion of these variables as visible in the results of [81] and [82]. Across this literature we see connections
and compelling links between human personality and acceptance but, the overall mixed nature of these
results presents new challenges to interpretation. A systematic quantitative meta-analysis was missing from
this literature. Influenced by the recent success of meta-analyses to help draw causal inference [38, 47, 60, 105],
we sought to apply this method to the subject at hand. To accomplish this, we used a psychometric meta-
analytic approach to investigate the relationship between human personality and acceptance of robots across
the existing literature. In this approach, we tackled inconsistency within the literature by weighting studies
on the basis of sample size and adjusting for measurement error. Our results contribute to the literature by
providing a touchstone from which future researchers can more easily identify gaps and contribute further to
the understanding of human personality as it relates to robot acceptance.

3 SELECTION OF CANDIDATE STUDIES
3.1 Search Process
The literature search employed multiple searches via Google Scholar, the ACM Digital Library, IEEE
Explore, and Scopus.

3.2 Search Terms
Using nine search terms, we reviewed results on the search engine results page (SERP), where we applied
specific inclusion and exclusion criteria. We paged through SERPs progressively until no single result on
the list met the specified criteria. Results prior to the page with no relevant results were extracted for review
while subsequent results were not. Each SERP contained 10–25 results (depending on the database) by default.
In total, we found 6,140 results across all of our searches before accounting for duplicate entries.
 The search terms utilized were:
 • (human) AND (robot) AND ("personality")
 • ("human robot interaction") AND ("personality")
 • ("HRI") AND ("personality")
 • (human) AND (robot) AND (personality)
 • ("human robot interaction") AND (personality)
 • ("HRI") AND (personality)
 • (robot and personality)
 • (human robot interaction and personality)
 • (HRI and personality)

 These search terms above were selected after a review of the associated keywords from previously selected
papers on the topic of personality and HRI. The goal was to identify consistently and frequently utilized
keywords. The words "personality", "personalities", "robot" and "human robot interaction" and "HRI" were by
far the most consistently and frequently utilized keywords. In addition, we found identical results across
search terms for either "human-robot interaction" vs. "human robot interaction". To verify these search
results, we compared the articles returned in this search to the articles identified by [82]. Our search terms
returned all the articles identified by [82] and 2,254 additional unique articles.
 4
A Meta-Analysis of Human Personality and Robot Acceptance in Human-Robot Interaction CHI ’21, May 8–13, 2021, Yokohama, Japan 3.3 De-Duplication We exported search results from Google Scholar in .ris format using the “publish or perish” application [41] and imported them into R for processing. For other databases, we exported results using their respective built-in tools. We conducted de-duplication using the revtools package in R [104]. Then, we removed duplicate articles on the basis of title fuzzy matching and followed up with manual screening. Then we removed duplicates, leaving 2,474 unique entries. 3.4 Criteria for Study Inclusion For this paper we used a three-stage approach, starting with broad eligibility criteria and applying progressively stricter criteria on the previously refined results. We used the initial eligibility criteria in the page-by-page review of search results and in all subsequent screenings. Then we implemented the secondary eligibility criteria in title screening, abstract screening, and full-text screening. The tertiary eligibility criteria were implemented in full-text screening. We used the exclusion criteria throughout all steps of this review. Papers were initially selected for inclusion if they met three specific criteria. First, studies were required to be classified as articles or academic works. Second, studies were required to be written in the English language. The reason for excluding non-English-language publications relates to the lack of a specialist or translator on the review team, making these studies difficult to screen appropriately. The third criterion for our initial eligibility was that the titles or abstracts retrieved were required to explicitly mention both the term “robot” and the term “personality.” At the secondary level, we selected papers on the basis of four additional eligibility criteria. First, studies were required to be empirical in nature and design. Second, these studies were required to use embodied physical action (EPA) robots. Third, studies were required to include measures of human or robot personality. Fourth, studies were eligible only if they involved humans interacting with the selected EPA robots. At the tertiary level we used criteria specific to the purposes of our meta-analysis. These eligibility criteria were that studies must examine human personality, investigate its relationship with broadly defined acceptance outcomes, and report data that are useful in the conducting of a meta-analysis (effect sizes, sample size, etc.). We excluded studies if they (1) focused on embodied virtual action (EVA; i.e., virtual agents), (2) focused on tele- presence robots, (3) focused only on manipulating robot personality without examining its impact on humans, or (4) focused only on negative attitudes toward robots (NARS) as the personality trait of interest. The exclusion of studies that used the NARS scale was based on this scale’s use as a control variable in many studies (see [106], [82]). 3.5 Screening Procedure We conducted title screening manually in the revtools environment on the 2,474 unique entries previously identified. Screening was done only on the article title with author names and publication name hidden. Title screening was conducted based on the initial eligibility criterion. This screening identified 332 eligible studies. We conducted abstract screening manually in the revtools environment on the 332 eligible studies. Abstracts were extracted from Google Scholar and manually added to the data-set utilized by revtools. We adopted this approach because Google Scholar has no native export system and the exporting of abstracts on behalf of “publish or perish” is incomplete and contains missing data. This screening incorporated all previous eligibility criteria in addition to the secondary eligibility criteria and led to the identification of 87 relevant studies. In addition, we identified 50 other potential references from previously published review papers on the topic (see [82]). All papers identified via this means were reviewed in the same way as the papers identified by our search (title and 5
CHI ’21, May 8–13, 2021, Yokohama, Japan Esterwood et al., 2021

 Paper Abbreviation Citation Link
 Brandstetter_2017 [12]
 Chevalier_2015 [15]
 Chidambaram_2012 [16]
 Conti_ 2017 [18]
 Cruz-Maya_2016_Nutrition [19]
 Damholdt_2015 [21]
 Gockley_2006 [35]
 Haring_2014 [39]
 Ivaldi_2017 [49]
 Bernotat_2017 [8]
 Kimoto_2016 [53]
 MacDorman_2015 [61]
 Nomura_2007 [72]
 Nomura_2008 [71]
 Ogawa_2009 [73]
 Park_2012 [74]
 Reich-Stiebert_2015 [79]
 Rosenthal_2013 [84]
 Salem_2015 [87]
 Sehili_2014 [90]
 Syrdal_2006 [92]
 Takayama_2009 [93]
 Vollmer_2015 [100]
 Walters_2005 [101]
 Walters_2008 [102]
 Weiss_2012 [103]
 Table 1. Selected paper for inclusion in meta-analysis with hyperlink to reference

abstract screening) and with identical criteria. Ultimately, 34 of the additional 50 references were eligible for
full-text screening.
 Full-text screening involved reading each of the 121 selected papers in detail to determine their suitability
based on all previously listed criteria and our tertiary eligibility criteria. After completing this screening, 26
papers met all of our eligibility requirements and were included in the meta-analysis. Figure 1 visually represents
this review process and the associated counts. Table 1 contains the list of selected papers included in our meta-
analysis.

4 ANALYTICAL APPROACH
The meta-analysis in this paper adopted a psychometric approach. This method was utilized to correct for a
range of different errors. Specifically, we corrected for three error types: (1) sampling error — random
variance from the population value, (2) measure error — inaccuracies that arise from flaws associated with
measurement, and (3) reporting error — where a study’s reported values differ from its actual observed
values. To accomplish this we included, where possible, information about the size of these errors. This
information was given for each study (i.e., each correlation) individually (typically via a reliability
metric). As a result, each correlation was corrected individually as determined by the R psychmeta
package [20] on the basis of the provided reliability information. This correction provided an adjusted
 6
A Meta-Analysis of Human Personality and Robot Acceptance in Human-Robot Interaction CHI ’21, May 8–13, 2021, Yokohama, Japan

 Fig. 1. Prisma Flow Diagram of Literature Selection Process

 7
CHI ’21, May 8–13, 2021, Yokohama, Japan Esterwood et al., 2021

Code Construct Definition Alpha
ANX Anxiety Evoking anxious or emotional reactions when using the system. .812
ATT Attitude Positive or negative feelings about the appliance of the technology. .851
FC Facilitating conditions Objective factors in the environment that facilitate using the system. .707
TTU Intention to use The outspoken intention to use the system over a longer period in time. .948
PAD Perceived adaptability The perceived ability of the system to be adaptive to the changing needs of the user. .709
PENJ Perceived enjoyment Feelings of joy or pleasure associated by the user with the use of the system. .774
PEOU Perceived ease of use The degree to which the user believes that using the system would be free of effort .726
PS Perceived sociability The perceived ability of the system to perform sociable behavior. .878
PU Perceived usefulness The degree to which a person believes that using the system would enhance his or her daily activities .865
SI Social influence The user’s perception of how people who are important to him think about him using the system .794
SP Social presence The experience of sensing a social entity when interacting with the system. .816
Trust Trust The belief that the system performs with personal integrity and reliability. .732
Use Use/Usage The actual use of the system over a longer period in time na
 Table 2. Acceptance constructs as presented in [44]

effect size value for each study. We then conducted the meta-analysis on these corrected effect sizes. In cases
where studies reported on more than one effect size per sample, we collapsed (reduced down to a single
effect size) these studies and took the average [45].

4.1 Identification of Personality Trait
To examine the impact of personality this study used the average effect size of the various measures of human
personality across the studies. These personality measures were one of the Big Five personality traits [37, 51].
Most studies reported at least one of these personality traits. We also reverse coded the effects of
neuroticism to convert it to emotional stability. This was to ensure that all the effects were compatible with
one another. All of this allowed us to investigate the relationship between human personality and robot
acceptance across all the studies.

4.2 Identification of Acceptance Outcomes
The primary outcome of interest for this analysis was robot acceptance. For the purpose of this meta-analysis
the extended version of the UTAUT model proposed and validated by [44] provided a useful framework by which
to define and categorize different subgroups of acceptance. This model defines 13 subgroups of acceptance. The
studies identified within this meta-analysis employed a variety of acceptance measures. However, each of these
measures was capable of fitting into the subgroups of the UTAUT model provided by [44]. Table 2 details the
subgroups, their respective definitions and reported as presented in [44].
 To verify that the theoretical grouping of the outcomes was valid, we conducted an additional analysis.
Based on a recommendation by [10], we conducted an analysis of variance (ANOVA) with human
personality as the predictor, the overall acceptance construct as the outcome and the outcome type
representing each specific outcome under the umbrella of acceptance as a moderator. Significant effects for
the moderator would indicate that a specific outcome under the umbrella of acceptance was sufficiently
different from the other outcomes. Once identified this outcome should be removed or dropped from the
group of outcomes representing acceptance. Non-significant effects would indicate that an outcome under the
umbrella of acceptance was sufficiently similar and that it should be included. The results of the aforementioned
analysis indicated no significant differences, thereby providing empirical support for the grouping of our
selected outcomes under the umbrella of acceptance. Results of this analysis are presented in Table 3. As
shown in Table 3, “subgroup 1” and “subgroup 2” are the different groups that fall under the umbrella of
acceptance.
 8
A Meta-Analysis of Human Personality and Robot Acceptance in Human-Robot Interaction CHI ’21, May 8–13, 2021, Yokohama, Japan

 Subgroup 1 Subgroup 2 Mean Diff Sig CI_LL_95 CI_UL_95
 ANX ATT 0.066226 N -0.1283 0.2608
 ANX PS -0.11139 N -0.3052 0.0824
 ANX PU -0.06061 N -0.1952 0.074
 ANX SP -0.09057 N -0.3175 0.1363
 ANX Trust -0.09086 N -0.2624 0.0807
 ANX TTU 0.162284 N -0.168 0.4926
 ANX USE -0.24009 N -0.6485 0.1684
 ATT PS -0.17762 N -0.396 0.0408
 ATT PU -0.12684 N -0.2942 0.0406
 ATT SP -0.15679 N -0.3772 0.0636
 ATT Trust -0.15709 N -0.3572 0.0431
 ATT TTU 0.096058 N -0.2328 0.4249
 ATT USE -0.30632 N -0.6522 0.0395
 PS PU 0.050777 N -0.1176 0.2192
 PS SP 0.020824 N -0.2122 0.2538
 PS Trust 0.02053 N -0.1774 0.2184
 PS TTU 0.273675 N -0.0635 0.6109
 PS USE -0.1287 N -0.508 0.2506
 PU SP -0.02995 N -0.3139 0.254
 PU Trust -0.03025 N -0.1697 0.1092
 PU TTU 0.222898 N -0.1071 0.5529
 PU USE -0.17948 N -0.7775 0.4185
 SP Trust -0.00029 N -0.2195 0.2189
 SP TTU 0.252851 N -0.1143 0.62
 SP USE -0.14953 N -0.8112 0.5121
 Trust TTU 0.253145 N -0.0755 0.5818
 Trust USE -0.14923 N -0.5325 0.2341
 TTU USE -0.40238 N -0.8761 0.0713
 Table 3. Results of a Wald test comparing correlations for bins with more than k=1 studies

The “Mean Diff” is the difference in values between those groups, while “Sig” indicates if the difference
between the two groups are significant, and “CI LL 95” as well as “CI UL 95” represent the 95% confidence
interval at the lower and upper levels for that difference, respectively.

4.3 Calculation of Effect Sizes
Effect sizes are defined as values reflective of the magnitude (i.e. strength) of a treatment effect on a
relationship between two variables [10]. Effect sizes are a key component to conducting meta-analyses. For
this analysis, effect sizes were converted to (correlation) values because this meta-analysis focuses on
correlation. When possible, was obtained directly from the study. However, when not possible, we
calculated it using [17] or [56]. The specific calculations used depended on the data reported. Most
approaches involved converting a given statistical result to Cohen’s (non-correlation effect size) and then
converting this value to . We calculated the conversion from Cohen’s to as recommended by [10] using
Equation 1. For conversion to Cohen’s from studies that reported tests with equal sample sizes, we used
Equation 2; for test values that reported unequal sample sizes, we used Equation 3, and for test values,
Equation 4 per [95], where subscript refers to treatment and subscript refers to comparison/control

 9
CHI ’21, May 8–13, 2021, Yokohama, Japan Esterwood et al., 2021

condition. For studies that reported only 2 (eta squared) values we used Equation 5 and converted directly to
 as recommended by [54]. Eta squared is analogous to 2 and represents effect size in a similar fashion [88].

 = q (1)
 2 ( + ) 2
 + 1 1 22

 ¯ − ¯
 = (2)

 r
 + +
 = (3)
 + − 2

 ¯ − ¯
 = q (4)
 ( + −2
 +
 )

 q
 = 2 (5)

4.4 Reliability
In addition to effect sizes, construct reliability is a vital component to conducting the meta-analysis.
Reliability is essentially the ratio of “true” (i.e., corrected) variance to total variance present in the
measurement of a variable of interest [10]. When possible, we took construct reliability directly from the
study. This typically took the form of s. When these values were not available, however, we imputed the
data from existing reliability data using the recommended method within the R psychmeta package [20].

4.5 Variance Estimates
Another key component to conducting meta-analyses is variance estimates. Variance estimates represent the
degree to which the effect sizes observed are caused by random error vs. “real” among between studies [10].
Variance estimates can be used to determine the presence of possible moderators. A large degree of
unaccounted variance might not be caused by error alone but instead could be attributable to aspects or
characteristics of the study or sample that function as moderators between the predictor and the outcome of
interest [10, 58]. Therefore, a significantly large variance estimates indicates possible moderators. To
determine whether variance estimates were significantly large, we used two measures of heterogeneity. Both
measures relied on the Hunter-Schmidt method of calculating variance [48] and were calculated in R via the
psychmeta package [20] using Equation 6 per [43] and Equation 7 per [46]. Details on the specific approach
to calculating these values are available via the psychmeta [20] documentation accessible on CRAN. For
interpretation we used both Q statistic values and 2s. Q statistic, otherwise known as Cochran’s Q test, is based
on a chi-square distribution which is based on the underlying null hypothesis that the treatment effect size is the
same across all the studies [58]. For Q statistic P values, significant values of p < 0.05 indicate that the variability
across effect sizes is “real” and not caused by measurement or random error (see Equation 6)[58]. A limitation
of Q statistic is that it might be under-powered when few studies are examined in the meta-analysis [58]. The
 2 is a more recent
 10
A Meta-Analysis of Human Personality and Robot Acceptance in Human-Robot Interaction CHI ’21, May 8–13, 2021, Yokohama, Japan

approach to examining the presence of possible moderators. The 2 divides the Q statistic minus its degrees of
freedom by the Q-value itself (see Equation 7, where 2 values of 0% to 40% might be considered indicates of low
heterogeneity, values between 30% to 60% moderate heterogeneity, 50% to 90% substantial heterogeneity, and 75%
to 100% considerable heterogeneity) [22].
 Õ
 = ¯ 2
 ( − ) (6)

 −
 2 = ( ) ∗ 100 (7)

5 RESULTS
5.1 Main Effect of Personality and Acceptance
Table 4 and Figure 2 present the meta-analytic results for the relationship between the measure of personality
effect sizes and robot acceptance. In Table 4, represents the number of studies included, represents the
number of subjects across all studies “Mean r” is the average correlation value between human personality and
acceptance, “CI LL” and “CI UL” are the confidence interval for the lower level (LL) and upper level (UL) for
the “mean r” relationship. Figure 2 visually represents these results via a forest plot where the correlation
between acceptance and personality is depicted as a point bounded by its confidence interval (lines to the left and
right of the point). This is repeated once for each study included in the analysis and can help illustrate whether
the effects across studies tend to line up or vary substantially from one study to the next.
 Investigating personality and acceptance, the estimated corrected score (i.e., “true score”) relationship
showed a significant positive relationship between human personality and robot acceptance (k=26, ¯2=0.16,
95% CI;[0.09,0.37], where number of studies = k, mean correlation = ¯2, and confidence interval = CI). Based
on the available data we can conclude that human personality is significantly related to robot acceptance.
Specifically, these results indicate a positive correlation between personality and acceptance. Next, we
conducted an analysis of heterogeneity based on and 2 to check for possible moderators. The results for the
personality measure (Q = 110 p
CHI ’21, May 8–13, 2021, Yokohama, Japan Esterwood et al., 2021

 Fig. 2. Forrest plot indicating average effect sizes (r) between personality and acceptance of robots

 Number of Studies Studies
 Aly_2013 Andrist et al, Bernotat_2017, MacDorman_2015, Brandstetter_2017,
 Chevalier_2015, Rosenthal_2013, Syrdal_2006, Conti_ 2017, Gockley_2006, Kimoto_2016,
 Personality Trait Type Ivaldi_2017, Haring_2013, Walters_2005, Chidambaram_2012, Niculescu_2013, Park_2012,
 26
 Damholdt_2015, Takayama_2009, Tapus & Mataric, 2008, Looije et al., 2010, Salam_2017,
 Salem_2015, Sehili_2014, Vollmer_2015, Walters_2008
 Andrist et al, Bernotat_2017, Brandstetter_2017, Rosenthal_2013,
 Syrdal_2006, Conti_ 2017, Kimoto_2016, Ivaldi_2017,
 Age 15 Haring_2013, Chidambaram_2012, Takayama_2009,
 Looije et al., 2010, Salem_2015, Sehili_2014, Walters_2008
 Andrist et al, Bernotat_2017, Brandstetter_2017, Chevalier_2015,
 Rosenthal_2013, Syrdal_2006, Conti_ 2017,Gockley_2006, Kimoto_2016,
 Gender 18 Ivaldi_2017, Haring_2013, Chidambaram_2012, Park_2012, Takayama_2009,
 Salem_2015, Sehili_2014, Vollmer_2015, Walters_2008
 Aly_2013, Andrist et al, Bernotat_2017, MacDorman_2015, Brandstetter_2017,
 Chevalier_2015, Syrdal_2006, Conti_ 2017, Ivaldi_2017,
 Global Region 20 Haring_2013, Walters_2005, Mileounis_2015, Chidambaram_2012,
 Niculescu_2013, Park_2012, Damholdt_2015, Takayama_2009,
 Salem_2015, Sehili_2014, Walters_2008
 Bernotat_2017, Brandstetter_2017, Chevalier_2015, Gockley_2006,
 Kimoto_2016, Ivaldi_2017, Haring_2013, Mileounis_2015, Chidambaram_2012
 Type of Task 16 Niculescu_2013, Park_2012, Damholdt_2015, Salem_2015, Sehili_2014,
 Vollmer_2015, Walters_2008
 Table 5. Counts and associated studies for each moderator investigated

5.2.1 Personality Trait. Specifically, as seen in Table 6, the “corrected score” relationships among agreeableness (k=6,
 ¯2 =0.20, 95% CI [0.08,0.53]) , extroversion (k=18, ¯2 =0.25, 95% CI [0.19,0.53]), and openness (k=8, ¯2 =0.24, 95% CI
[0.06,0.63]) were all significant and positive, providing evidence of their relationship with robot acceptance. Specifically,
 12
A Meta-Analysis of Human Personality and Robot Acceptance in Human-Robot Interaction CHI ’21, May 8–13, 2021, Yokohama, Japan

these results indicate a positive correlation between agreeableness, extroversion and openness, and robot
acceptance. In other words, the more agreeable, extroverted, and open minded an individual was, the more
likely he or she was to accept robots. Conscientiousness (k=5, ¯2=-0.02, 95% CI [-0.54,0.50]) and neuroticism
(k=11, ¯2=0.03, 95% CI [-0.15,0.24]) were not significant. In other words, the meta analysis provided no evidence
that the more conscientious or neurotic (or emotionally stable) individuals were, the more or less willing they
were to accept a robot. In all, the results only found evidence linking three of the Big Five personality traits to
robot acceptance. Details of these results are presented in Table 6 and graphically depicted in Figure 3.

 Analysis Type Predictor Trait Type sig k N mean_r CI_LL_95 CI_UL_95
 Overall Personality All Traits Y 26 1611 0.14 0.0714 0.3363
 Simple Moderator Personality Agreeableness Y 6 243 0.2 0.07 0.4954
 Simple Moderator Personality Conscientiousness N 5 123 -0.02 -0.5022 0.4536
 Simple Moderator Personality Extroversion Y 18 819 0.25 0.1842 0.477
 Simple Moderator Personality Neuroticism N 11 991 0.03 -0.1441 0.2402
 Simple Moderator Personality Openness Y 8 322 0.24 0.039 0.6111
 Table 6. Results of Personality Trait as Moderator Between Human Personality and Acceptance

 To check for possible moderators, we conducted a heterogeneity analysis based on Q and 2 . Results of this test
indicated that moderation was likely for conscientiousness (Q = 7.21 p
CHI ’21, May 8–13, 2021, Yokohama, Japan Esterwood et al., 2021

 Fig. 3. Forest plot indicates average effect sizes (r) with personality trait as moderator

5.2.3 Gender Diversity. The technology acceptance literature has highlighted the importance of gender
differences [97]. Based on these findings we sought to determine whether there is any support for gender
differences between sample diversity in terms of personality and acceptance of robots. Results indicated
personality was only a predictor of robot acceptance in study samples with high (k=10, ¯2=0.25, 95% CI
[0.25,0.48]) and medium (k=4, ¯2=0.34, 95% CI [0.09,0.74]) levels of gender diversity. Likewise personality did
not seem to be a predictor in samples with low gender diversity (k=4, ¯2=-0.06, 95% CI [-1.00,0.83]). Specifically,
these results indicated a positive correlation between high and medium gender diversity and robot acceptance
supporting the idea that samples with more diversity in terms of gender correlate with higher robot acceptance.
See Table 8 and Figure 5.

5.2.4 Global Region. To examine the impact of the global region as a moderator, we grouped studies
according to where the samples were reportedly collected. Based on the reported information in the articles,
data have only been
 14
A Meta-Analysis of Human Personality and Robot Acceptance in Human-Robot Interaction CHI ’21, May 8–13, 2021, Yokohama, Japan

 Fig. 4. Forrest plot indicates average effect sizes (r) with age group as a moderator

 Fig. 5. Forest plot indicates average effect sizes (r) with gender diversity as a moderator

collected from Europe, Asia, Oceania, and North America. As stated, we reported only results with k ≥ 3. Results
show that when the effects sizes were divided by the sample region the effects were only significant for the
European region. Specifically, results indicate that the positive correlation between personality and robot
acceptance was only significant for studies with samples based in Europe. Based on the available data the effects
were not significant for Asia or North
 15
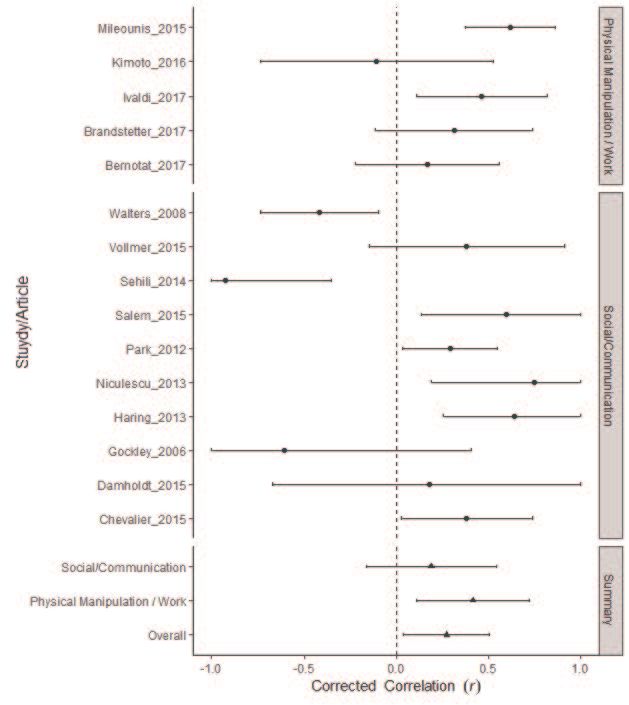
CHI ’21, May 8–13, 2021, Yokohama, Japan Esterwood et al., 2021

America. It should be noted that the relationship in the samples based in Asia approached significance unlike the
samples based in North America. Details of these results are available in Table 9 and Figure 6. There were not enough
studies to examine the impact of the global region by personality trait.

 Analysis Type Predictor Global Region Sig k N Mean_r CI_LL_95 CI_UL_95
 Overall Personality All Regions Y 18 1437 0.16 0.0559 0.3918
 Global Region 1 Personality Asia N 3 203 0.31 -0.0653 0.9338
 Global Region 2 Personality Europe Y 10 408 0.32 0.1517 0.7482
 Global Region 3 Personality North America N 5 826 0.05 -0.2233 0.3561
 Table 9. Results of Global Region as Moderator Between Human Personality and Acceptance ( ≥ 3)

 Fig. 6. Forrest plot indicates average effect sizes (r) with global region as moderator

5.2.5 Task Type. Research in HRI has found that different types of tasks are influential to human’s
perceptions of robots [40, 87]. As a result, we categorized studies according to robot task type based on the
available task descriptions in each study. Across studies the coding revealed three broadly defined task types.
The three task types were: physical manipulation tasks, influence tasks, and social interaction tasks. Physical
manipulation tasks required the robot to physically manipulate the environment or itself. For example, in [53]
the robot was asked to retrieve specified items for a participant. Influence required the robot to change the
human’s attitude or behavior. For example, in [16] the robot was tasked with persuading the participant to
select and use certain items over others. Social interaction tasks were those where the robot was required to
interact with humans with no specific goal in mind. For example, in [21] the robot was tasked with simply
conversing with the participant over lunch.
 Task type appeared to moderate the relationship between human personality and robot acceptance. As the
results show in Table 10, the data indicated a significant relationship between human personality and robot
acceptance for physical manipulation tasks but not for social interaction tasks. In terms of influence tasks,
there weren’t enough studies to warrant comparison (k=1). Specifically, these results indicate a positive
correlation between personality and
 16
A Meta-Analysis of Human Personality and Robot Acceptance in Human-Robot Interaction CHI ’21, May 8–13, 2021, Yokohama, Japan

 Analysis Type Predictor Task Type Sig k N Mean_r CI_LL_95 CI_UL_95
 Overall Personality All Task Types Y 15 702 0.19 0.0418 0.5083
 Task Type 1 Personality Physical Manipulation Y 5 233 0.3 0.1094 0.7234
 Task Type 2 Human Personality Social/Communication N 10 469 0.13 -0.1593 0.5415
 Table 10. Results of Task Type as Moderator Between Personality and Acceptance ( ≥ 3)

acceptance for studies using physical manipulation tasks. In terms of different personality traits, comparison
was not possible because no single personality trait contained all task types. Details of these results are
available in Table 10 and Figure 7.

 Fig. 7. Forrest plot indicates average effect sizes (r) with task type as a moderator

5.3 Robustness Checks
To assess the overall robustness of our meta-analytical results, we investigated the potential for publication bias
in this literature. To do this we used a funnel plot and also conducted a leave-one-out sensitivity analysis.
Next, we explain each approach in detail along with the results.

5.3.1 Publication Bias. Publication bias is the degree to which “the research that appears in the published
literature is systematically unrepresentative of the population of completed studies” [85, Pg.1]. To determine
the publication bias
 17
CHI ’21, May 8–13, 2021, Yokohama, Japan Esterwood et al., 2021

present in this meta-analysis, we used funnel plots instead of the fail-safe N or file-drawer analysis. Unlike the
funnel plots the fail-safe or file-drawer analysis methods do not “directly acknowledge the average size of, or
the variation in, effects that have been observed”[7, Pg.123]. Further, “different versions of the fail-safe N
produce very different results” [7, Pg.124] which frequently leads to misinterpretation and provides only vague
indications of publication bias [7].
 The funnel plot analysis (in Figure 8) shows that there is a greater number of studies with higher
correlation ( ) values indicating that positive correlations are published more frequently than negative
correlations. Each dot in Figure 8 represents a single study; the y-axis is the standard error of the estimate
while the x-axis is the correlation. Studies with higher power are placed closer to the top and those with lower
power are placed toward the bottom of the figure. Investigations of these plots can reveal publication bias
when the dots present (studies) group together and are found more frequently on the right (positive
correlation) side of the straight horizontal line than on the left (negative correlation) side. Based on this
study’s results, it appears that publication is biased toward stronger and positive correlations as opposed to
weaker and negative correlations. The degree of bias appears to be relatively moderate because some studies
appear in the low to no correlation range. The plot is somewhat asymmetrical, but this is not especially
pronounced. Asymmetrical groupings imply the presence of unpublished results and the stronger the
asymmetry the stronger the publication bias presented.

 Fig. 8. Funnel plot displays correlation values and standard error

5.3.2 Leave-One-Out Sensitivity Analysis. A leave-one-out sensitivity analysis was performed by iteratively
removing one study at a time and running our analysis without that study’s data. This analysis provides a sense
of robustness and assists in the identification of outliers because we can determine the impact that the
exclusion of a study has on our overall findings. Figure 9 and Table 11 present the results of this analysis.
Figure 9 presents the mean or correlation coefficient of a meta analysis conducted with the named study left
out of the analysis. The point is the mean bounded by a 95% and 80% confidence interval. The point repeats for
each study until the analysis has been run once with all but one of the studies included, for each study. A visual
inspection can determine when results shift with the exclusion of a
 18
A Meta-Analysis of Human Personality and Robot Acceptance in Human-Robot Interaction CHI ’21, May 8–13, 2021, Yokohama, Japan

given study, as was the case with MacDorman (2015) [61]. Table 11 presents these results in a numerical format
with the study left out appearing on the far left and the results of a meta analysis excluding it to the right.
 As presented in Figure 9 and Table 11, results provide evidence of one potential outlier. This study appears to be
[61] because the / ¯ℎ when this study was excluded was higher than when the majority of the other studies were
excluded. This indicates that [61] shifted our results toward a negative correlation. This shift was minimal,
however, and as a result we opted to keep [61] in our analysis.

 Study Left Out K N Mean_r Sig CI_LL_95 CI_UL_95
 Brandstetter_2017 25 1571 0.142506 Y 0.0556 0.3423
 Chevalier_2015 25 1547 0.139338 Y 0.0517 0.3364
 Rosenthal_2013 25 1570 0.136325 Y 0.0494 0.3297
 Syrdal_2006 25 1570 0.135892 Y 0.0484 0.3288
 Gockley_2006 25 1600 0.148254 Y 0.0664 0.344
 Haring_2013 25 1556 0.133781 Y 0.0485 0.3261
 Walters_2005 25 1583 0.135272 Y 0.0533 0.3254
 Niculescu_2013 25 1583 0.137699 Y 0.0518 0.3308
 Looije et al., 2010 25 1587 0.153464 Y 0.0759 0.3468
 Sehili_2014 25 1584 0.15778 Y 0.0871 0.3458
 Vollmer_2015 25 1580 0.142002 Y 0.056 0.3391
 Aly_2013 25 1590 0.137786 Y 0.0528 0.3295
 Andrist et al 25 1571 0.146088 Y 0.0612 0.3468
 Bernotat_2017 25 1564 0.145189 Y 0.0587 0.3437
 Chidambaram_2012 25 1579 0.141906 Y 0.0553 0.3397
 Conti_ 2017 25 1497 0.134706 Y 0.044 0.3318
 Damholdt_2015 25 1597 0.144527 Y 0.0597 0.343
 Ivaldi_2017 25 1555 0.137963 Y 0.0512 0.3337
 Kimoto_2016 25 1591 0.147101 Y 0.0631 0.3451
 MacDorman_2015 25 1040 0.212651 Y 0.1333 0.4567
 Park_2012 25 1491 0.139662 Y 0.0482 0.3438
 Salam_2017 25 1593 0.1444 Y 0.0593 0.343
 Salem_2015 25 1571 0.137477 Y 0.0516 0.3319
 Takayama_2009 25 1581 0.13947 Y 0.0522 0.3352
 Tapus & Mataric, 2008 25 1592 0.138437 Y 0.0556 0.3312
 Walters_2008 25 1532 0.166765 Y 0.0965 0.3612
 Table 11. Results of a leave-one-out analysis comparing results with the inclusion or exclusion of a selected study’s data.

6 DISCUSSION
The goal of the meta-analysis was to answer three overarching questions. First, does human personality predict
robot acceptance? Answer: yes, results of our study identified a strong positive relationship between the various
measures of human personality and robot acceptance. Second, are specific personality traits more or less
likely to predict robot acceptance? Answer: yes, our results show that extraversion, openness, and
agreeableness were significant predictors of robot acceptance while no such evidence was found for
conscientiousness or neuroticism (i.e. emotional stability). Third, what role do sample moderators play in this
relationship? Moderators had a strong impact on the relationship between human personality and robot
acceptance. More specifically, the relationship between human personality varied greatly by the sample’s age,
gender diversity, task type, and global region. Contributions to the literature, theoretical implications, and
study limitations are detailed next.
 19
CHI ’21, May 8–13, 2021, Yokohama, Japan Esterwood et al., 2021

 Fig. 9. Leave-one-out analysis results.

6.1 Summary of Findings
First, our results show that the more agreeable, extroverted, and open individuals are the more likely they
are to accept a robot. The results of this meta-analysis call attention to the importance of agreeableness,
extroversion, and openness on robot acceptance. Every day the importance of robots in our society increases;
therefore, the importance of identifying personality traits that are clearly linked to robot acceptance is also
increasing. However, no evidence supported the assertion that more or less neurotic or conscientious
individuals are any more or less likely to accept a robot. Nonetheless, we are forced to draw very different
conclusions from these non-significant results. For neuroticism, the non-significant relationship with
acceptance is especially pronounced. Neuroticism had a relatively large sample size and robust study count.
Conscientiousness, on the other hand, had a relatively small sample size, making results less conclusive.
Although more research is needed to understand the relationship between conscientiousness and
acceptance, it is not clear whether such additional studies are warranted for neuroticism.
 Second, human personality only significantly predicted robot acceptance in samples of people ages 18–24
years. The relationship between human personality and robot acceptance was non-significant for the other two
age groups. One way to interpret this finding is to assume that the relationship between human personality
and robot acceptance only truly exists for 18- to 24-year-olds. However, this interpretation may be flawed
when we acknowledge that the 45–64
 20
A Meta-Analysis of Human Personality and Robot Acceptance in Human-Robot Interaction CHI ’21, May 8–13, 2021, Yokohama, Japan

age group only had three studies. Yet, this is not the case for the 25–44 age group, which had twice as many
studies as either of the other two age groups. Taken together across all the age groups, it would appear that
the relationship between human personality and robot acceptance is most salient for the 18–44 age group. The
relationship appears to weaken as the sample age group increases. This finding has several implications for
future research. If these results remain consistent, personality should be used cautiously in samples of older
age groups. In other words, the older the study sample is, the less likely personality can be used to determine
whether participants are likely to accept a robot.
 Third, this meta-analysis demonstrated that human personality was only a significant predictor of robot
acceptance in samples of high and moderate levels of gender diversity. The relationship between human
personality and robot acceptance was not significant for the low-gender-diversity samples. One explanation is
that the relationship between personality and robot acceptance differs by actual gender (male vs. female) effects.
This would imply that the relationship between personality and robot acceptance would be different in mostly
male samples when compared to mostly female samples. To examine this assertion, we conducted an
additional analysis by dividing the four low-gender-diversity studies into two groups: two mostly male studies
versus two mostly female studies. However, there were no significant differences between the two groups
with regard to their relationship between personality and robot acceptance. Therefore, the non-significant
results of the low-gender-diversity sample cannot be attributed to gender (i.e., male vs. female) effects.
 Fourth, the relationship between human personality and robot acceptance was only significant in studies
done in Europe. One way to interpret this finding is that the relationship between human personality and
robot acceptance only truly exists for Europeans. However, this interpretation is flawed for several reasons.
First, this meta-analysis can only speak to the samples of studies done in Europe. This does not imply that the
sample participants themselves consisted entirely of Europeans. In fact, it is unlikely that most studies done with
college student samples did not include non-Europeans. Second, this meta-analysis did not include any
measure of culture, and assuming that our approach to categorizing the studies into various regions
represents culture is at best a crude representation and at worst a gross misrepresentation. Third, the
relationship between personality and robot acceptance trended toward significance for studies in Asia. It is
quite possible that with additional studies, this relationship would become significant. The non-significant
relationship between human personality and robot acceptance in studies done in North America was
surprising. This non-significant result was particularly profound because unlike the studies done in Asia, the
relationship in the North American samples was near zero despite having more studies than in Asia. Taken
together, the findings related to the global region indicate a need for cross-regional studies. Ultimately, the only
way to go beyond our initial finding to generalizations regarding nationality or culture is to have additional
studies done that specifically examine these issues. The results of this meta-analysis clearly highlight the need for
such studies and their potential to contribute to the literature.

6.2 Limitations & Future Research
6.2.1 Additional Studies Needed. The results of this meta-analysis highlight several gaps in the existing
literature. First, we see that there is a need for additional studies on both the Big Five personality traits as
well as other personality traits. Currently, too few studies have investigated possible moderators within each
Big Five personality trait. This made it impossible to examine moderators nested within the Big Five
personality traits. If we ever hope to examine possible moderators within each personality trait, more studies
are needed. Our study focused exclusively on the Big Five personality traits because there were simply not
enough studies on any other personality types. Although the Big Five personality traits are by far the most
used traits, other important traits should be examined. For example, the
 21
CHI ’21, May 8–13, 2021, Yokohama, Japan Esterwood et al., 2021

literature has shown that traits of dominance and honesty-humility are also important predictors of human
attitudes and behaviors [76, 78]. Therefore, additional studies are needed to expand the set of personality traits
to provide additional insights.
 Second, more studies are needed that employ people at a diverse age range. Currently, there is no
representation for the 65+ age group in the literature. Practically, when we consider that a large segment of
robotic technologies are increasingly targeting health care for those older than 65, we can begin to see an
issue with existing sampling (see:[28]). This is an issue because according to table 7, the importance of
personality on predicting robot acceptance seems to diminish by age. If this is the case, we may quickly
discover that personality is not a useful tool for determining whether individuals older than 65 will accept
robots. Therefore, understanding the relationship between personality and robot acceptance for this
population is not only under-represented but also timely and important.
 Finally, our results highlight a lack of global representation in the research being conducted on human
personality and robot acceptance. Unfortunately, personality research in HRI is not being conducted across the
globe but instead is focused on a few specific regions: Europe, Asia, and North America. According to our
results, there is now reason to solely investigate issues related to the impact of global regions in this
research area (see table 9). The lack of representation from other regions is a significant shortcoming.
Specifically, it is vital to have studies conducted in Central America and South America as well as the Middle
East, North Africa, and sub-Saharan Africa. Until this happens, we will fail to fully understand the relationship
between human personality and robot acceptance.

6.2.2 Limitations. This study is not immune to limitations. First, in utilizing the trait-based approach to
personality psychology, we are unable to account for inter and intra-subject variability in how people perceive
and relate to robots. In addition, there is ongoing debate over the exact number of and definition of each trait
examined. In being forced to look at the Big Five personality traits only, we forgo insights that might be visible
if other traits were used via scales such as the HEXACO [4] with the addition of honesty-humility or the
Eysenck Personality Questionnaire [30] which investigates psychoticism/socialisation. Furthermore, our study
focused on human personality exclusively and does not consider robot personality. We also did not examine
issues related to similarity vs. dissimilarity between human and robot personality and the effects this might
have because this was outside the scope of our exclusive focus on human personality (see: [81] and [82] for a
discussion on the topic). Finally, there is more than one approach to take when considering personality
psychology and the HRI literature’s emphasis on the trait-based approach overlooks these other schools of
thought. Future researchers might wish to adopt other approaches based on, for example, psycho-dynamic or
cognitive/social learning perspectives on the subject of human personality.

7 CONCLUSION
This study presents the findings of a meta-analysis on the relationship between human personality and robot
acceptance. The results of the study were insightful but produced more questions than answers. This study is an
important starting point in our understanding of the relationship between human personality and robot
acceptance. Nonetheless, future research is needed to build on these findings and attempt to answer the new
questions proposed. Answering these questions will22expand our understanding in both an important and
much understudied area in the HRI literature.

REFERENCES
[1] Gordon Willard Allport. 1937. Personality: A psychological interpretation. (1937).
[2] Amir Aly and Adriana Tapus. 2013. A model for synthesizing a combined verbal and nonverbal behavior based on personality traits in human-robot
 interaction. In 2013 8th ACM/IEEE International Conference on Human-Robot Interaction (HRI). IEEE, 325–332.
You can also read