Network and synaptic mechanisms underlying high frequency oscillations in the rat and cat olfactory bulb under ketamine xylazine anesthesia - Nature
←
→
Page content transcription
If your browser does not render page correctly, please read the page content below
www.nature.com/scientificreports
OPEN Network and synaptic
mechanisms underlying
high frequency oscillations
in the rat and cat olfactory
bulb under ketamine‑xylazine
anesthesia
Władysław Średniawa1,2, Jacek Wróbel1, Ewa Kublik1, Daniel Krzysztof Wójcik1,3,
Miles Adrian Whittington4 & Mark Jeremy Hunt1,4*
Wake-related ketamine-dependent high frequency oscillations (HFO) can be recorded in local field
potentials (LFP) from cortical and subcortical regions in rodents. The mechanisms underlying their
generation and occurrence in higher mammals are unclear. Unfortunately, anesthetic doses of pure
ketamine attenuate HFO, which has precluded their investigation under anesthesia. Here, we show
ketamine-xylazine (KX) anesthesia is associated with a prominent 80–130 Hz rhythm in the olfactory
bulb (OB) of rats, whereas 30–65 Hz gamma power is diminished. Simultaneous LFP and thermocouple
recordings revealed the 80–130 Hz rhythm was dependent on nasal respiration. This rhythm persisted
despite surgical excision of the piriform cortex. Silicon probes spanning the dorsoventral aspect
of the OB revealed this rhythm was strongest in ventral areas and associated with microcurrent
sources about the mitral layer. Pharmacological microinfusion studies revealed dependency on
excitatory-inhibitory synaptic activity, but not gap junctions. Finally, a similar rhythm occurred in
the OB of KX-anesthetized cats, which shared key features with our rodent studies. We conclude
that the activity we report here is driven by nasal airflow, local excitatory-inhibitory interactions,
and conserved in higher mammals. Additionally, KX anesthesia is a convenient model to investigate
further the mechanisms underlying wake-related ketamine-dependent HFO.
Local field potential (LFP) oscillations reflect synchronous activity of neuronal assemblies and are thought to
play a crucial role in information processing1,2. Recent years have witnessed a surge of interest in high frequency
oscillations (HFO, >100 Hz), also known as ripples, considered important for their roles in health and d isease3,4.
HFO have been investigated most notably in the rodent hippocampus, but are also found in diverse cortical, olfac-
tory and limbic areas5–7, where they have been linked to near-death states8, seizures9, Parkinson’s disease10, and
models of psychoses11. Collectively, these results point to regional and state dependent mechanisms underlying
different types of HFO generation in the brain.
N-methyl-D-aspartate receptors (NMDAR) are expressed widely in the CNS, and are well-known to be
involved in learning and memory p rocesses12. It is well-documented, that, at subanesthetic doses, ketamine
(and related NMDAR antagonists) increases the HFO power in many cortical and subcortical areas. These
studies have been carried out almost exclusively in freely moving rodents, and have addressed several aspects
including the neuroatomical profile, dose-dependency, cross frequency coupling, and relationships with overt
behaviour11,13–25. We recently provided evidence that the olfactory bulb (OB) is a strong generator of HFO in
ose26. The OB appears to have a particularly privileged position since it can impose
rodents after a subanesthetic d
both fast and slow oscillatory activity in distant r egions27. Indeed, bursts of ketamine-dependent HFO tightly
1
Nencki Institute of Experimental Biology of Polish Academy of Sciences, 3 Pasteur Street, 02‑093 Warsaw,
Poland. 2University of Warsaw, Faculty of Biology, Miecznikowa 1, 02‑096 Warsaw, Poland. 3Faculty of
Management and Social Communication, Jagiellonian University, 30‑348 Cracow, Poland. 4University of York,
Heslington, NY YO10 5DD, United Kingdom. *email: m.hunt@nencki.edu.pl
Scientific Reports | (2021) 11:6390 | https://doi.org/10.1038/s41598-021-85705-5 1
Vol.:(0123456789)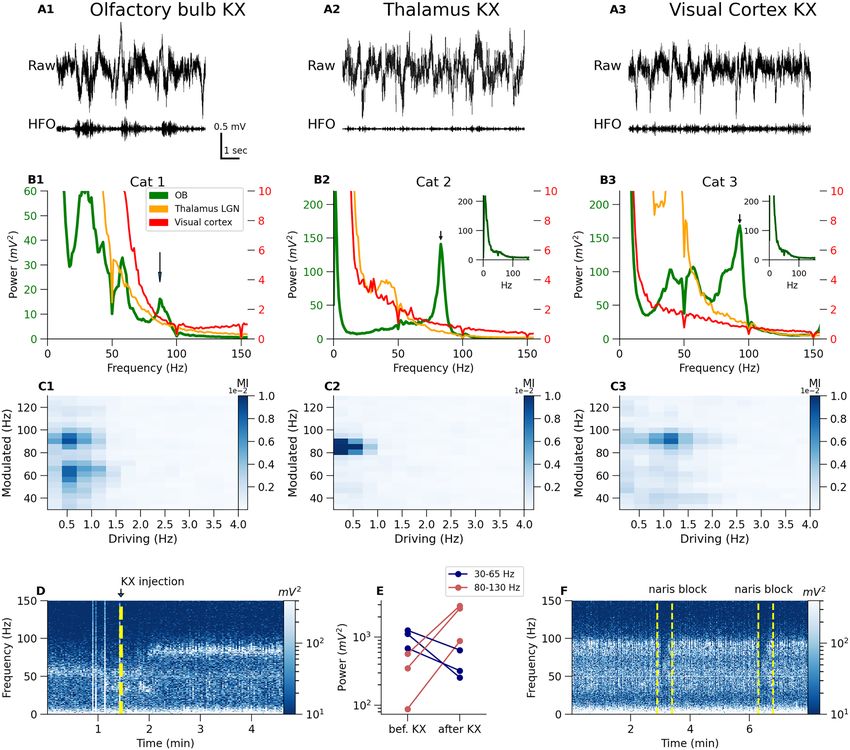
www.nature.com/scientificreports/
couple to nasal respiration, and naris blockade reduces HFO power locally within the OB, and in the ventral
striatum and prefrontal cortex25. However, there remain important gaps in our understanding, perhaps most
notably, which networks and synaptic mechanisms underlie this type of HFO, and does a comparable rhythm
occur in higher mammals.
Anesthetized states can provide distinct advantages when studying fundamental oscillatory networks in the
OB, since core neural networks along with respiration are spared, whilst behavioural confounds are removed.
Unfortunately, at anesthetic doses (150–200 mg/kg), ketamine attenuates HFO power in r ats11,28 which is followed
by rebound increases in HFO power associated with the recovery phase. Many other anesthetics (pentobarbital,
isoflurane, urethane and chloral hydrate) also attenuate ketamine-dependent HFO24,29 but s ee30 for fentanyl,
severely limiting the methods available to experimentally investigate this rhythm. Notably, when combined
with the sedative, xylazine, ketamine can be administered at lower doses, and this mixture is routinely used for
animal anesthesia. Although anesthesia generally reduces the p ower31, and frequency32 of fast oscillations, there
is some evidence that HFO can be observed under ketamine-xylazine (KX)33,34. It is unknown if this activity is
related to ketamine-dependent HFO recorded during waking, or to classical gamma activity. Given the above
we developed the following workflow; we firstly tested the hypothesis that ketamine-dependent HFO and fast
oscillations recorded under KX are related. We then probed the potential mechanisms of HFO rhythmogenesis,
using a variety of experimental techniques, including simultaneous LFP/thermocouple recordings, current source
density analyses, local pharmacological microinfusion studies, and surgical excision of major afferent input.
Finally, to determine the potential translatablility of our findings to higher mammals we examined if a similar
rhythm could be recorded in KX anesthetized cats.
Results
KX and subanesthetic ketamine both reduce gamma power (30–65 Hz) but increase the power
of faster rhythms.. Subanesthetic ketamine (Fig. 1A–D): Intraperitoneal injection of ketamine (25 mg/
kg) produced an immediate and substantial increase in HFO (152.37 ± 10.21 Hz, p = 0.0015, Friedman test
(F-stat = 13.0) with Nemenyi post-hoc: p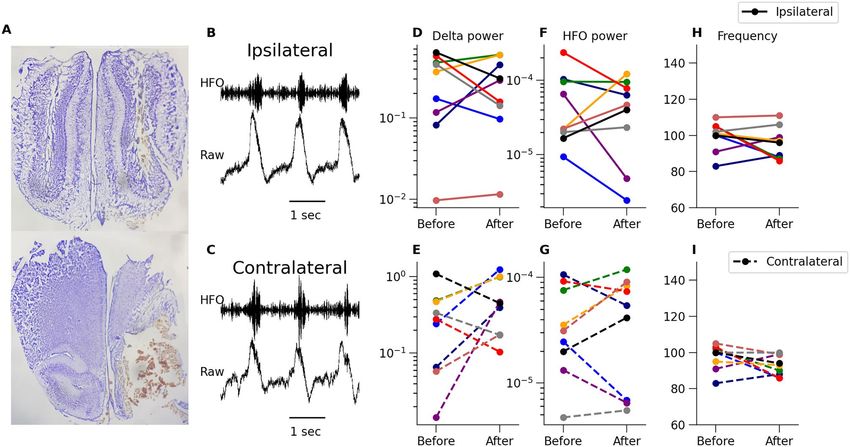
www.nature.com/scientificreports/

                                  Figure 1.  Effect of ketamine (subanesthetic and anesthetic doses) and KX anesthesia on 30–65 Hz and 100–180
                                  Hz oscillations in the rat OB. First row (A–D) presents results for subanesthetic ketamine 25 mg/kg, second
                                  row (E–I) for ketamine 100 mg/kg + xylazine 10 mg/kg (KX) anesthesia and third row for anesthetic dose of
                                  ketamine 200 mg/kg. First column (A,E,J): Example spectrograms computed from the OB before and after
                                  injection. Dotted line at t = 0 is injection time. Second column (B,F,K): Example raw waveform (bottom) and
                                  filtered signal in HFO band 100–180 Hz (top). Third column (C,G,L): Extracted data from spectrograms of
                                  the power of dominant frequency for 30–65 Hz and 100–180 Hz activity (mean across rats n = 8). The column
                                  (D,H,M): Individual traces of HFO and gamma power taken from three time points (marked with grey bars
                                  in C,G,L plots). Both subanesthetic ketamine and KX administration reduced gamma power and substantially
                                  increased HFO power (*p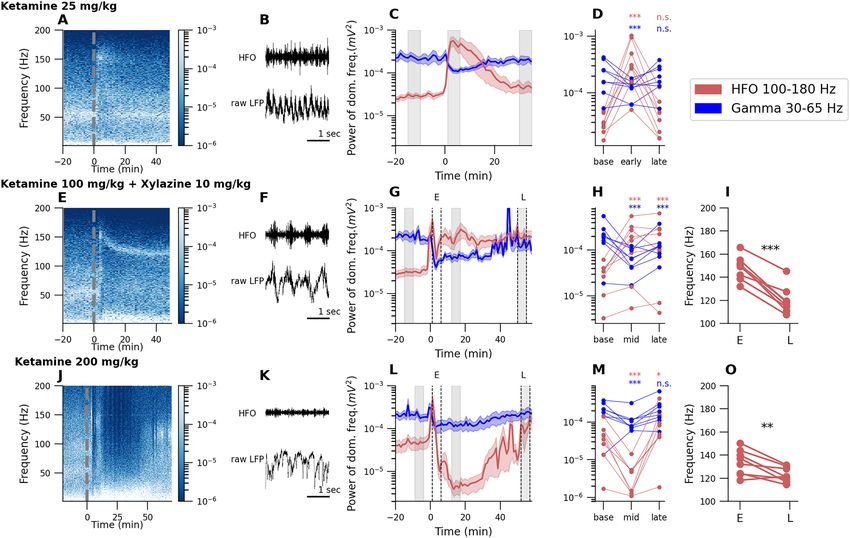
www.nature.com/scientificreports/

                                            Figure 2.  Nasal respiration modulates KX-dependent 80–130 Hz oscillations in the OB of anesthetized rats.
                                            (A) Spectrogram computed from ipsilateral and contralateral to the naris blockade OB channels. Dotted lines
                                            relate to naris blockade time. (B) Extracted data from spectrogram of power of dominant frequency in 80–130
                                            Hz range (average across rats n = 8). Unilateral naris blockade reduced 80–130 Hz power on the ipsilateral
                                            side but increased 80–130 Hz power contralateral to blockade. Values from individual rats are shown in (C).
                                            (D) Simultaneous OB LFP and respiratory rhythm recorded using thermocouples. (E) Example recordings of
                                            simultaneous OB LFP for delta (0.3–3 Hz) and the 80–130 Hz rhythm. Arrows show respiratory cycle phase.
                                            (F) Phase plot of the peak of the burst of KX 80–130 Hz activity relative to delta peak (phase zero). Each radius
                                            represents ITPC (see "Methods") of one rat. (G) Waveform correlation scores calculated for 5 min for respiration
                                            rhythm and OB LFP delta (first box plot), delta and the envelope of 80–130 activity (second box plot), and
                                            respiration rhythm and OB LFP delta (third box plot). Box plots show first to third quartile of the correlation
                                            scores, median (orange line) and all data range of n = 8 rats (error bars). (H) Modulation index matrix (averaged
                                            across rats n = 8) for 5 min of continuous LFP signal under KX anesthesia. (I) Resampling (across rats) statistics
                                            for modulation index “pixels”. Control group for resampling were rats under isoflurane anesthesia (**p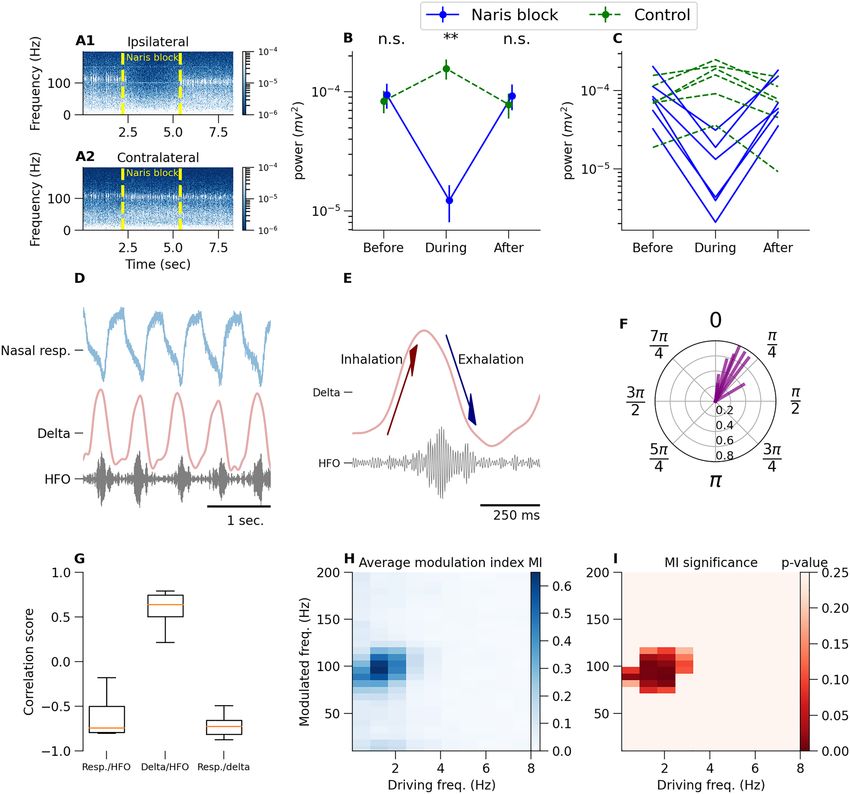
www.nature.com/scientificreports/

                                  Figure 3.  Depth profile of KX-dependent 80–130 Hz oscillations in the rat OB using 32 channel linear silicon
                                  probes. Results presented in (A–D) were obtained using 3.2 mm electrodes with 100 μm inter-electrode
                                  distance. (A) Histology illustration based on n = 6 rats OB staining. (B) Example raw LFP from 32 channels
                                  (y axis). Colorbar scale is in mV. (C) Depth profile of 80–180 Hz power from all 32 channels. Power decreases
                                  around mitral layer. x-scale is in mV 2 (D) Phase of 80–130 Hz oscillations which changes phase around
                                  mitral layer. Delta changes phase below the mitral. x-scale is in degrees. Results presented in (E–H) were
                                  obtained using 32 channel electrodes with an intercontact distance of 20 μm, and spanning 0.64 mm. Analyses
                                  for this data are the same as in (A–D) (n = 8). Results presented from (I–K) shows CSD analysis for 20 μm
                                  spacing electrode. (I) raw example CSD. (J) CSD filtered in 0.3–3 Hz band. Plots were then aligned in respect
                                  to the histology and averaged across rats n = 8. (K) CSD filtered in 80–130 Hz band (L) Average correlation
                                  plot between of local HFO and MUA density (n = 4). grn granule layer, EPL extraplexiform layer and glom.
                                  glomerulur layer.

                                  and temporal profiles of changes in membrane current, underlying the field potential (see "Methods" for compu-
                                  tational details). In the raw signal, triggered on 80–130 Hz oscillatory events, we found dipole-like spatiotemporal
                                  profiles across the mitral and granule cell layers (Fig. 3I). CSD reconstruction (average for n = 8) was filtered
                                  for slow frequencies (0.3–3 Hz) and we observed dipole-like structure that propagates from glomerular layer,

Scientific Reports |   (2021) 11:6390 |                https://doi.org/10.1038/s41598-021-85705-5                                                   5

                                                                                                                                               Vol.:(0123456789)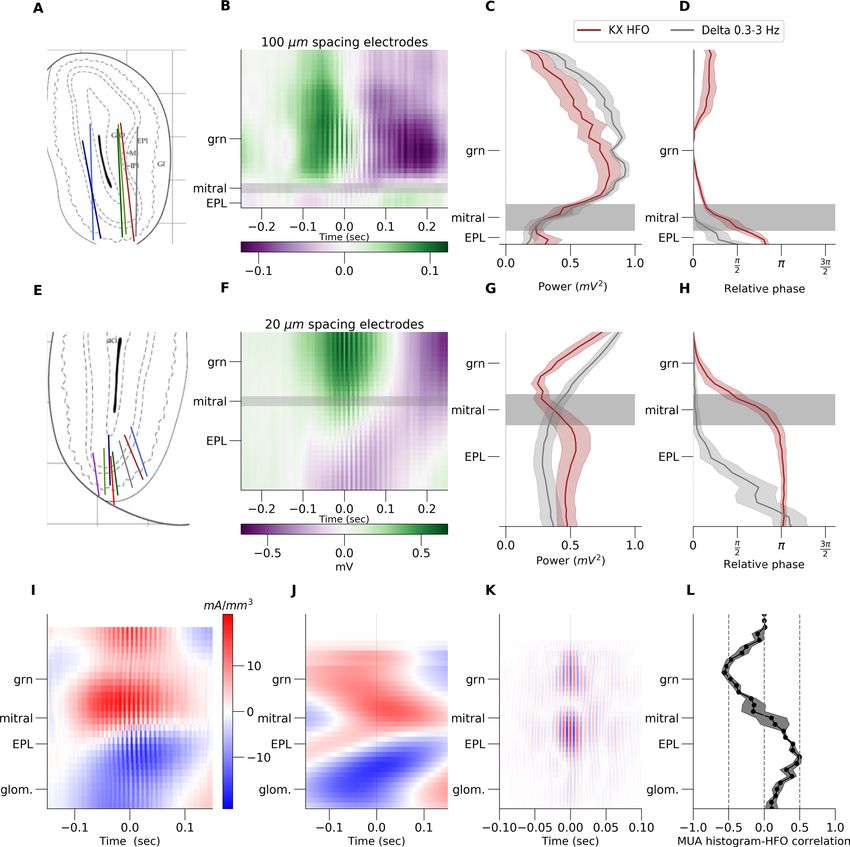
www.nature.com/scientificreports/
before emergence of 80–130 Hz activity, to EPL layer as the 80–130 Hz power rises in time (Fig. 3J). We next
filtered the CSD in the 80–130 Hz band and found strong dipoles around the mitral layer (Fig. 3K average across
8 rats). Individual traces from time point zero, from all rats, showing delta and 80–130 Hz dipoles are presented
in supplementary Fig. Supplementary S3, respectively. Analysis of the Multi Unit Activity (MUA >500 Hz LFP
oscillations) shows that 80–130 Hz oscillations are driven by local spiking of the mitral/tufted cells (Fig. 3L).
Correlation computed between local 80–130 Hz activity and envelope of multiunit density (see "Methods") show
that spikes does not change phase together with 80–130 Hz—spikes occur in a trough of the oscillation around
mitral cell layer.
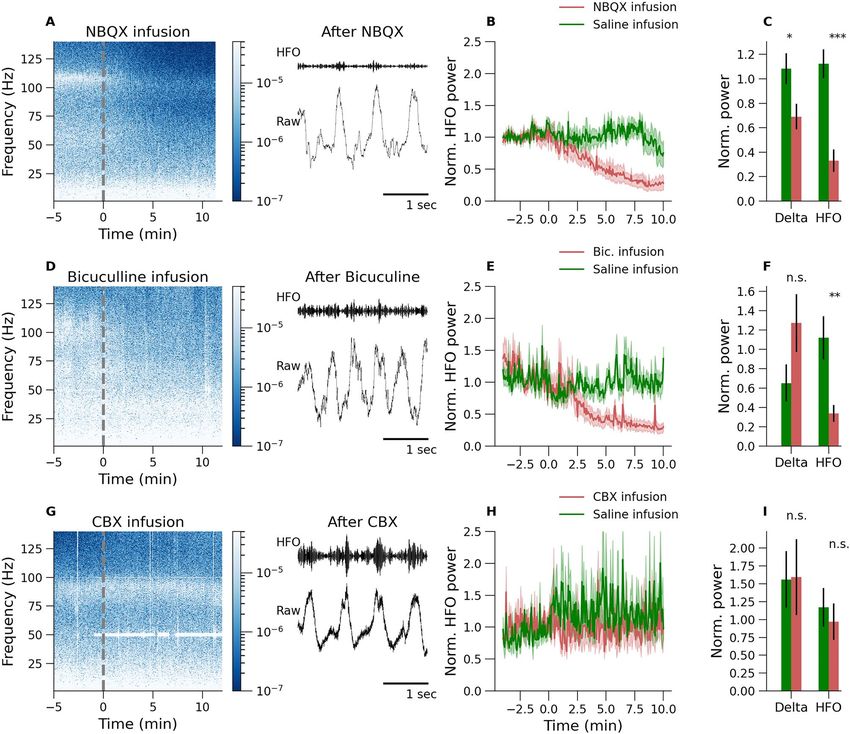
Blockade of GABA‑A and AMPA but not gap junctions disrupts KX‑dependent 80–130 Hz oscil‑
lations.. Excitation, inhibition and gap junctions can all underlie mechanisms of fast oscillatory activity
in the b rain33. To unveil the receptor mechanisms generating 80–130 Hz under KX, we carried out a series of
pharmacological experiments using unilateral infusion of bicuculline, NBQX, or carbenoxolone (0.5 μl) (Fig. 4).
In the presence of KX, the effect of bicuculline was rapid with potent reductions in 80–130 Hz power being vis-
ible in many cases during the infusion (saline vs bicuculline, p = 0.0053, one-way ANOVA, n = 5). By contrast,
slow delta oscillations in the OB, largely dependent on respiration, remained clear in the raw signal up to 20
min post infusion and the absolute power of delta was not affected by drug infusion (Fig. 4A–F) (saline vs bicu-
culline, p = 0.098, one-way ANOVA, n = 5). NBQX infusion also reduced 80–130 Hz power (saline vs NBQX,
p = 0.00011, one-way ANOVA, n = 7), however, in about half the rats we observed a delayed reduction in the
amplitude of slow oscillations but this was well after effects on 80–130 Hz activity occurred (saline vs NBQX,
p = 0.012, one-way ANOVA, n = 7). Thus, reductions in 80–130 Hz activity post NBQX were unlikely to be
due to reduced sensory input, but rather due to AMPA blockade within the OB circuitry. These findings sup-
port a role for both GABA-A and AMPA receptors in the generation of the 80–130 Hz oscillation we recorded.
Carbenoxolone did not affect 80–130 Hz activity (saline vs carbenoxolone, p = 0.54, one-way ANOVA, n = 4).
Neither delta oscillations were affected (saline vs carbenoxolone, p = 0.96, one-way ANOVA, n = 4) (Fig. 4G–I).
Thus, most probably, gap junction connections do not play a role in 80–130 Hz rhythm generation.
Removal of piriform and surrounding regions do not disrupt KX‑dependent 80–130 Hz oscil‑
lations.. The piriform cortex is a major downstream structure for OB projections. Pyramidal neurons of the
piriform cortex also send dense projection back to OB38,39 which have been proposed to control the gain of OB
activity40. This prompted us to examine the potential role of the piriform cortex, and surrounding regions, on
80–130 Hz activity recorded in the OB. Under KX anesthesia, whilst recording OB LFPs, we gradually removed
cortical tissue, starting laterally and moving medially. We did this until the base of the skull was exposed to
ensure that a large amount of the piriform cortex has been extracted (Fig. 5A). Example raw LFP and 80–130
Hz (HFO) filtered signals recorded after extraction are presented in Fig. 5B,C. Comparison of LFP oscillations
from the dissected vs. intact side had similar power of delta (Fig. 5D,E, p = 0.22 and p = 0.77, both Student’s
paired t-test, n = 9) and 80–130 Hz activity (Fig. 5F,G, p = 0.5 (Student’s paired t-test) and p = 0.68 (Wilcoxon
test), n = 9). There was also no significant change in the frequency of this rhythm after excision of brain tissue
(Fig. 5H,I, p = 0.25 and p = 0.12, both Student’s paired t-test, n = 9). We did not dissect right up to the midline
due to the presence of major vessels. However, in four rats the anterior commissure (which carries centrifugal
fibers to the OB) and olfactory tubercle was also partially or fully transected, which did not markedly influence
oscillatory activity recorded in the OB. We were not able to dissect to the midline due to the presence of the
anterior cerebral artery, which is necessary for circulation of blood to the OB and other anterior brain regions.
Unexpectedly, on occasions when this vessel was punctured we observed a transient increase in 80–130 Hz
activity followed by attenuated activity. We do not currently understand this hemodynamic effect but suspect it
is associated with anoxia, and appears in line with another study showing cardiovascular arrest also induced a
transient burst of fast oscillatory activity8.
KX‑dependent 80–130 Hz oscillations are present in the OB, but not thalamus or visual cortex
in cats.. A fundamental issue when examining drug-related brain activity is whether similar electrophysi-
ological signatures are present in higher mammals. We therefore extended our studies to include cats (n = 3)
recording simultaneously from the OB, the lateral geniculate nucleus (LGN) of the thalamus, and from the visual
cortex (Fig. 6A1–A3). A ∼ 90 Hz oscillation was recorded in the OB of two cats under KX anesthesia (Fig. 6B2–
B3) which occurred as discrete bursts (Fig. 6A1). In the cat with weak 90 Hz power (cat 1) histology revealed
electrode placement at the edge of the OB which was associated with fast activity of comparable frequency but
of much smaller power (Fig. 6B1). For histology see Fig. Supplementary S4. KX fast oscillations were not clearly
visible in thalamus or visual cortices, demonstrating certain neuroanataomical selectivity to the OB. In line with
our previous findings that ketamine-dependent HFO can be attenuated by various types of a nesthesia29, we
found that propofol (administered at the end of the KX study) also attenuated fast oscillations associated with
KX in two cats (Fig. 6B2 and B3 insert).
Modulation index for the OB LFPs of each cat is shown (Fig. 6C1–C3), see "Methods" for computational
details. The fast rhythm under KX was coupled to local slow oscillations in OB (strong blue spot around 1 Hz–90
Hz pixel).
KX was infused intravenously at a rate of 0.2 ml every 20 min which provided a window to determine any
electrophysiological changes just after administration of KX. Prior to administration, gamma ∼ 60 Hz oscillations
were present in the OB, then immediately after infusion a clear 90 Hz oscillation was visible (Fig. 6D). This effect
was reproducible across several infusions (Fig. 6E) and no clear impact of infusion was seen in the thalamus
or visual cortex (Fig. Supplementary S5 A and B). Nasal respiration is known to drive fast and slow oscillations
Scientific Reports | (2021) 11:6390 | https://doi.org/10.1038/s41598-021-85705-5 6
Vol:.(1234567890)www.nature.com/scientificreports/
Figure 4. KX-dependent 80–130 Hz activity is AMPA dependent (A–C) and GABA-A dependent (D–F) but
independent of gap junctions (G–I). Drugs were infused to unilaterally, and saline infused on the opposite side.
Examples of the time courses (dotted line indicates the moment of infusion) and short 3 s data epochs of the
raw and 80–130 Hz band pass-filtered waveforms are shown. (A–C) shows results for NBQX local infusion to
the OB which caused a significant reduction in power of the 80–130 Hz oscillations and a smaller but significant
effect for delta (C, n = 7). GABA-A receptor blockade with bicuculline infusion also reduced 80–130 Hz power
without significantly affecting delta power (D–F, n = 5). Gap junction blockage with carbenoxolone had no
significant effect on the 80–130 Hz rhythm, nor delta power (G–I, n = 4). (*pwww.nature.com/scientificreports/
Figure 5. KX-dependent 80–130 Hz oscillations in the rat OB is not dependent on piriform input. (A) Example
histology of a rat in which we removed the piriform cortex and surrounding areas. (B,C) Example waveforms on
the ipsilateral and contralateral side after the surgical excision, top waveform was filtered in the 80–130 Hz band.
(D–I) We did not observe any significant differences after tissue removal in power of delta (D ipsilateral and E
contralateral side), power of the 80–130 Hz band (F ipsilateral and G contralateral side) or dominant frequency
of the 80–130 Hz rhythm (H ipsilateral and I contralateral side) (n = 9). Each experimental rat is shown with a
different color, the same for ipsilateral and contralateral side.
we mapped, almost entirely, the dorsal-ventral aspect of the rat OB. The 80–130 Hz rhythm was progressively
larger in amplitude in mid-ventral areas of the OB. Axonal projections of mitral/tufted cells are highly spatially
localized, whereby axons of cells in the ventral OB travel through ventral regions of the granule layer to the
olfactory tract44,45. CSD analyses, revealed the presence of two spatially and temporally distinct current dipoles.
A sink, around 1 Hz, which followed the breathing cycle, was localized close to the EPL layer and a faster 80–130
Hz microcurrent dipole was found closer to the mitral layer. Current sinks indicate flow of the positive ions
(i.e., potassium, calcium) into neurons46,47. Stimulation of the olfactory nerve to mimic afferent input, generates
a sink in the glomerular and EPL layers41,48 and induces slow spontaneous 0.5–5 Hz rhythms49 consistent with
respiratory drive. We also found that KX mitral/tufted neurons fire in phase with 80–130 Hz, consistent with
a previous finding under KX reporting mitral/tufted firing over 100 Hz and associated with inhalation/exhala-
tion transitions50. Our previous work in freely moving rats given a subanesthetic dose of ketamine also showed
spiking phase locked to a fast 130–180 Hz a ctivity26.
The OB receives excitatory and modulatory input from the piriform cortex and centrifugal fi bers38,51. How-
ever, these projections do not appear to make a significant contribution to the 80–130 Hz rhythm since it per-
sisted even when large amounts of the piriform and commissural areas were removed. Notably, slow respiratory
rhythms were also preserved confirming the primary drive of this activity was likely from nasal input. These
inputs are not essential for gamma oscillations in the O B41 indicating 80–130 Hz oscillations, like gamma, are
generated within by the intrinsic circuitry of the OB.
Fast oscillations typically require interplay between excitatory and inhibitory t ransmission3. Within the OB
fast oscillations can be generated through glutamatergic release by mitral cell dendrites onto granule cell spines
and reciprocal GABA release to locally inhibit depolarization s pread52. In an attempt to look at potential recep-
tor mechanisms within the OB we carried out a series of unilateral microinfusion studies. We showed that the
KX 80–130 Hz rhythm was dependent on both inhibitory (GABA-A antagonist; bicuculline) and excitatory
components (AMPA antagonist; NBQX). However, gap junctions, which can also underlie both physiological
and pathological fast rhythmogenesis53 and are expressed by mitral c ells54, were not implicated in this rhythm.
Although oscillations are often investigated in single isolated bands, important inter-band interactions can
underlie rhythmogenesis in the brain. In our rat and cat studies we observed a rapid switch from classical 30–60
Hz gamma to faster 80–130 Hz activity Figs. 1 and 6 D and E. With respect to gamma, Lepousez and LLedo have
shown previously that local NMDA blockade in the OB reduces gamma power in mice35, but did not report on
activity > 100 Hz activity. There are certain mechanistic similarities between gamma35 and the HFO rhythm we
recorded in the OB. Both oscillations are reduced by AMPA blockade, and gap junctions blockade was without
effect. GABA-A blockade at high doses initially suppresses gamma power followed by a rebound increase in
low-gamma power around 30 min later (in our study, we did not record for < 30 min). However, at least in the
OB, there appears to be a fundamental distinction in the generation of gamma and ketamine-dependent HFO;
Scientific Reports | (2021) 11:6390 | https://doi.org/10.1038/s41598-021-85705-5 8
Vol:.(1234567890)www.nature.com/scientificreports/
Figure 6. KX-dependent 80–130 Hz oscillations occur in the OB, but not thalamus or visual cortex of cats. (A)
Example raw waveforms from one cat from three different brain regions. Raw signal is presented in top rows
and 80–130 filtered signal is in bottom row. (B) Power spectrum from 10 min of recordings. We observed ∼ 90
Hz distinct band in OB power spectra of all three cats (indicated on the power spectra by an arrow). In one cat
with an electrode in the posterior OB the power of this rhythm was smaller (cat 1). There was no clear peak in
the power spectra corresponding to this activity in the thalamus or visual cortex. There is separate y-scale for
OB power (green, left) and for thalamus and visual cortex (red, right). Propofol anesthesia attenuated 80–130 Hz
activity in the OB (insets, cat 2 and cat 3). (C) Modulation index score computed from single OB channels for all
three cats. Color strength of the ’pixel’ represents power of the modulation for a given slow (driving frequency)
and fast (modulated frequency) oscillation extracted from the raw signal. (D,E) show the rapid effect on OB
oscillatory activity after supplementary infusion of KX, associated with increased power of the 80–130 Hz band
with parallel decrease of the power of 30–65 Hz activity. The same phenomena were observed in rats; compare
Fig. 1. (F) shows the effect of unilateral naris blockade of a cat which was associated with a reduction in 80–130
Hz power.
gamma (both high and low) requires activation of NMDAR, whereas HFO in the OB requires blockade of these
receptors55.
Modeling studies have shown that granule cell excitability can control the frequency of OB network
oscillations56. Under ketamine, reciprocal granule-mitral communication would be suppressed since NMDA
receptors are necessary for Ca2+ influx and subsequent GABA release52,57. Thus, other excitatory-inhibitory
networks would be predicted to underlie the generation of the ketamine-dependent fast rhythm we report here.
There is an abundance of other types of inhibitory interneurons within the OB which can shape mitral/tufted
cells behavior58. How might such fast oscillations be achieved in the OB? Clues may be found in other areas
known to generate both gamma and faster oscillations. A good example is the hippocampus, where inhibitory
Scientific Reports | (2021) 11:6390 | https://doi.org/10.1038/s41598-021-85705-5 9
Vol.:(0123456789)www.nature.com/scientificreports/
parvalbumin (PV)-positive basket cells generate a ripple frequency. PV positive interneurons have been identi-
fied in the EPL layer of the OB, morphologically similar to basket c ells59, which make reciprocal contacts the
perisomatic region of mitral c ells60. In the OB, as elsewhere in the brain, PV interneurons are fast s piking61. In
the OB, these cells can fire around 170 Hz, and are modulated by r espiration62. They are thought to mediate
broad lateral inhibition since they receive input and inhibit mitral cells along their long secondary d endrites63.
Importantly, excitation of PV-positive interneurons by mitral cells is chiefly mediated by AMPA receptors, with
only a weak contribution by NMDA receptors62. Although PV-positive cells innervate mitral cells more densely
than granule cells, very little is known about the capacity of this network to generate oscillations. Given the
precedent that these cells can generate fast rhythms (>100 Hz)62, we suggest that the movement of air across
nasal mechanoreceptors stimulates the olfactory nerve, would depolarizes mitral cells to induce burst firing in
PV cells, which generating the reciprocal excitation-inhibition based rhythm recorded here. This network may
be relatively weak in the drug-free state (where mitral-granule dendrodendritic interactions prevail), but in the
presence of ketamine, reduced inhibitory tone at granule-mitral cell synapses57 may permit other networks (e.g.
mitral-PV) and associated rhythms to emerge.
Fast oscillations produced by KX (80–130 Hz) and those occurring in freely moving rats after low-dose
ketamine (130–180 Hz) shared certain similarities. For example, (1) both oscillations occurred in bursts nested
towards the peaks of slower rhythms; (2) both rhythms reversed phase in the vicinity of the mitral layer; (3) nasal
airflow drives fast oscillations under KX (shown here) and subanesthetic ketamine in freely moving r ats25. We
also observed certain differences, the frequency was notably slower under KX anesthesia. Although anesthesia
tends to attenuate most activity > 40 Hz there are some examples of ripple frequencies recorded under anesthesia;
for example, Ylinen reported that under urethane and ketamine anesthesia the frequency of ripples was slower
(100–120 Hz) than in the awake rat (180–200 Hz)32. Additionally, Neville and Haberly also reported that the
frequency of discrete gamma and beta oscillatory bands is slower under urethane that the corresponding oscil-
lations in awake r ats41. Finally, we have shown previously, the frequency of ketamine-dependent HFO can drop
by as much as 80 Hz after antipsychotic injection64, thus this band is highly dynamic and capable of relatively
large frequency fluctuations. We also found the power was weaker under KX, versus the subanethetic doses of
ketamine in the awake state, which is almost certainly arousal-related and associated with changes in functional
brain connectivity under anesthesia.
To our knowledge, almost all previous reports of ketamine-dependent HFO have focused on freely moving
rodents65. These studies (and also the current paper) show this type of HFO is visible as a clear bump in the
power spectra. There is some evidence broadband HFO can be recorded in magnetoencephalography recordings
in humans after subanesthetic k etamine66. Our finding, that under KX anesthesia, similar fast rhythms occurred
in both rats and cats, suggests that this activity may be conserved in other higher-order mammals. However,
further studies are warranted to confirm if this is a fundamental effect of ketamine on mammalian networks,
and potential relevance to the psychotomimetic and antidepressant properties of this drug.
Methods
Surgery and chronic recordings. All experiments were conducted in accordance with the European
community guidelines on the Care and Use of Laboratory Animals (2010/63/EU) and approved by the 1st Local
Ethics Committee for Animal Experiments in Warsaw, Poland. Thirty male Wistar rats (250–350 g) were used
in this study. In 8 rats, tungsten electrodes (125 μm, Science Products, Germany) were implanted bilaterally in
OB (AP+7.5, ML = +0.5, DV = 3–3.5 mm). LFP recordings were carried out before and after injection intra-
peritoneal of ketamine 25 mg/kg, and anesthetic doses of ketamine 100 mg/kg + xylazine 10 mg/kg (KX), and
ketamine 200 mg/kg with 3–4 days separating each recording session. Under KX anesthesia the left or right naris
was occluded using a soft piece of silicon rubber to block nasal respiration. At the end of the experiments the
rats were killed by a lethal dose of pentobarbital. The brains were post-fixed in 4% paraformaldehyde solution.
Brains were dissected and placed in a 10% followed by 30% sucrose solution for 2–4 days. Electrode locations
were determined on 40 μm Cresyl violet (Sigma, UK) or Hoechst (Sigma, UK) stained sections.
Thermocouple and LFP recordings. For acute studies, eight rats were initially anesthetized using iso-
flurane during which time electrodes were implanted in the OB and thermocouples in the frontal recess of
the naris on the ipsilateral side. When electrodes were in place isoflurane anesthesia was replaced with KX by
gradual injection of the cocktail and removal of isoflurane. Initial isoflurane exposure was necessary due to well-
documented variable surgical plane anesthetic responses in rats compared to KX a lone67.
Silicon probe recordings. A total of 14 rats were used for spatial mapping of oscillatory activity in the
rodent OB. Rats were prepared for acute recordings as described above. Recordings were carried out in the OB
using 32-channel silicon probes Edge-10mm–100–177 (n = 6 rats, Neuronexus) and Edge-10mm–20–177 (n = 8
rats). The electrodes were separated by an interelectrode distance of 100 (long probe) and 20 μm (short probe).
Prior to recording electrodes were dipped in a 5% solution of DIi (Sigma) dissolved in DMSO (Sigma). The track
of the electrode was visualized using a fluorescent microscope.
Local drug infusion. Rats were initially anesthetized using isoflurane and implanted with a guide-electrode
complex in the left and right OB. Following implantation, isoflurane was substituted for KX anesthesia (see
above for further information). LFPs were recorded bilaterally and when a stable fast oscillation was visible
(80–130 Hz). NBQX (2 μg, Sigma, n = 7), Bicuculline methiodide (0.05 μg, Sigma, n = 5) and Carbenoxolone
disodium salt (1 μg, Sigma, n = 4) were infused into the bulb. Saline was infused to the opposite bulb. For infu-
sion, internal cannulae (28 gauge, Bilaney) that extended 2 mm below the tip of the guides were inserted for 60
Scientific Reports | (2021) 11:6390 | https://doi.org/10.1038/s41598-021-85705-5 10
Vol:.(1234567890)www.nature.com/scientificreports/
s followed by 60 s infusion of NBQX, bicuculline, CBX or saline (volume 0.5 μl). Rats were recorded for up to
30 min post infusion.
Dissection of brain tissue. Rats were initially anesthetized by isoflurane for implantation of electrodes in
the left and right OB. Following removal of the overlying skull isoflurane anesthesia was replaced by KX. Under
stable KX anesthesia we drilled the perimeter of a large cranial window approx. 7 mm × 7 mm (left hemisphere)
from the midline to the lateral edge of the skull and removed the overlying bone. The exposed brain was dis-
sected (using aspiration and a scalpel) in a lateral-medial direction until the base of the skull had been reached.
LFPs from the left and right OB were recorded prior to and immediately after dissection.
Cat experiments. All experiments were conducted in accordance with the European community guide-
lines on the Care and Use of Laboratory Animals (86/609/EEC) and approved by the 1st Local Ethics Committee
for Animal Experiments in Warsaw, Poland. Three healthy, mature cats (one female, two male) were used. Cats
were initially anesthetized using a bolus KX i.p. injection . An intravenous catheter was implanted in a saphenous
vein for supplementary KX administration and 0.1–0.2 ml was administered every 20 min. Cat’s were placed in
a stereotaxic frame and electrodes (32-channel silicon probes or in-house 16-channel electrodes made of 25 mm
tungsten wire) implanted in the OB (AP approx. +30 mm from the interaural line, ML = 2–4 mm, DV = 3.4 mm
from surface), and also in the thalamus (AP +6.5 mm, ML = 9 mm, DV = 13.5 mm) and visual cortex (AP = −6
to −9 mm, ML = 3–9 mm, DV = 1–2 mm). Thalamic and cortical electrodes were implanted as part of a separate
study examining visual-evoked activity which was carried out after the KX experiment. Following acquisition
of electrophysiological data the naris was briefly closed for 10 s (in two cats), anesthesia was then replaced with
propofol for vision experiments (not presented here).
Data analysis. Recorded signals were processed using SciPy signal and NumPy Python libraries.
Analysis included bandpass filtering using Butterworth filters. Power of dominant frequency and dominant
frequency were evaluated using Welch transform from 60 s windows. To establish phase relation in KX HFO we
first used Hilbert transform to find a maximum activity of HFO burst and then computed shift in time relative
to peak of delta oscillations (score is rescaled to radians). Several
hundred HFO bursts were used to compute
intertrial phase clustering (ITCP) defined as ITPC = |n−1 nr=1 eik |, where k is the relative phase of the burst
and n is the number of trial.
To study correlation of thermocouple’s rhythm and LFP signal oscillation we filtered the signal in delta fre-
quencies 0.3–3 Hz and KX HFO 80–130 Hz. We computed a Pearson correlation score between the delta band
of thermocouple and the envelope of HFO signal computed with Hilbert transform. To confirm our hypothesis
that HFO is modulated by breathing rhythm we used comodulogram analysis for the two signals. Comodulo-
gram matrix was computed using open-source Python library described i n68. We used the “Tort” method from
pactools Python package, which seems to find a compromise for proper resolution in “phase” and “amplitude”
signal and is based on classic phase–amplitude coupling method. We evaluated statistical significance of the cou-
pling using resampling test of MI martices between groups of rats that were under KX and isoflurane anesthesia.
For multielectrode recordings, KX-HFOs significant bursts were detected using 3 standard deviation threshold
from top (short silicon probe) and middle (long silicon probe) channels used as a reference. We computed phase
shift between channels using maximum correlation score in respect to reference channel and averaged the score
across rats. CSDs were reconstructed using kCSD algorithm method f rom69,70 and available at https://g ithub.c om/
Neuroinflab/kCSD-python. We reconstructed CSD first and then filtered spatio-temporal CSD picture in delta
0.3–3 Hz and KX-HFO 80–130 Hz frequency bands. For multiunit activity analysis we first filtered the signal
above 500 Hz for every HFO burst/event. Then we extracted candidates for spikes with 3 standard deviation
criterion and represented them as discrete events in time. As a final step we made a histogram from aggregated
(across HFO events) spikes and computed Pearson correlation coefficient between spike histogram and average
HFO waveform. We repeated this kind of analysis for all channels independently.
Shaded regions in all plots and whiskers of the bar plots represent standard deviation of the mean (s.e.m).
All sample groups were tested with Shapiro-Wilk’s test for normality. If the data was normally distributed we
used a one-way ANOVA test for independent experiments or paired Student t-test for repeated measures. If the
score of the normality test was below p = 0.05, we used the Wilcoxon test or Friedman test followed by Nemenyi
post-hoc testing. We used tests from SciPy Python library. Additionally, we used a resampling test (100 000
draws with return) to compare modulation index matrices for KX and isoflurane anesthetized rats (n = 8). All
figures were made using Matplotlib Python l ibrary71.
Received: 23 July 2020; Accepted: 25 February 2021
References
1. Engel, A. K. & Singer, W. Temporal binding and the neural correlates of sensory awareness. Trends Cogn. Sci. 5, 16–25. https://doi.
org/10.1016/S1364-6613(00)01568-0 (2001).
2. Colgin, L. L. & Moser, E. I. Gamma oscillations in the hippocampus. Physiology 25, 319–329. https://doi.org/10.1152/physiol.
00021.2010 (2010).
3. Buzsáki, G., Anastassiou, C. A. & Koch, C. The origin of extracellular fields and currents—EEG, ECoG, LFP and spikes. Nat. Rev.
Neurosci. 13, 407–420. https://doi.org/10.1038/nrn3241 (2012).
4. Khodagholy, D., Gelinas, J. N. & Buzsáki, G. Learning-enhanced coupling between ripple oscillations in association cortices and
hippocampus. Science 358, 369–372. https://doi.org/10.1126/science.aan6203 (2017).
Scientific Reports | (2021) 11:6390 | https://doi.org/10.1038/s41598-021-85705-5 11
Vol.:(0123456789)www.nature.com/scientificreports/
5. Haufler, D. & Pare, D. High-frequency oscillations are prominent in the extended amygdala. J. Neurophysiol. 112, 110–119. https://
doi.org/10.1152/jn.00107.2014 (2014).
6. Zhong, W. et al. Selective entrainment of gamma subbands by different slow network oscillations. Proc. Natl. Acad. Sci. U.S.A. 114,
4519–4524. https://doi.org/10.1073/pnas.1617249114 (2017).
7. Vaz, A. P., Wittig, J. H., Inati, S. K. & Zaghloul, K. A. Replay of cortical spiking sequences during human memory retrieval. Science
367, 1131–1134. https://doi.org/10.1126/science.aba0672 (2020).
8. Borjigin, J. et al. Surge of neurophysiological coherence and connectivity in the dying brain. Proc. Natl. Acad. Sci. U.S.A. 110,
14432–14437. https://doi.org/10.1073/pnas.1308285110 (2013).
9. Zijlmans, M. et al. High-frequency oscillations as a new biomarker in epilepsy. Ann. Neurol. 71, 169–178. https://doi.org/10.1002/
ana.22548 (2012).
10. Foffani, G. et al. 300-Hz subthalamic oscillations in Parkinson’s disease. Brain 126, 2153–63. https://doi.org/10.1016/S1364-
6613(00)01568-00 (2003).
11. Hunt, M. J., Raynaud, B. & Garcia, R. Ketamine dose-dependently induces high-frequency oscillations in the nucleus accumbens
in freely moving rats. Biol. Psychiat. 60, 1206–1214. https://doi.org/10.1016/S1364-6613(00)01568-01 (2006).
12. Shimizu, E., Tang, Y. P., Rampon, C. & Tsien, J. Z. NMDA receptor-dependent synaptic reinforcement as a crucial process for
memory consolidation. Science 290, 1170–1174. https://doi.org/10.1016/S1364-6613(00)01568-02 (2000).
13. Hunt, M. J., Falinska, M., Łeski, S., Wójcik, D. K. & Kasicki, S. Differential effects produced by ketamine on oscillatory activity
recorded in the rat hippocampus, dorsal striatum and nucleus accumbens. J. Psychopharmacol. (Oxf., Engl.) 25, 808–21. https://
doi.org/10.1016/S1364-6613(00)01568-03 (2011).
14. Nicolás, M. J. et al. Ketamine-induced oscillations in the motor circuit of the rat basal ganglia. PLoS One 6, e21814. https://doi.
org/10.1016/S1364-6613(00)01568-04 (2011).
15. Caixeta, F. V., Cornélio, A. M., Scheffer-Teixeira, R., Ribeiro, S. & Tort, A. B. Ketamine alters oscillatory coupling in the hippocam-
pus. Sci. Rep. https://doi.org/10.1038/srep02348 (2013).
16. Hiyoshi, T., Kambe, D., Karasawa, J. I. & Chaki, S. Differential effects of NMDA receptor antagonists at lower and higher doses on
basal gamma band oscillation power in rat cortical electroencephalograms. Neuropharmacology 85, 384–396. https://doi.org/10.
1016/j.neuropharm.2014.05.037 (2014).
17. Cordon, I. et al. Coupling in the cortico-basal ganglia circuit is aberrant in the ketamine model of schizophrenia. Eur. Neuropsy-
chopharmacol. 25, 1375–1387. https://doi.org/10.1016/j.euroneuro.2015.04.004 (2015).
18. Flores, F. et al. A PK-PD model of ketamine-induced high-frequency oscillations. J. Neural Eng. https://d oi.o
rg/1 0.1 088/1 741-2 560/
12/5/056006 (2015).
19. Kealy, J., Commins, S. & Lowry, J. P. The effect of NMDA-R antagonism on simultaneously acquired local field potentials and tissue
oxygen levels in the brains of freely-moving rats. Neuropharmacology 116, 343–350. https://doi.org/10.1016/j.neuropharm.2017.
01.006 (2017).
20. Lee, J., Hudson, M. R., O’Brien, T. J., Nithianantharajah, J. & Jones, N. C. Local NMDA receptor hypofunction evokes generalized
effects on gamma and high-frequency oscillations and behavior. Neuroscience 358, 124–136. https://doi.org/10.1016/j.neuroscien
ce.2017.06.039 (2017).
21. Pittman-Polletta, B., Hu, K. & Kocsis, B. Subunit-specific NMDAR antagonism dissociates schizophrenia subtype-relevant oscil-
lopathies associated with frontal hypofunction and hippocampal hyperfunction. Sci. Rep. 8, 1–14. https://doi.o rg/10.1038/s 41598-
018-29331-8 (2018).
22. Ye, T. et al. Ten-hour exposure to low-dose ketamine enhances corticostriatal cross-frequency coupling and hippocampal broad-
band gamma oscillations. Front. Neural Circ. 12, 61. https://doi.org/10.3389/fncir.2018.00061 (2018).
23. Hansen, I. H. et al. Pharmaco-electroencephalographic responses in the rat differ between active and inactive locomotor states.
Eur. J. Neurosci. 50, 1948–1971. https://doi.org/10.1111/ejn.14373 (2019).
24. Amat-Foraster, M. et al. Modulation of thalamo-cortical activity by the NMDA receptor antagonists ketamine and phencyclidine
in the awake freely-moving rat. Neuropharmacology 158, 107745. https://doi.org/10.1016/j.neuropharm.2019.107745 (2019).
25. Wróbel, J. et al. Nasal respiration is necessary for ketamine-dependent high frequency network oscillations and behavioral hyper-
activity in rats. Sci. Rep. https://doi.org/10.1038/s41598-020-75641-1 (2020).
26. Hunt, M. J. et al. The olfactory bulb is a source of high-frequency oscillations 130–180 Hz associated with a subanesthetic dose of
ketamine in rodents. Neuropsychopharmacology 44, 435–442. https://doi.org/10.1038/s41386-018-0173-y (2019).
27. Ito, J. et al. Whisker barrel cortex delta oscillations and gamma power in the awake mouse are linked to respiration. Nat.
Commun.https://doi.org/10.1038/ncomms4572 (2014).
28. Pal, D., Hambrecht-Wiedbusch, V. S., Silverstein, B. H. & Mashour, G. A. Electroencephalographic coherence and cortical acetyl-
choline during ketamine-induced unconsciousness. Br. J. Anaesth. 114, 979–989. https://doi.org/10.1093/bja/aev095 (2015).
29. Hunt, M. J., Matulewicz, P., Gottesmann, C. & Kasicki, S. State-dependent changes in high-frequency oscillations recorded in the
rat nucleus accumbens. Neuroscience 164, 380–386. https://doi.org/10.1016/j.neuroscience.2009.08.047 (2009).
30. Hakami, T. et al. NMDA receptor hypofunction leads to generalized and persistent aberrant γ oscillations independent of hyper-
locomotion and the state of consciousness. PLoS ONEhttps://doi.org/10.1371/journal.pone.0006755 (2009).
31. Bagur, S. et al. Harnessing olfactory bulb oscillations to perform fully brain-based sleep-scoring and real-time monitoring of
anaesthesia depth. PLoS Biol.https://doi.org/10.1371/journal.pbio.2005458 (2018).
32. Ylinen, A. et al. Sharp wave-associated high-frequency oscillation (200 hz) in the intact hippocampus: Network and intracellular
mechanisms. J. Neurosci. 15, 30–46. https://doi.org/10.1523/jneurosci.15-01-00030.1995 (1995).
33. Grenier, F., Timofeev, I. & Steriade, M. Focal synchronization of ripples (80–200 Hz) in neocortex and their neuronal correlates.
J. Neurophysiol. 86, 1884–1898. https://doi.org/10.1152/jn.2001.86.4.1884 (2001).
34. Chery, R., Gurden, H. & Martin, C. Anesthetic regimes modulate the temporal dynamics of local field potential in the mouse
olfactory bulb. J. Neurophysiol. 111, 908–917. https://doi.org/10.1152/jn.00261.2013 (2014).
35. Lepousez, G. & Lledo, P. M. Odor discrimination requires proper olfactory fast oscillations in awake mice. Neuron 80, 1010–1024.
https://doi.org/10.1016/j.neuron.2013.07.025 (2013).
36. Nicol, A. U. & Morton, A. J. Characteristic patterns of EEG oscillations in sheep (Ovis aries) induced by ketamine may explain the
psychotropic effects seen in humans. Sci. Rep. 10, 1–10. https://doi.org/10.1038/s41598-020-66023-8 (2020).
37. Jurkiewicz, G. J., Hunt, M. J. & Żygierewicz, J. Addressing pitfalls in phase-amplitude coupling analysis with an extended modula-
tion index toolbox. Neuroinformaticshttps://doi.org/10.1007/s12021-020-09487-3 (2020).
38. Boyd, A. M., Kato, H. K., Komiyama, T. & Isaacson, J. S. Broadcasting of cortical activity to the olfactory bulb. Cell Rep. 10,
1032–1039. https://doi.org/10.1016/j.celrep.2015.01.047 (2015).
39. Diodato, A. et al. Molecular signatures of neural connectivity in the olfactory cortex. Nat. Commun. 7, 1–10. https://doi.org/10.
1038/ncomms12238 (2016).
40. Boyd, A. M., Sturgill, J. F., Poo, C. & Isaacson, J. S. Cortical feedback control of olfactory bulb circuits. Neuron 76, 1161–1174.
https://doi.org/10.1016/j.neuron.2012.10.020 (2012).
41. Neville, K. R. & Haberly, L. B. Beta and gamma oscillations in the olfactory system of the urethane-anesthetized rat. J. Neurophysiol.
90, 3921–3930. https://doi.org/10.1152/jn.00475.2003 (2003).
42. Adrian, E. D. Olfactory reactions in the brain of the hedgehog. J. Physiol. 100, 459–473. https://doi.org/10.1113/jphysiol.1942.
sp003955 (1942).
Scientific Reports | (2021) 11:6390 | https://doi.org/10.1038/s41598-021-85705-5 12
Vol:.(1234567890)www.nature.com/scientificreports/
43. Macrides, F. & Chorover, S. L. Olfactory bulb units: Activity correlated with inhalation cycles and odor quality. Science 175, 84–87.
https://doi.org/10.1126/science.175.4017.84 (1972).
44. Hintiryan, H. et al. Comprehensive connectivity of the mouse main olfactory bulb: Analysis and online digital atlas. Front. Neu-
roanat. 6, 30. https://doi.org/10.3389/fnana.2012.00030 (2012).
45. Fukunaga, I., Berning, M., Kollo, M., Schmaltz, A. & Schaefer, A. T. Two distinct channels of olfactory bulb output. Neuron 75,
320–329. https://doi.org/10.1016/j.neuron.2012.05.017 (2012).
46. Nicholson, C. & Freeman, J. A. Theory of current source-density analysis and determination of conductivity tensor for anuran
cerebellum. J. Neurophysiol. 38, 356–368. https://doi.org/10.1007/s12021-020-09487-30 (1975).
47. Mitzdorf, U. Current source-density method and application in cat cerebral cortex: Investigation of evoked potentials and EEG
phenomena. Physiol. Rev. 65, 37–100 (1985).
48. Kay, L. M. Circuit oscillations in odor perception and memory. Progr. Brain Res. 208, 223–251. https://doi.org/10.1016/B978-0-
444-63350-7.00009-7 (2014).
49. Fourcaud-Trocmé, N., Courtiol, E. & Buonviso, N. Two distinct olfactory bulb sublaminar networks involved in gamma and beta
oscillation generation: A CSD study in the anesthetized rat. Front. Neural Circ. 8, 88. https://doi.org/10.3389/fncir.2014.00088
(2014).
50. Burton, S. D. & Urban, N. N. Greater excitability and firing irregularity of tufted cells underlies distinct afferent-evoked activity
of olfactory bulb mitral and tufted cells. J. Physiol. 592, 2097–2118. https://doi.org/10.1113/jphysiol.2013.269886 (2014).
51. Nunez-Parra, A., Maurer, R. K., Krahe, K., Smith, R. S. & Araneda, R. C. Disruption of centrifugal inhibition to olfactory bulb
granule cells impairs olfactory discrimination. Proc. Natl. Acad. Sci. U.S.A. 110, 14777–82. https://doi.org/10.1073/pnas.13106
86110 (2013).
52. Chen, W. R., Xiong, W. & Shepherd, G. M. Analysis of relations between NMDA receptors and GABA release at olfactory bulb
reciprocal synapses. Neuron 25, 625–633. https://doi.org/10.1016/S0896-6273(00)81065-X (2000).
53. Traub, R. D. et al. Axonal gap junctions between principal neurons: A novel source of network oscillations, and perhaps epilep-
togenesis. Rev. Neurosci. 13, 1–30. https://doi.org/10.1515/REVNEURO.2002.13.1.1 (2002).
54. Christie, J. M. & Westbrook, G. L. Lateral excitation within the olfactory bulb. J. Neurosci. 26, 2269–2277. https://doi.org/10.1523/
JNEUROSCI.4791-05.2006 (2006).
55. Phillips, K. G. et al. Differential effects of NMDA antagonists on high frequency and gamma EEG oscillations in a neurodevelop-
mental model of schizophrenia. Neuropharmacology 62, 1359–1370. https://doi.org/10.1016/j.neuropharm.2011.04.006 (2012).
56. Osinski, B. L., Kim, A., Xiao, W., Mehta, N. M. & Kay, L. M. Pharmacological manipulation of the olfactory bulb modulates beta
oscillations: Testing model predictions. J. Neurophysiol. 120, 1090–1106. https://doi.org/10.1152/jn.00090.2018 (2018).
57. Wilson, D. A., Sullivan, R. M., Gall, C. M. & Guthrie, K. M. NMDA-receptor modulation of lateral inhibition and c-fos expression
in olfactory bulb. Brain Res. 719, 62–71. https://doi.org/10.1016/B978-0-444-63350-7.00009-70 (1996).
58. Burton, S. D. Inhibitory circuits of the mammalian main olfactory bulb. J. Neurophysiol. 118, 2034–2051. https://doi.org/10.1016/
B978-0-444-63350-7.00009-71 (2017).
59. Crespo, C., Liberia, T., Blasco-Ibáñez, J. M., Nácher, J. & Varea, E. The circuits of the olfactory bulb: The exception as a rule. Anat.
Rec. 296, 1401–1412. https://doi.org/10.1016/B978-0-444-63350-7.00009-72 (2013).
60. Kosaka, K., Heizmann, C. W. & Kosaka, T. Calcium-binding protein parvalbumin-immunoreactive neurons in the rat olfactory
bulb–1. Distribution and structural features in adult rat. Exp. Brain Res. 99, 191–204. https://doi.org/10.1007/BF00239586 (1994).
61. Mountoufaris, G. et al. Interneurons of the neocortical inhibitory system. Nat. Rev. Neurosci. 75, 793–807. https://d oi.o
rg/1 0.1 126/
science.aal3231 (2017).
62. Kato, H. K., Gillet, S. N., Peters, A. J., Isaacson, J. S. & Komiyama, T. Parvalbumin-expressing interneurons linearly control olfac-
tory bulb output. Neuron 80, 1218–1231. https://doi.org/10.1016/j.neuron.2013.08.036 (2013).
63. Miyamichi, K. et al. Dissecting local circuits: Parvalbumin interneurons underlie broad feedback control of olfactory bulb output.
Neuron 80, 1232–45. https://doi.org/10.1016/j.neuron.2013.08.027 (2013).
64. Olszewski, M., Piasecka, J., Goda, S. A., Kasicki, S. & Hunt, M. J. Antipsychotic compounds differentially modulate high-frequency
oscillations in the rat nucleus accumbens: A comparison of first- and second-generation drugs. Int. J. Neuropsychopharmacol. 16,
1009–1020. https://doi.org/10.1017/S1461145712001034 (2013).
65. Hunt, M. J. & Kasicki, S. A systematic review of the effects of NMDA receptor antagonists on oscillatory activity recorded in vivo.
J. Psychopharmacol. 27, 972–986. https://doi.org/10.1177/0269881113495117 (2013).
66. Hansen, I. H. Investigation of Pharmacological Manipulationon Brain Connectivity in Rats and Humans for Improvement of Drug
Development. Ph.D. thesis, DTU Health Technology (2019).
67. Struck, M. B., Andrutis, K. A., Ramirez, H. E. & Battles, A. H. Effect of a short-term fast on ketamine-xylazine anesthesia in rats.
J. Am. Assoc. Lab. Anim. Sci. JAALAS 50, 344 (2011).
68. Dupré la Tour, T. et al. Non-linear auto-regressive models for cross-frequency coupling in neural time series. PLoS Comput. Biol.
13, e1005893. https://doi.org/10.1371/journal.pcbi.1005893 (2017).
69. Potworowski, J., Jakuczun, W., Łeski, S. & Wójcik, D. Kernel current source density method. Neural Comput. 24, 541–575. https://
doi.org/10.1162/NECO_a_00236 (2012).
70. Chintaluri, H. C. et al. kCSD-python, a tool for reliable current source density estimation. BioRxiv 708511, 2 (2019).
71. Hunter, J. D. Matplotlib: A 2D graphics environment. Comput. Sci. Eng. 9, 90–95. https://doi.org/10.1109/MCSE.2007.55 (2007).
Acknowledgements
This work was financed by the National Science Centre (Poland) grant UMO-2016/23/B/NZ/03657 and the
Welcome Trust (UK). We would like to acknowledge Prof. Andrzej Wróbel, Piotr Dzwiniel, Anna Posłuszny and
Magda Majkowska for assistance with cat experiments.
Author contributions
W.S., J.W., E.K. and M.H. conducted the experiments, W.S, D.W., M.W. and M.H. designed the experiments and
wrote the paper. W.S and M.H. analyzed the data and designed figures.
Competing interests
The authors declare no competing interests.
Additional information
Supplementary Information The online version contains supplementary material available at https://doi.org/
10.1038/s41598-021-85705-5.
Correspondence and requests for materials should be addressed to M.J.H.
Scientific Reports | (2021) 11:6390 | https://doi.org/10.1038/s41598-021-85705-5 13
Vol.:(0123456789)www.nature.com/scientificreports/
Reprints and permissions information is available at www.nature.com/reprints.
Publisher’s note Springer Nature remains neutral with regard to jurisdictional claims in published maps and
institutional affiliations.
Open Access This article is licensed under a Creative Commons Attribution 4.0 International
License, which permits use, sharing, adaptation, distribution and reproduction in any medium or
format, as long as you give appropriate credit to the original author(s) and the source, provide a link to the
Creative Commons licence, and indicate if changes were made. The images or other third party material in this
article are included in the article’s Creative Commons licence, unless indicated otherwise in a credit line to the
material. If material is not included in the article’s Creative Commons licence and your intended use is not
permitted by statutory regulation or exceeds the permitted use, you will need to obtain permission directly from
the copyright holder. To view a copy of this licence, visit http://creativecommons.org/licenses/by/4.0/.
© The Author(s) 2021
Scientific Reports | (2021) 11:6390 | https://doi.org/10.1038/s41598-021-85705-5 14
Vol:.(1234567890)You can also read


