High-Throughput Quantification of 32 Bioactive Antioxidant Phenolic Compounds in Grapes, Wines and Vinification Byproducts by LC-MS/MS - MDPI
←
→
Page content transcription
If your browser does not render page correctly, please read the page content below
antioxidants

Article
High-Throughput Quantification of 32 Bioactive Antioxidant
Phenolic Compounds in Grapes, Wines and Vinification
Byproducts by LC–MS/MS
Eleni D. Myrtsi, Sofia D. Koulocheri, Vassilios Iliopoulos and Serkos A. Haroutounian *

                                          Laboratory of Nutritional Physiology and Feeding, Department of Animal Science, School of Animal Biosciences,
                                          Agricultural University of Athens, Iera Odos 75, 11855 Athens, Greece; elenamirtsi@aua.gr (E.D.M.);
                                          skoul@aua.gr (S.D.K.); heliopoylos@hotmail.com (V.I.)
                                          * Correspondence: sehar@aua.gr; Tel.: +30-210-529-4247

                                          Abstract: The well-established, health-benefitting effects of grapevines and derivatives (wines and
                                          vinification byproducts) are attributed to their antioxidant phenolic content. The dearth of an efficient
                                          method for the simultaneous quantitation of antioxidant phenolics prompted us to develop a novel
                                          method utilizing triple quadrupole LC–MS/MS for the accurate, fast, simultaneous quantitation
                                          of the 32 most abundant grapevine phenolics. The fully validated, novel method is capable to
                                          simultaneously record the quantitative presence of 12 phenolic acids, 19 polyphenols and coniferyl
                                          aldehyde (a phenolic compound extracted from cork stoppers into wines) and is applicable for
                                the determination of antioxidant phenolics content of grape berries, pomace, stems and wines. Its

                                          utility was demonstrated for three native Greek grapevine varieties, two red (Mandilaria and Aidani
Citation: Myrtsi, E.D.;
                                          mavro) and one white (Monemvassia). Results herein highlighted the stems of the Monemvassia
Koulocheri, S.D.; Iliopoulos, V.;
                                          white variety as particularly rich in antioxidant phenolics such as the flavonol monomer (+)-catechin
Haroutounian, S.A. High-Throughput
                                          (387 mg/kg) and the dimer procyanidin B1 (400 mg/kg) along with stilbene phytoalexin trans-
Quantification of 32 Bioactive
Antioxidant Phenolic Compounds in
                                          resveratrol (24 mg/kg). These results are in line with the TPC, TFC and TTC content of stems and the
Grapes, Wines and Vinification            determined antioxidant capacities, highlighting the stems of this Vitis vinifera variety as potentially
Byproducts by LC–MS/MS.                   exploitable source of antioxidant phenolics.
Antioxidants 2021, 10, 1174. https://
doi.org/10.3390/antiox10081174            Keywords: phenolic antioxidants; polyphenols quantitation; grape stems; grape pomace; wines;
                                          LC–MS/MS
Academic Editor:
Antonio Segura-Carretero

Received: 24 June 2021                    1. Introduction
Accepted: 20 July 2021
                                               The grapevine is a thermophilic plant cultivated in the temperate zone around the
Published: 23 July 2021
                                          globe. According to Food and Agriculture Organization (FAO) data, 71% of world grapevine
                                          production is used for winemaking. The global production of wine for the year 2018 ex-
Publisher’s Note: MDPI stays neutral
                                          ceeded 29 Mtones, highlighting wine as one of the most important agricultural products for
with regard to jurisdictional claims in
                                          international trade. The vast amount of global wine production is located in Europe (62%,
published maps and institutional affil-
                                          18 Mtones), mainly in Italy, France and Spain [1].
iations.
                                               Grapes contain large amounts of phytochemicals that provide to the respective wines
                                          their sensory characteristics of color, aroma and astringency [2] as well as various properties
                                          beneficial to health [3–5]. Among these phytochemicals, antioxidant phenolics constitute
                                          the the most prominent and well-studied class of compounds [6,7]. They consist of polyphe-
Copyright: © 2021 by the authors.
                                          nols, defined as the compounds that possess multiple aromatic rings with one or more
Licensee MDPI, Basel, Switzerland.
                                          hydroxy groups (flavonoids, anthocyanins, tannins, stilbenes) and phenolic acids, which
This article is an open access article
                                          are compounds containing a carboxy-substituted aromatic ring with one or more hydroxyl
distributed under the terms and
                                          groups attached [6,8]. Functionally, the antioxidant phenolic compounds are classified into
conditions of the Creative Commons
                                          secondary metabolites, a class of plant-derived compounds with diverse chemical struc-
Attribution (CC BY) license (https://
creativecommons.org/licenses/by/
                                          tures and functions, which are produced during the physiological growth of grapevines
4.0/).
                                          or as their response to various forms of environmental stress [8–10]. Their presence in

Antioxidants 2021, 10, 1174. https://doi.org/10.3390/antiox10081174                                     https://www.mdpi.com/journal/antioxidants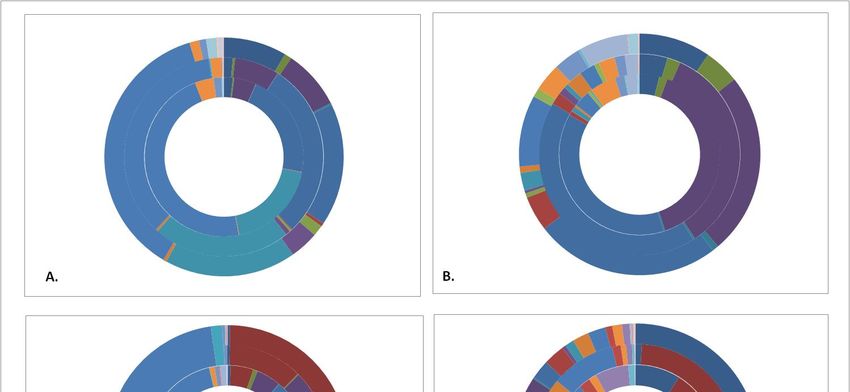
Antioxidants 2021, 10, 1174                                                                                           2 of 20

                              grapevines is associated with the quality and authenticity of wines [11–13] along with
                              a broad spectrum of bioactivities including antimicrobial [14,15], anticancer [16–18], an-
                              tiaging [19], antiglycogenic [20] and cardiovascular system-protective [21,22] properties.
                              During the last three decades, the biological activities of grapevine phenolic compounds
                              have been extensively exploited, providing valuable information that has attributed their
                              health-benefitting effects to their strong antioxidant properties. Thus, it has been estab-
                              lished that these compounds act as potent free radical scavengers, electron or hydrogen
                              donors and strong metal chelators, which prevent the development of diverse harmful
                              events such as lipid peroxidation [23], DNA damage [24], etc. Additionally, grape phenolics
                              display the capability to provide protection from the ROS-induced DNA damage of vari-
                              ous cancer cells (e.g., liver and cervical) [25] or the oxidative damage of cell constituents,
                              limiting the risk of developing chronic neurodegenerative conditions associated with ox-
                              idative stress such as dementia and Parkinson’s and Alzheimer’s diseases [3,5]. Finally,
                              it is noteworthy that several studies have indicated that the incorporation of grape phe-
                              nolics into a daily diet limits the possibility of developing cancer, cardiovascular diseases,
                              neurodegenerative diseases, diabetes and osteoporosis [26].
                                    The above-mentioned health-benefitting effects of grapevine phenolics have initiated a
                              sharply growing market for their utilization as active ingredients by the cosmetic, pharma-
                              ceutical [27] and food supplement industries [28,29]. Thus, vigorous research activity has
                              been initiated toward the identification and efficient recovery of various antioxidant phe-
                              nolics from vinification by-products, as pure compounds and/or enriched extracts [17,30].
                              Consequently, there are many scientific reports concerning the phenolic compound content
                              of different Vitis vinifera varieties [31,32], the most widely cultivated grapevine species,
                              along with various methods for the determination of their abundancy [32–35] and/or
                              recovery procedures [14,36,37]. Thus, there is an emerging need for the development
                              and validation of a fast and accurate method, which will be applicable for samples ob-
                              tained from grapes, wines and vinification by-products (grape pomace and stems), for
                              the simultaneous determination of a large number of bioactive phenolics. It must be
                              noted however, that the diversity and structural complexity of grape phenolics constitute
                              serious drawbacks for the development of an efficient, universal analytical method for
                              simultaneous assessment from diverse samples. Most of the methods developed to date
                              concern applications of reversed-phase HPLC, with the disadvantages of long durations of
                              run-times and the limited number of simultaneously determined phenolics [35,38].
                                    The study herein refers to the development, validation and application of a high-
                              throughput method for the simultaneous determination of the quantitative presence of
                              the 32 most common antioxidant phenolic compounds found in grapevines. The method
                              was developed using reverse-phase, high-pressure liquid chromatography coupled with
                              tandem MS/MS, which allowed the fast and highly sensitive simultaneous determination
                              of the antioxidant phenolics found in grapes, wines and vinification byproducts. In the
                              context of the present work, three native Greek Vitis vinfera grapevine varieties, cultivated
                              on the island of Paros, were studied, along with their respective wines (white, red and rose)
                              and vinification byproducts (pomace and stems). Moreover, the antioxidant phenolics of
                              these products were identified and quantified along with their contents of total phenolics
                              (TPC), flavonoids (TFC) and tannins (TTC) as well as the estimation of their antioxidant
                              capacities through the performance of DPPH and FRAP assays.

                              2. Materials and Methods
                              2.1. Grapes, Wines and Vinification Byproducts
                                   All samples studied were provided by the Moraitis Winery, located on the island of
                              Paros, Greece. The fresh grape berries belonging to native red (Mandilaria, Aidani mavro)
                              and white (Monemvassia) varieties of the Vitis vinifera species were harvested at their
                              commercial maturity from the winery’s vineyard during the summer of 2020. Grape berries
                              were manually destemmed and unseeded, weighed, freeze dried, mill powdered and
                              stored in a freezer. The vinification byproducts (grape pomace and stems) were separated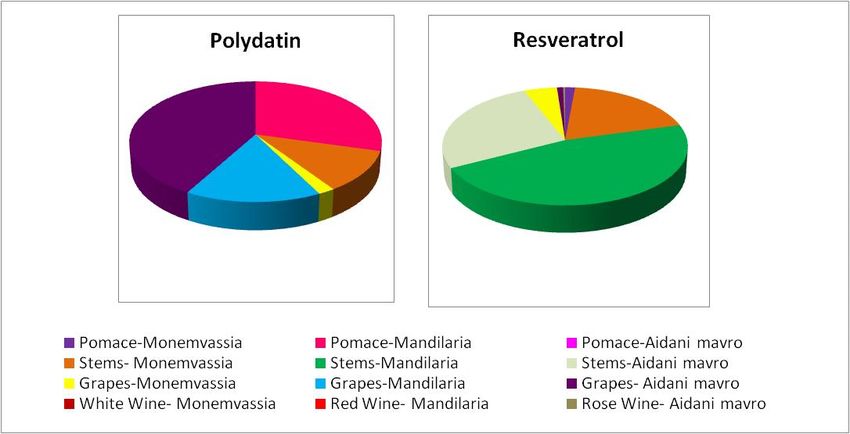
Antioxidants 2021, 10, 1174                                                                                        3 of 20

                              after the 2020 production process, air dried in a dark room, mill powdered and stored at
                              room temperature until processing. The studied wines were provided by the winery as red
                              (Mandilaria), white (Monemvassia) and rose (Aidani mavro) wine samples.

                              2.2. Chemicals and Standards
                                    All solvents used for the extractions of phenolic compounds from grapevines and
                              vinification byproducts were purchased from Carlo Erba and Fisher Chemicals as analytical-
                              grade solvents. Solvents used for the LC–MS/MS determinations were obtained as LC–MS
                              grade from J.T. Baker (water and acetonitrile) and Fisher Chemicals (formic acid).
                                    All standards used for the assessments of phenolic compounds were obtained from
                              Sigma-Aldrich except epigallocatechin gallate and quercetin-3-β-D-glucoside, which were
                              provided by Extra Synthese; coutaric, fertaric and caftaric acids, which were obtained from
                              Phytolab; and ferulic acid, bought from Fluka. Folin–Ciocalteu’s reagent, 2,2-diphenyl-1-
                              picrylhydrazyl (DPPH), and 2,4,6-tris(2-pyridyl)-s-triazine (TPTZ) were purchased from
                              Sigma-Aldrich, while 6-hydroxy-2,5,7,8-tetramethylchroman-2-carboxylic acid (Trolox)
                              and vanillin were obtained from Acros Organics. Anhydrous sodium carbonate, sulfuric
                              acid 98% and hydrochloric acid were purchased from Chem-Lab; glacial acetic acid from
                              Sigma-Aldrich; hexahydrate aluminum chloride from Fluka; and hydrate sodium acetate
                              from Merck. Hexahydrate ferric chloride and heptahydrate iron sulfate were obtained from
                              Alfa Aesar.

                              2.3. Sample Preparation
                                    The extraction of phenolics from solid samples (grapes, vinification byproducts)
                              was implemented as follows: 50 g of dried, powdered sample were added into a 200 mL
                              mixture of MeOH/H2 O/1.0 N HCl (90:9.5:0.5 v/v) and sonicated for 10 min in an ultrasonic
                              bath (35 kHz, RK 100 SH, Bandelin Sonorex Super). Next, the solvent was separated by
                              filtration, and the remaining solid was extracted two additional times with the same
                              procedure and solvent system. The combined extracts were evaporated under reduced
                              pressure to produce a slurry, which was subsequently dissolved in 50 mL of MeOH/H2 O
                              (1:1) and centrifuged for 10 min (7500 rpm). The supernatant liquid was extracted with
                              petroleum ether (3 × 30 mL) to remove lipids and then concentrated under vacuum. The
                              remaining residue was poured into 50 mL of brine and extracted repetitively with ethyl
                              acetate (EtOAc, 3 × 50 mL) to remove the sugars, which were dissolved into the aqueous
                              layer. The combined organic layers were dried over anhydrous MgSO4 and evaporated
                              under reduced pressure to yield a solid, which was weighed and dissolved in MeOH to a
                              concentration of 1 mg/mL and subjected to LC–MS/MS analysis.
                                    Wine samples were processed immediately after bottle opening in accordance with
                              the following procedure: 5 mL of wine were centrifuged for 10 min at 7500 rpm, membrane
                              filtered (pore filter: 0.45µm) and subjected directly to LC–MS/MS analysis.
                                    To avoid polyphenol degradation, all abovementioned activities were performed in
                              the absence of direct sunlight and at temperatures below 35 ◦ C.

                              2.4. Determination of Phenolic Compound Content by LC–MS/MS Analysis
                              2.4.1. Preparation of Standard Stock Solutions
                                   For each analyte (phenolic compound) standard, a methanolic stock solution was pre-
                              pared at concentrations ranging from 90 to 2400 µg/mL. These solutions were maintained
                              at −20 ◦ C, and immediately prior to analysis, they were mixed in order to provide dilute
                              solutions of mixtures of analytes at concentrations ranging from 50 to 1500 ng/mL. These
                              solutions were further utilized to construct calibration curves.

                              2.4.2. LC–MS/MS Analysis
                                   The assessment of phenolic compounds was performed using an Accela Ultra High-
                              Performance Liquid Chromatography system equipped with an autosampler and coupled
Antioxidants 2021, 10, 1174 4 of 20
with a TSQ Quantum Access triple-quadrupole mass spectrometer (Thermo Fisher Scien-
tific, Inc., Waltham, MA, USA).
The separation of phytochemicals was achieved on a reverse phase column of internal
diameter 150 × 2.1 mm and particle size 3 µm (Fortis Technologies Ltd., Neston, Cheshire,
UK). For the protection of the column, an AF C18 guard column from the same provider
was used with internal diameter 10 × 2.0 mm and particle size 3µm. Mobile phase A
consisted of water/formic acid (0.1%) solution, while mobile phase B was composed of an
acetonitrile/formic acid (0.1%) solution. Mobile phases A and B were degassed at 25 ◦ C for
10 min. The injection volume of each sample was 10µL, the flow rate was set to 0.2 mL/min
and the tray and column temperatures were set, respectively, at 25 and 35 ◦ C. The gradient
elution conditions for mobile phases A and B were set as follows: 0.0–2.0 min, 10% B;
2.0–16.7 min, from 10% to 100% B; 16.7–18.7 min, 100% B; and 18.8–22.0 min, 10% B for the
re-equilibration of the column between injections.
For the MS/MS determination, the electrospray ionization (ESI) technique was utilized
for both negative and positive ion polarities and operated in selected reaction monitoring
(SRM) mode to achieve increased sensitivity. Before analysis, the molecular ion transitions
and collision energies of the target analytes were obtained by direct infusion in full scan
(mass range: 100–1500), while the ion source and vacuum parameters were optimized in
order to be applicable for all analytes. A nitrogen generator (Peak Scientific) was used
to provide the nitrogen that was utilized as sheath and auxiliary gases with the initial
pressures set at 25 and 10 Arb, respectively. The spray voltage was set at 3.5 kV in the
negative polarity and at 3.0 kV in the positive polarity. The capillary temperature was
regulated at 300 ◦ C, and the collision pressure of the argon gas was adjusted at 1.5 mTorr.
All selected ion transitions are included in Table 1.
Table 1. Transition, collision energy, polarity and retention time (RT) applied for each phenolic standard.
Parent Product Collision RT
Compound Polarity
Mass Mass Energy (eV) (min)
126.089 17
Gallic acid 169.939 (–) 3.59
125.047 17
109.048 22
Protocatechuic acid 154.057 (–) 6.43
110.095 17
149.039 14
Caftaric acid 312.151 (–) 6.82
179.985 17
Procyanidin B1 578.328 426.099 18 (–) 6.89
124.855 27
Epigallocatechin 306.138 (–) 7.13
179.658 18
Chlorogenic acid 354.200 191.113 20 (–) 7.72
315.121 47
Oenin 493.236 (+) 7.87
331.122 23
203.873 22
Catechin 290.133 (–) 7.89
245.958 17
Procyanidin B2 578.122 290.047 31 (–) 8.06
120.145 29
Coutaric acid 296.129 (–) 8.16
164.015 18
134.113 33
Fertaric acid 326.172 (–) 8.46
194.059 18
203.818 21
Epicatechin 290.132 (–) 8.48
245.948 17
167.890 22
Epigallocatechin gallate 458.233 (–) 8.59
457.460 11
135.095 24
Caffeic acid 180.102 (–) 8.69
136.106 19Antioxidants 2021, 10, 1174 5 of 20
Table 1. Cont.
Parent Product Collision RT
Compound Polarity
Mass Mass Energy (eV) (min)
167.89 22
Syringic acid 198.085 (–) 8.86
182.921 16
Hesperidin 610.054 301.320 28 (–) 8.96
229.992 21
trans-Polydatin 390.548 (–) 9.31
389.777 8
300.781 28
Quercetin-3-β-D-glucoside 464.220 (–) 9.32
301.966 26
168.845 23
Epicatechin gallate 442.252 (–) 9.47
290.236 21
424.052 18
Procyanidin A2 576.358 (–) 9.59
449.815 24
271.536 68
Rutin 610.355 (–) 9.65
302.205 44
94.475 36
p-Coumaric acid 164.014 (–) 9.85
119.835 18
193.987 24
Sinapic acid 224.132 (–) 9.99
209.043 17
135.094 20
Ferulic acid 194.120 (–) 10.09
179.062 16
136.79 29
Myricetin 318.114 (–) 10.63
178.963 22
119.068 17
o-Coumaric acid 163.970 (–) 10.79
120.127 16
Coniferyl aldeyde 178.085 162.944 16 (–) 11.10
144.131 29
trans-Resveratrol 228.146 (–) 11.24
186.109 22
151.483 24
Quercetin 302.111 (–) 11.74
179.692 22
116.922 42
Apigenin 270.037 (–) 12.67
117.972 40
211.942 33
Kaempferol 286.102 (–) 12.83
229.944 27
301.277 24
Isorhamnetin 316.376 (–) 13.01
302.404 23
Internal Standard: 136.900 26
2-(4-Chlorophenyl) 182.456 (–) 12.60
154.892 19
malonaldehyde
2.4.3. Quantification of Phenolic Compounds
The quantification of phenolic compounds was achieved by diluting the corresponding
standard stock solutions of target analytes in order to construct a calibration curve for each
analyte for seven concentration levels (50, 100, 250, 500, 800, 1200 and 1500 ng/mL). The
latter allowed for the quantification of the presence of the respective analytes by dividing
the chromatographic peak area of the standard compound by the corresponding peak
area of the internal standard (200 ng/mL) (Aanalyte /Ais = yaxis ). Next, the presence of
each phenolic compound was defined by calculating its concentration, using the equation
Conc. = xaxis .
2.4.4. Analytical Method Validation
Linearity
The linearity of the analytical method was evaluated using the aforementioned cal-
ibration curves in order to determine the respective correlation coefficients, slopes and
intercept values. The linearity was considered acceptable when the regression coefficient
exceeded 0.998 and the volume of the detected residuals remained lower than 20%.Antioxidants 2021, 10, 1174 6 of 20
Limit of Detection (LOD) and Limit of Quantification (LOQ)
The LOD and LOQ values were determined using the standard deviation of the
response and slope, according to Equations (1) and (2), respectively:
3.3σ
LOD = (1)
S
Equation (1): Calculation algorithm for the LOD (Limit of Detection) determination.
10σ
LOQ = (2)
S
Equation (2): Algorithm for LOQ (Limit of Quantification) calculation.
Σ = standard deviation of response, S = slope of calibration curve.
The LOD and LOQ values, along with their respective equation and correlation
coefficients, are presented in Table 2.
Table 2. Calculations of equations, correlation coefficients, LOD and LOQ for each phenolic standard.
Compound Equation R2 LOD (ng/mL) LOQ (ng/mL)
Gallic acid y = −0.00096256 + 0.0395411x 0.9998 29.2 88.4
Caftaric acid y = −0.00534158 + 0.07718x 0.9996 25.3 76.8
Protocatechuic acid y = −0.000761486 + 0.0310679x 0.9999 29.9 90.8
Procyanidin B1 y = −0.00258365 + 0.0256469x 0.9998 53.2 161.2
Epigallocatechin y = −0.00488722 + 0.0509023x 0.9997 63.4 192.1
Chlorogenic acid y = −0.00016251 + 0.0821949x 0.9992 25.4 76.9
Catechin y = −0.00202138 + 0.0129254x 0.9993 94.4 286.1
Coutaric acid y = −0.007455 + 0.198158x 0.9998 49.0 148.4
Syringic acid y = −0.00125888 + 0.0655096x 0.9998 119.7 362.8
Oenin y = −0.406027 + 11.2312x 0.9995 20.5 62.1
Procyanidin B2 y = −0.00111717 + 0.0215283x 0.9996 62.2 188.6
Fertaric acid y = 0.000358572 + 0.147193x 0.9999 7.5 22.6
Epicatechin y = 0.0000486191 + 0.00498918x 0.9989 46.2 139.6
Caffeic acid y = −0.167715 + 0.488001x 0.9998 11.9 36.1
Epigallocatechin gallate y = 0.000118646 + 0.00994617x 0.9993 34.5 104.5
Hesperidin y = 0.000321812 + 0.000883822x 0.9988 120.0 363.6
trans-Polydatin y = 0.00124534 + 0.0569565x 0.9998 59.9 181.4
Quercetin-3-β-D-glucoside y = −0.000728175 + 0.0484013x 0.9998 41.6 126.1
Epicatechin gallate y = −0.00151726 + 0.0801815x 0.9999 32.5 98.5
Procyanidin A2 y = −0.000351333 + 0.131369x 0.9998 46.3 140.4
Rutin y = −0.00209729 + 0.0613716x 0.9997 42.9 130.1
p-Coumaric acid y = −0.000916311 + 0.0643206x 0.9998 30.4 92.4
Ferulic acid y = −0.00093805 + 0.01891x 0.9994 81.1 245.7
Sinapic acid y = 0.000677742 + 0.00960727x 0.9996 53.9 163.4
trans-Resveratrol y = 0.000015519 + 0.00578912x 0.9999 158.3 479.8
Myricetin y = 0.000640023 + 0.20355x 0.9998 13.0 39.5
o-Coumaric acid y = −0.0000876583 + 0.0740954x 0.9997 28.9 87.7
Coniferyl aldehyde y = −0.00119489 + 0.0676759x 0.9999 31.3 95.0
Quercetin y = −0.00140527 + 0.068703x 0.9999 31.3 95.0
Apigenin y = 0.00884981 + 0.300563x 0.9993 8.3 25.2
Kaempferol y = −0.000290336 + 0.0430157x 0.9995 52.2 158.2
Isorhamnetin y = −0.00579894 + 0.432144x 0.9999 15.7 47.5
Precision
The precision of an analytical method is expressed as the relative standard deviation,
%RSD of the repeatability (intra-day) and intermediate precisions (inter-day) of three
analyses (n = 3) during the same day and over three days studied, respectively. Herein, the
precision of the method was determined by analyzing the concentration of 250 ng/mL ofAntioxidants 2021, 10, 1174 7 of 20
the analyte standards using the aforementioned method of calculation. The precision was
considered as acceptable when the %RSD value was lower of 20%.
Recovery
For the calculation of recoveries, three different amounts (low, medium and high) of
the analyte standards were added to a white wine matrix. In the case of 15 analytes, which
were determined to display low LOD and LOQ values, an additional (lower) amount of
analyte standard was added. Next, each sample was treated according to its respective
sample handling procedure and analyzed using the LC–MS/MS method. Finally, the
quantity of each analyte was calculated using the corresponding calibration curve to
provide the recovery value for each analyte.
Determination of Matrix Effect
The identification and quantification of an analyte can definitely be influenced by the
matrix effect. This can lead to either a false negative output because of ion suppression or to
a false positive result when the signal of the internal standard (IS) undergoes a suppression
greater than that of the analyte.
The matrix effect can be quantitatively evaluated by comparing the response measured
for a standard solution of analyte with the respective value obtained for a spiked solution
of analyte at the same concentration and solvent with the analyzed samples. The matrix
effect can be calculated by the following formula [23,39]:
AStdS − ASample
Matrix Effect (ME) = × 100 (3)
AStdS
Equation (3): Algorithm for the calculation of the matrix effect.
AStdS = peak area of analyte’s standard solution, ASample = peak area of spiked analyte
in a sample not containing the analyte at the same concentration as the standard solution.
2.5. Estimation of Phenolic Compound Content and Antioxidant Properties
The estimation of the phenolic compounds abundances was achieved by the assess-
ment of total phenolic content (TPC), total flavonoid content (TFC) and total tannin content
(TTC). The measurement of antioxidant capacities was determined with 2,2-diphenyl-1-
picrylhydrazyl (DPPH) and ferric reducing antioxidant power (FRAP) assays. The respec-
tive data were obtained using an Infinite® 200 PRO microplate reader (Tecan Group Ltd.,
San Jose, CA, USA). All measurements were performed in triplicate, and the respective
results were recorded as the mean ± standard deviation of the three replicates.
2.5.1. Determination of Total Phenolic Content (TPC)
The TPCs for all samples were measured using a modified version of a spectropho-
tometric method developed by Hilma et al., 2018 [39]. Briefly, 10 µL of each sample was
dissolved in 100 µL of water, and 10 µL of Folin–Ciocalteu reagent solution was added.
The resulting solution was placed in triplicate in a 96-well microplate (Sarstedt AG & Co.
KG, Nümbrecht, Germany) and incubated for 3 min at room temperature. Next, 20 µL
of sodium carbonate aqueous solution (7.5% w/v) and 60µL of water were added, and
the incubation was continued in the dark for an additional 60 min. The absorbance of the
solution was measured at a 765 nm wavelength, and the respective sample was quantified
relatively to a standard calibration curve prepared with 30–200 µg/mL (30, 55, 80, 110, 135,
160, 180, 200 µg/mL) solutions of gallic acid in methanol. The results are expressed as g
of gallic acid equivalents per kg of dry weight of each sample (g GAE/kg of DW). For
wines, the respective results are expressed as g of gallic acid equivalents per L of wine
(g GAE/L of W).Antioxidants 2021, 10, 1174 8 of 20
2.5.2. Determination of Total Flavonoid Content (TFC)
The TFCs of all samples were determined using a modification of the aluminum
chloride method of P˛ekal and Pyrzynska [40]. Specifically, 100 µL of each sample, 50 µL
of aluminum chloride aqueous solution (2% w/v) and 50 µL of sodium acetate aqueous
solution (1 M) were poured in triplicate into a 96-well microplate and incubated in the
dark at room temperature for 40 min. Next, the absorbance was measured at a 415 nm
wavelength. The respective TFC values were calculated against a standard calibration
curve prepared for quercetin solutions (10, 25, 40, 55, 70, 85, 100 µg/mL). Results are
expressed as g of quercetin equivalents per kg of dry weight of each sample (g QE/kg DW)
and for wines as g of quercetin equivalents per L of wine (g QE/L of W).
2.5.3. Determination of Total Tannin Content (TTC)
The TTCs of all samples were estimated using a modified version of the method
developed by Hong et al., 2021 [41]. In particular, 25 µL of all samples were mixed with
150 µL of a vanillin methanolic solution (4% w/v), and 25 µL of a methanolic solution
of sulfuric acid (32%) were added. The mixture was placed in triplicate into a 96-well
microplate and incubated for 15 min at room temperature in the dark. Next, the absorbance
was measured at a 500 nm wavelength, and the TTCs were determined against a standard
calibration curve of epicatechin solutions at concentrations of 120, 220, 350, 500, 650, 800,
950 and 1000 µg/mL. Results are expressed as g of epicatechin equivalents per kg of dry
weight of each sample (g EE/kg DW) and for wines as g of epicatechin equivalents per L
of wine (g EE/L of W).
2.5.4. DPPH· Radical Scavenging Assay
The radical scavenging activity of the samples was evaluated using the DPPH· assay
method modified by Anastasiadi et al., 2010 [35]. Briefly, 30 µL of each sample was
mixed with 175 µL of a methanolic solution of DPPH radicals (0.1 M) and placed into a
96-well microplate. The mixture was incubated for 40 min at room temperature. Next, the
absorbance was measured at a 515 nm wavelength, and the activity was determined against
a standard curve generated for different concentrations of Trolox (15, 25, 35, 45, 55, 65, 75,
85 µg/mL). The percentage of inhibition (Pi) was calculated using the following equation:
Asample − Ablank
Pi = 1 − × 100 (4)
Acontrol − Ablank
Equation (4): percentage of inhibition.
Asample = absorbance of sample, Ablank = absorbance of blank,
Acontrol = absorbance of control.
Results are expressed as the inhibitory concentrations (IC50 ) in g/kg dry weight for
extracts or mg/L for wines that were required to quench 50% of the initial DPPH· radicals
under the given experimental conditions.
2.5.5. Ferric Reducing Antioxidant Power (FRAP) Assay
The determination of the reducing capacity of samples was based on a method pub-
lished by Anastasiadi et al., 2010 [35], which concerned the determination of the samples’
ability to reduce the Fe3+ of a Fe3+ -TPTZ complex (ferric-2,4,6-tripyridyl-s-triazine) into
Fe2+ -TPTZ. Specifically, the FRAP reagent was prepared just before the analysis by mixing
10 mL of acetate buffer (pH 3.6) with 1 mL of ferric chloride hexahydrate (20 mM in dis-
tilled water) and 1 mL of 2,4,6-tris(2-pyridyl)-s-triazine (TPTZ) (10 mM in HCl 0.04 N). The
mixture was placed in a water bath adjusted to 37 ◦ C. The mixture was allowed to reach
37 ◦ C, 180 µL were pipetted into a 96-well microplate, and 30 µL of the sample were added.
The microplate was incubated in the dark for 30 min at 37 ◦ C, and then the absorbance was
measured at a 593 nm wavelength and transformed to reducing capacity using a standard
curve constructed for concentrations of FeSO4 ranging from 0 to 25 mM (5, 7, 9, 11, 15, 18,Antioxidants 2021, 10, 1174 9 of 20
21, 25 mM). The results are expressed in mol Fe2+ /kg of dry weight for extracts and mol
Fe2+ /L for wines.
2.6. Statistical Analysis
The determination of peak identity was performed through correlation of the retention
times with those of the reference standards. The analyte concentration was defined by
integrating the peaks and creating standard calibration curves utilizing LCquan 2.7.0.20
software (Thermo Fisher Scientific, Inc., Waltham, MA, USA). Standard deviations for
the LOD, LOQ assessments in triplicate were calculated using the statistical functions of
Microsoft Office 365. One-way analysis of variance (ANOVA) was used to test whether
there were significant differences between the mean values of different samples.
All results are presented as mean value ± standard deviation (SD) of experiments
performed in triplicate. For all calculations performed in this work, the Durbin–Watson
(DW) statistical tests for the residuals and the ANOVA table indicated that the P-value was
always less than 0.05.
3. Results and Discussion
The antioxidant phenolic compounds represent a class of bioactive compounds that is
responsible for the diverse health-beneficial properties of grapes, wines and vinification
byproducts [2–4,7]. Thus, the development of an efficient method for the accurate quan-
titation of their presence is of paramount interest and the subject of numerous research
endeavors [41–43].
The present study concerns the development and detailed validation of a versatile
method that allows the simultaneous determination of a library containing 32 of the
most common antioxidant phenolic compounds. The method developed was successfully
applied to samples of grapes; vinification byproduct extracts; and red, rose and white
wines. Furthermore, the antioxidant properties of extracts and wines were also evaluated.
3.1. Analytical Method Development
The novel analytical method refers to the simultaneous quantitation of the following
antioxidant phytochemicals in various types of samples: 12 phenolic acids (gallic, proto-
catechuic, coutaric, fertaric, caftaric, p-coumaric, o-coumaric, chlorogenic, caffeic, syringic,
ferulic, sinapic), 19 polyphenols (catechin, epicatechin, epigallocatechin, epigallocatechin
gallate, epicatechin gallate, procyanidin A2, procyanidin B1, procyanidin B2, quercetin,
myricetin, kaempferol, apigenin, hesperidin, isorhamnetin, trans-resveratrol, rutin, oenin,
trans-polydatin, quercetin-3-β-D-glucoside) and coniferyl aldehyde, which is a phenolic
compound extracted from cork stoppers into wine [44]. The method utilizes a LC–MS/MS
triple quadrupole instrument and is suitable for the analysis of samples from grapes, wines
and vinification byproducts. To date, the available analytical methods for the determination
of these compounds mainly concern the simultaneous detection of only a limited number
of compounds [45,46]. Thus, the efficient determination of their holistic phenolic profile
still constitutes the subject of several research efforts.
A crucial feature for the novel method’s development was the definition of the suitable
analytic conditions, which led to the efficient chromatographic separation of all target
compounds, ensuring their good resolution in a short run time (not exceeding 22 min). In
the few cases where an overlap between two compounds was observed, the application
of selected reaction monitoring (SRM) transition for each analyte proved sufficient for the
achievement of their proper identification and quantification. All analytes were detected
by utilizing their respective deprotonated molecules as precursor ions in negative polarity
[M-H]− expect for oenin (3-glucoside of malvidin), which was detected as a protonated
molecule in positive polarity [M+H]+ .Antioxidants 2021, 10, 1174 10 of 20
3.2. Analytical Method Validation
The accreditation of the novel analytical method was performed through the determi-
nation of the following validation parameters: linearity, limit of detection (LOD), limit of
quantification (LOQ), repeatability, precision, recovery and matrix effect.
3.2.1. Determination of Linearity, LOD and LOQ
The linearity of the method was tested by injecting in triplicate, a mixture containing
the 32 standard solutions of analytes plus an internal standard at seven concentration levels
(50, 100, 250, 500, 800, 1200 and 1500 ng/mL). For each standard, a calibration curve was
established, which was used for the determination of the respective coefficient (R2 ). The
data obtained are included in Table 2 and are indicative of the good linearity observed for
all analytes because in all cases the calculated R2 values ranged between 0.9988 and 0.9999.
The LOD and LOQ calculations were performed using Equations (1) and (2), respec-
tively. The respective results verified the good sensitivity of the method because the
obtained LOD values ranged from 7.5 to 158.3 ng/mL (Table 2).
3.2.2. Repeatability, Recovery and Matrix Effect
The method repeatability was tested by injecting 3 replicate samples with 250 ng/mL
concentration of each standard either during the same day (intra-day repeatability or
run-to-run precision) or over the course of three days (inter-day repeatability or day-to-day
precision). The intra- and inter-day repeatability was expressed as the relative standard
deviation (RSD). The calculated RSDs ranged from 0.8 to 13.7% for run-to-run precision
and from 0.9 to 14.4% for day-to-day precision, revealing a very good repeatability score
for almost all cases.
The recovery for each standard was calculated by spiking each compound into a
white wine sample for three quantity levels (low, medium and high). Next, the respective
recoveries were determined by comparing the values obtained for each added compound in
relation to the initial value of the compound contained in the sample. In particular, herein,
the recoveries were determined for concentrations of 80, 300 and 1500 ng/mL except for
analytes exhibiting LOD values < 50 ng/mL and LOQ < 100 ng/mL. For those compounds,
the recovery calculation required the utilization of an additional (lower) concentration level
(25 ng/mL). For all compounds, the calculated recovery values ranged between 74% and
120%, indicating the very good efficacy of the method (Table 3).
Table 3. Calculation of recovery, precision and ME (matrix effect) for each phenolic standard.
Intra-Day Inter-Day
Compound Recoveries % (±RSD) (n = 3) Precision Precision ME (%)
% (±RSD) % (±RSD)
25 80 300 1500 250 250
ng/mL ng/mL ng/mL ng/mL ng/mL ng/mL
Gallic acid 104.6–123.0 69.0–82.4 115.9–127.9 95.9–104.5 2.2 4.5 −20.4
Caftaric acid 104.8–107.6 100.2–105.4 92.6–104.0 94.7–98.5 3.7 11.8 18.0
Protocatechuic acid 95.1–102.9 98.8–101.6 111.9–117.5 100.4–106.0 13.7 8.0 −11.3
Procyanidin B1 - 92.5–104.7 104.4–109.4 79.5–92.3 5.6 0.9 −5.4
Epigallocatechin - 93.6–96.2 92.9–104.3 97.8–103.0 13.3 3.4 −21.0
Chlorogenic acid 79.5–83.7 62.0–76.0 73.4–78.8 76.5–79.9 8.6 14.4 4.3
Catechin - 72.3–75.1 76.9–82.5 79.6–83.4 4.9 2.9 −0.6
Coutaric acid - 89.4–95.0 89.4–95.0 75.9–91.7 3.9 8.2 3.1
Syringic acid - 91.6–103.4 99.9–108.3 109.6–116.0 9.5 1.1 28.0
Oenin 97.0–101.8 118.4–122.0 102.9–103.7 97.5–102.3 4.8 9.4 −22.0
Procyanidin B2 - 80.4–80.8 84.1–89.7 80.2–89.8 6.1 5.2 −5.7
Fertaric acid 91.0–108.2 92.5–104.7 100.2–105.4 94.9–98.5 6.1 5.0 12.9
Epicatechin - 84.1–90.3 78.8–80.8 87.8–100.4 10.0 7.0 10.5
Caffeic acid 113.8–121.9 96.7–99.5 107.8–112.0 115.7–117.3 5.3 3.5 19.2Antioxidants 2021, 10, 1174 11 of 20
Table 3. Cont.
Intra-Day Inter-Day
Compound Recoveries % (±RSD) (n = 3) Precision Precision ME (%)
% (±RSD) % (±RSD)
25 80 300 1500 250 250
ng/mL ng/mL ng/mL ng/mL ng/mL ng/mL
Epigallocatechin
- 76.3–77.3 87.4–91.2 96.2–97.4 7.7 3.6 35.5
gallate
Hesperidin - 79.0–84.4 72.2–75.8 65.1–77.9 7.9 7.4 8.7
trans-Polydatin - 84.0–88.0 98.0–107.0 84.6–85.4 3.9 5.0 9.7
Quercetin-3-β-D-
- 96.4–112.0 92.9–104.5 101.1–112.7 6.5 5.4 34.8
glucoside
Epicatechin gallate 94.9–115.7 73.4–81.8 69.1–82.7 69.8–82.6 4.0 2.9 18.9
Procyanidin A2 - 98.0–101.8 75.3–80.9 85.0–87.0 11.5 9.7 −0.5
Rutin - 71.2–85.0 71.9–79.1 71.2–85.0 2.9 2.3 24.3
p-Coumaric acid 103.2–121.6 69.6–74.8 83.8–85.2 113.7–115.7 4.3 5.2 15.2
Ferulic acid - 98.2–104.0 77.2–79.8 77.8–81.8 8.0 12.3 1.2
Sinapic acid - 104.6–110.4 65.6–81.2 78.8–83.2 7.9 11.2 2.8
trans-Resveratrol - 107.2–111.4 90.7–105.3 66.7–74.7 1.9 1.7 27.2
Myricetin 69.7–78.5 89.3–97.7 97.5–10.5 84.8–88.0 3.4 3.1 −19.9
o-Coumaric acid 79.2–84.4 89.6–110.0 82.0–101.4 78.1–84.7 3.9 1.7 −1.2
Coniferyl aldehyde 82.1–101.7 66.7–73.5 79.8–93.8 65.1–75.5 0.8 4.5 4.7
Quercetin 94.8–105.2 70.5–74.9 75.2–88.4 75.0–75.2 2.4 6.2 2.3
Apigenin 74.0–77.4 77.6–82.6 83.9±85.9 81.4–84.6 7.3 4.0 −14.8
Kaempferol - 70.3–73.6 73.1–76.5 87.7–90.3 1.3 2.0 −11.5
Isorhamnetin 102.9–106.1 88.0–94.4 83.2–87.8 75.2–77.6 6.4 5.4 0.4
Finally, it must be pointed out that the matrix effect (ME) elimination is significant
for the evaluation of an analytical method since is leading to a more realistic evaluation of
the samples in a wide range of concentrations. The best-recognized technique available
for ME correction refers to the internal standardization. In this study, the molecule of
2-(4-chlorophenyl) malonaldehyde was used as the internal standard, and the respective
ME was calculated using Equation (2). It is evident that a ME value around 0% is indicative
of ME absence. If ME is >0%, an ion suppression occurred, and for ME < 0%, an ion
enhancement effect is observed. Herein, the calculated MEs for all analytes studied wereAntioxidants 2021, 10, 1174 12 of 20
Table 4. Total phenolic (TPC), flavonoid (TFC) and tannin (TTC) contents of samples tested.
TPC TFC TTC
Grape Variety Color Part
(g GAE/kg) (g QE/kg) (g EE/kg)
Grape 0.18 ± 0.02 0.22 ± 0.01 12.3 ± 0.5
Mandilaria Red Pomace 5.1 ± 0.1 0.20 ± 0.02 15.6 ± 0.4
Stem 4.95 ± 0.08 0.299 ± 0.006 18.2 ± 0.8
Grape 0.287 ± 0.006 0.167 ± 0.004 0.53 ± 0.08
Monemvassia White Pomace 4.49 ± 0.08 0.22 ± 0.02 12 ± 1
Stem 14.0 ± 0.3 1.6 ± 0.1 64 ± 2
Grape 0.94 ± 0.03 0.32 ± 0.01 4.6 ± 0.1
Aidani mavro Red Pomace 0.25 ± 0.01 0.17 ± 0.02 9.5 ± 0.4
Stem 2.46 ± 0.02 0.274 ± 0.009 8.3 ± 0.4
TPC TFC TTC
Wine Appellation Color Grape Variety
(g GAE/L) (g QE/L) (g EE/L)
Paros Reserve Red Mandilaria 1.68 ± 0.02 0.127 ± 0.004 3.8 ± 0.1
Amphora White Monemvassia 0.30 ± 0.04 0.0227 ± 0.0007 0.56 ± 0.05
Rose Moraitis Rose Aidani mavro 0.22 ± 0.02 0.0175 ± 0.0004 0.38 ± 0.03
Data are reported on a dry weight basis. GAE: gallic acid equivalent; QE: quercetin equivalent; EE: epicatechin equivalent.
As expected, in all cases, the TFC values were lower as compared to the respective TPC
values. It must be noted, however, that in this case, the stems of the Monemvassia variety
were also determined to display the richest content (1.6 g QE/kg), while the remaining
samples showed comparable values.
Finally, grapes, wines and pomaces of both red varieties studied displayed the richest
tannin content (TTC), with stems exhibiting the highest tannin content. To our surprise,
the stems of Monemvassia, a traditional, native Greek white variety, displayed the highest
value amongst all tested samples (64 g EE/kg). This finding is indicative of the difference in
tannin content between the woody part of the plant and its crops and products. In addition,
it demonstrates the great potential for this variety’s vinification byproducts (pomace and
stems) to function as potent candidates for commercial exploitation toward the isolation of
extracts enriched with antioxidant phenols to be used for the production of cosmetics and
food supplements.
3.4. Phenolic Compound Quantitation
The identification of phenolic compounds was based on their mass-to-charge (m/z) val-
ues in both negative and positive ionization modes, while their quantitation was achieved
utilizing the calibration curves constructed with the respective standard compounds. The
respective results are presented in Tables 5–7. The concentration of each phenolic com-
pound is expressed as mg/kg of dry matter for vinification byproducts and lyophilized
grapes and as mg/L for the wine samples.
Table 5. Quantitation of phenolic compound content in the Mandilaria red variety (mg/kg DW) and wine (mg/L).
Compound Grapes Wine Pomace Stems
Gallic acid 2.5 ± 0.1 180 ± 7 54 ± 2 125 ± 8
Caftaric acid 171 ± 2 62 ± 1 ND ND
Protocatechuic acid ND 2.32 ± 0.10 13 ± 1 59 ± 8
Procyanidin B1 37.8 ± 0.5 14.7 ± 0.4 266 ± 3 942 ± 19
Epigallocatechin tr 0.55 ± 0.07 1.8 ± 0.1 8.9 ± 0.4
Chlorogenic acid ND ND ND ND
(+)-Catechin 74 ± 3 7.8 ± 0.4 1049 ± 16 1176 ± 43
Coutaric acid 48 ± 2 8.66 ± 0.08 5.20 ± 0.01 54 ± 2
Syringic acid ND ND 12 ± 3 ND
Oenin 142 ± 3 1.5 ± 0.04 28 ± 3 33 ± 9
Procyanidin B2 96 ± 4 3.7 ± 0.2 817 ± 10 21 ± 1
Fertaric acid 22.5 ± 0.9 6.6 ± 0.2 13.00 ± 0.05 72.9 ± 0.2Antioxidants 2021, 10, 1174 13 of 20
Table 5. Cont.
Compound Grapes Wine Pomace Stems
(–)-Epicatechin 181 ± 8 7.2 ± 0.3 1299 ± 7 71 ± 5
Caffeic acid ND 2.77 ± 0.04 ND ND
Epigallocatechin gallate ND ND tr 22.0 ± 1.0
Hesperidin ND ND ND ND
trans-Polydatin 12 ± 3 ND 8.41 ± 0.01 ND
Quercetin-3-β-D-glucoside ND 3.94 ± 0.09 66 ± 4 73 ± 3
Epicatechin gallate 3.0 ± 0.1 0.022 ± 0.006 4.4 ± 0.1 46 ± 3
Procyanidin A2 tr ND ND ND
Rutin 0.052 ± 0.001 ND ND ND
p-Coumaric acid ND 3.05 ± 0.07 tr 1.2 ± 0.2
Ferulic acid ND 0.22 ± 0.05 ND tr
Sinapic acid tr ND ND ND
trans-Resveratrol 1.1 ± 0.3 0.37 ± 0.08 tr 58 ± 4
Myricetin 1.76 ± 0.04 0.87 ± 0.03 0.92 ± 0.03 0.98 ± 0.01
o-Coumaric acid ND ND ND ND
Coniferyl aldehyde ND ND ND ND
Quercetin ND ND ND ND
Apigenin ND ND 6.0 ± 0.3 3.0 ± 0.2
Kaempferol ND 0.374 ± 0.009 ND ND
Isorhamnetin tr 0.60 ± 0.01 2.29 ± 0.02 1.77 ± 0.05
Data from the extracted samples are reported on a dry weight basis. ND: not determined; tr: trace. Data are presented as mean ± standard
deviation of three replicates.
Table 6. Quantitation of phenolic compound content in the Aidani mavro red variety (mg/kg DW) and wine (mg/L).
Compound Grapes Wine Pomace Stems
Gallic acid 1.06 ± 0.2 0.65 ± 0.02 70 ± 3 49 ± 2
Caftaric acid 33.5 ± 0.5 30.9 ± 0.6 ND ND
Protocatechuic acid 0.47 ± 0.07 0.64 ± 0.04 7.9 ± 0.5 24.3 ± 0.8
Procyanidin B1 25.1 ± 0.2 6.2 ± 0.2 66 ± 2 125 ± 7
Epigallocatechin tr 0.12 ± 0.03 1.8 ± 0.1 4.3 ± 0.3
Chlorogenic acid ND ND ND ND
(+)-Catechin 19 ± 1 6.1 ± 0.4 136 ± 6 127 ± 5
Coutaric acid 6.97 ± 0.09 5.7 ± 0.08 3.8 ± 0.3 24.1 ± 0.7
Syringic acid ND ND 12 ± 3 3.0 ± 0.5
Oenin 65 ± 1 0.446 ± 0.009 32 ± 2 1.9 ± 0.2
Procyanidin B2 37 ± 2 1.8 ± 0.2 146 ± 5 12.3 ± 0.6
Fertaric acid 23.9 ± 0.6 5.5 ± 0.2 3.6 ± 0.1 4.3 ± 0.3
(–)-Epicatechin 61 ± 4 6.9 ± 0.9 302 ± 14 49 ± 2
Caffeic acid ND 0.92 ± 0.02 ND ND
Epigallocatechin gallate ND ND ND 6.4 ± 0.3
Hesperidin ND ND ND ND
trans-Polydatin 4.46 ± 0.03 ND ND ND
Quercetin-3-β-D-glucoside ND 0.56 ± 0.02 10.6 ± 0.3 18.8 ± 0.4
Epicatechin gallate 1.7 ± 0.2 ND 7.9 ± 0.4 18.4 ± 0.5
Procyanidin A2 tr tr ND ND
Rutin tr ND ND ND
p-Coumaric acid ND 0.64 ± 0.04 ND ND
Ferulic acid ND 0.25 ± 0.04 ND 1.9 ± 0.2
Sinapic acid ND ND ND ND
trans-Resveratrol tr tr ND 33 ± 3
Myricetin tr ND ND 0.45 ± 0.01
o-Coumaric acid ND ND ND ND
Coniferyl aldehyde ND ND ND NDAntioxidants 2021, 10, 1174 14 of 20
Table 6. Cont.
Compound Grapes Wine Pomace Stems
Quercetin ND ND 11.5 ± 0.4 7.2 ± 0.3
Apigenin ND ND 1.5 ± 0.1 tr
Kaempferol ND 0.067 ± 0.007 4.4 ± 0.4 tr
Isorhamnetin ND 0.072 ± 0.002 2.4 ± 0.1 0.99 ± 0.01
Data from the extracted samples are reported on a dry weight basis. ND: not determined; tr: trace. Data are presented as mean ± standard
deviation of three replicates.
Table 7. Quantitation of phenolic compound content in the Monemvassia white variety (mg/kg DW) and wine (mg/L).
Compound Grapes Wine Pomace Stems
Gallic acid 2.77 ± 0.03 9±1 72 ± 5 40.3 ± 0.6
Caftaric acid 21.4 ± 0.3 35 ± 1 ND ND
Protocatechuic acid 4.2 ± 0.1 1.04 ± 0.05 11 ± 1 16.8 ± 0.6
Procyanidin B1 23 ± 2 11.0 ± 0.3 181 ± 7 400 ± 2
Epigallocatechin 0.47 ± 0.01 tr 2.9 ± 0.1 3.08 ± 0.08
Chlorogenic acid ND ND tr ND
(+)-Catechin 107 ± 9 6.4 ± 0.9 866 ± 8 387 ± 5
Coutaric acid 56 ± 3 3.11 ± 0.05 3.65 ± 0.03 8.67 ± 0.08
Syringic acid ND ND ND ND
Oenin 0.12 ± 0.01 ND 1.06 ± 0.01 0.57 ± 0.01
Procyanidin B2 31 ± 1 5.3 ± 0.2 760 ± 13 10.4 ± 0.4
Fertaric acid 154 ± 8 10.1 ± 0.1 4.4 ± 0.5 4.4 ± 0.2
(–)-Epicatechin 50 ± 2 8.2 ± 0.5 1901 ± 68 34 ± 1
Caffeic acid ND 2.4 ± 0.1 ND ND
Epigallocatechin gallate ND ND tr 5.51 ± 0.08
Hesperidin ND ND ND ND
trans-Polydatin 0.55 ± 0.08 ND ND 3.2 ± 0.2
Quercetin-3-β-D-glucoside 4.9 ± 0.3 1.56 ± 0.06 155 ± 3 54.3 ± 0.6
Epicatechin gallate 3.9 ± 0.2 ND 67 ± 2 19.0 ± 0.3
Procyanidin A2 1.0 ± 0.1 ND ND ND
Rutin tr ND ND ND
p-Coumaric acid ND 6.7 ± 0.4 ND ND
Ferulic acid tr 1.3 ± 0.2 1.1 ± 0.1 2.5 ± 0.2
Sinapic acid ND ND ND ND
trans-Resveratrol 6.0 ± 0.8 ND 1.8 ± 0.8 24.0 ± 0.9
Myricetin ND ND ND ND
o-Coumaric acid ND ND ND ND
Coniferyl aldehyde ND ND ND ND
Quercetin ND ND 13 ± 2 5.2 ± 0.2
Apigenin ND ND tr tr
Kaempferol 1.3 ± 0.1 0.097 ± 0.007 1.4 ± 0.1 ND
Isorhamnetin tr 0.027 ± 0.001 1.2 ± 0.3 ND
Data from the extracted samples are reported on a dry weight basis. ND: not determined; tr: trace. Data are presented as mean ± standard
deviation of three replicates.
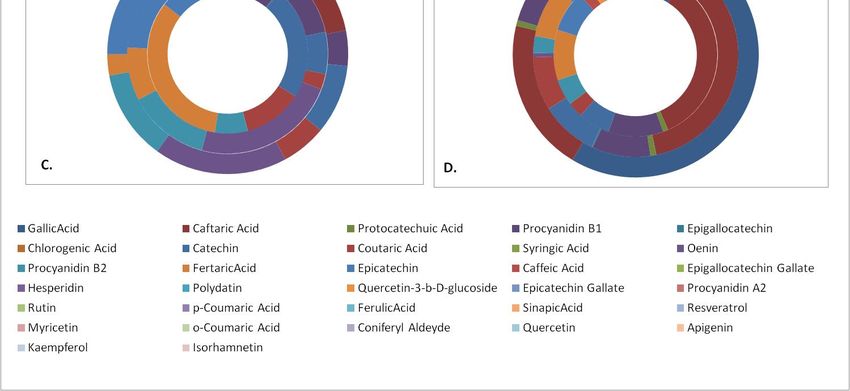
In order to facilitate the outcome comparisons, the polyphenols quantitation results
were cumulated in disk diagrams (Figure 1). Each disk is composed of an outer part
representing the contents of the Aidani mavro variety, a middle part for Mandilaria and an
inner part for the Monemvassia variety. There are four disks representing, respectively, the
phenolic contents of the pomace, stems, grapes and wines of the investigated varieties. In
general, the results indicated that pomaces and stems displayed the richest polyphenolic
content, which was composed of a variety of phenolic acids and flavonol monomers, dimers
and glycosides.
3.4.1. Grape Berries
The respective results (Tables 5–7) are indicative of the rich diversity of the detected
phenolic constituents in all grapevines tested, highlighting the phenolic compound contentAntioxidants 2021, 10, 1174 15 of 20
of Monemvassia, a white variety, as comparable to those of the red varieties. The most
notable difference among the phenolic profiles of the three varieties referred to their oenin
(malvidine-3-glycoside) content, which was exclusively detected in berries and wines of
red varieties. In respect to the presence of the remaining phenolic compounds, it was
evident that their bulk in all samples tested was composed of phenolic acids, especially
fertaric, coutaric and caftaric acids, which were assayed in concentrations ranging, respec-
tively, from 154.0 to 22.5, 56 to 23.9 and 171 to 21.4 mg/kg of dry material. Several other
acids were determined in lower concentrations. These results are indicative of the acidic
character of grapevine varieties native to Greek islands. The remaining bulk of the phenolic
compounds consisted of flavan-3-ol monomers and their glycosides, with prevailing com-
pounds monomers (+)-catechin and (–)-epicatechin, which were found in concentrations
ranging, respectively, from 107 to 19 and 181 to 50 mg/kg of dry material, while only
traces of the remaining flavonol monomers were detected. These results correlate well with
previous findings for grapevines from the Greek islands [47]. On the contrary, only low
amounts of flavonol glycosides were detected with the most abundant being epicatechin
gallate and quercetin-3-β-glucoside. In respect to the flavonol dimers, the presence of large
amounts of procyanidines B1 and B2 was detected in concentrations ranging from 37.8 to
23 and 96 to 31 mg/kg dry material, respectively. Finally, the presence of bioactive stilbene
Antioxidants 2021, 10, 1174 trans-resveratrol was detected in the white variety, while its glycoside, trans-polydatin,
16 of 21 was
present in large amounts in both red varieties tested.
FigureFigure 1. Phenolic compound content of samples studied. (A) pomace, (B) stems, (C) grapes and (D) wines. Varieties:
1. Phenolic compound content of samples studied. (A) pomace, (B) stems, (C) grapes and (D) wines. Varieties: inner
inner disk, Monemvassia; middle disk, Mandilaria; outer disk, Aidani mavro.
disk, Monemvassia; middle disk, Mandilaria; outer disk, Aidani mavro.
3.4.1. Grape Berries
The respective results (Tables 5–7) are indicative of the rich diversity of the detected
phenolic constituents in all grapevines tested, highlighting the phenolic compound con-
tent of Monemvassia, a white variety, as comparable to those of the red varieties. The most
notable difference among the phenolic profiles of the three varieties referred to their oeninAntioxidants 2021, 10, 1174 16 of 20
3.4.2. Grape Pomace
The direct comparison of the phenolic compound profiles detected in grape pomaces
(Tables 5–7) with those in grape berries revealed a series of significant differences in respect
to their qualitative and quantitative profiles. The investigated pomaces were particu-
larly rich in the monomeric flavon-3-ols (+)-catechin and (–)-epicatechin in concentrations
exceeding 1000 mg/kg. In addition, the presence of substantial amounts of flavonol glyco-
sides such as quercetin-3-β-glucoside and epicatechin gallate was also revealed. Pomace
samples were also determined as particularly rich in the flavonol dimers procyanidin B1
and B2 at concentrations ranging, respectively, from 266 to 66 and 146 to 760 mg/kg of dry
material. On the contrary, their content of phenolic acids was limited to only small amounts.
Finally, the concentration of stilbenes was significantly low because these phytoalexins
were particularly susceptible to degradation.
3.4.3. Grape Stems
Grape stems, the woody part of the grapevine, were found to display the highest TPC
values (Table 3). The quantitation of their polyphenolic compound content (Tables 5–7)
determined as the prevailing molecules the flavon-3-ol monomer (+)-catechin in concentra-
tions ranging from 1176 to 127 mg/kg of dry material and the flavonol dimer procyanidin
B1 (942 to 125 mg/kg of DM). The presence of various phenolic acids and flavonol dimers
was also detected in stems. The most characteristic finding refers to their particularly rich
content of trans-resveratrol, a very potent bioactive phenolic compound [17–19] with very
high added and market values. This is indicative of the great potential for grape stems for
use as a source for the production of bioactive extracts or molecules.
3.4.4. Wines
The great plethora of reactions involving phenolic compounds, carried out during the
winemaking and maturation processes (reactions of chemical and enzymatic oxidations,
condensation, hydrolysis, etc.) [47], results in the occurrence in wines of a complex profile
of diverse phenolic compounds. As was expected, red wine (Mandilaria) displayed the
richest and most diversified content of phenolic compounds, presumably because of the
variety [35] and the red vinification technique. The phenolic acid profile of this wine
was composed of a broader variety of molecules as compared to those of grape berries.
Prevailing compounds were gallic, caftaric, fertaric and coutaric acids (Table 5) with
gallic acid being the most abundant. The presence of several flavonol monomers, dimers
and glycosides was also revealed in smaller quantities. It is noteworthy, however, that
Monemvassia, a traditional native Greek variety, which was studied herein for the first
time, produced a white wine that was quite rich in phenolic compounds.
3.4.5. Stilbene Content
Stilbenes, represented by trans-resveratrol and trans-polydatin (known also as trans-
piceid), constitute the most prominent bioactive phytoalexins. They consist of two phenol
rings linked to each other by an ethylene bridge, and their presence in various grapevine
varieties and related derivatives is well-established. During the last decades, several stud-
ies have verified the diverse bioactivities of trans-resveratrol, emphasizing its particularly
potent antioxidant [17,19] and anticancer activities [18,19] along with numerous health
benefits including anti-inflammatory, cardioprotective, vasorelaxant, phytoestrogenic and
neuroprotective effects [48]. Accordingly, trans-polydatin, the 3-β-mono-D-glucoside glyco-
side (the natural precursor of trans-resveratrol), is also known for its prominent antioxidant
and antiproliferative activities [49].
Figure 2 shows the trans-polydatin and trans-resveratrol content of the samples studied.
It was evident that samples containing trans-resveratrol were particularly poor in trans-
polydatin and vice versa except Monemvassia stems and grapes and Aidani mavro grapes,
which contained both stilbenes. It must be noted that in all cases, stems were found toAntioxidants 2021, 10, 1174 17 of 20
contain the highest concentration of trans-resveratrol, indicating their great potential to act
as a rich source of this bioactive molecule.
3.5. Antioxidant Activity (DPPH· and FRAP Assays)
The antioxidant activities of samples tested were determined through DPPH· and
FRAP assays. The respective results are included in Table 8. The results for the DPPH·
Antioxidants 2021, 10, 1174 18 of 21
assay, which are expressed as IC50 values, determined that the stems of the Monemvassia
variety were substantially the most potent among the samples investigated. This result is
perfectly in line with all findings, which have indicated that stems of this variety displayed
and neuroprotective effects [48]. Accordingly, trans-polydatin, the 3--mono-D-glucoside
the glycoside
richest content of phenolic compounds and the higher TPC values. Regarding the
(the natural precursor of trans-resveratrol), is also known for its prominent an-
wine samples, those originated
tioxidant and antiproliferative from red
activities [49].grape varieties (red and rose wines) exhibited
significantly more potent antioxidant capacities.
Figure 2 shows the trans-polydatin and trans-resveratrol content of the samples stud-
Accordingly,
ied. It was evidentsimilar results were
that samples observed
containing for the determination
trans-resveratrol of the
were particularly reducing
poor in ca-
trans-polydatin
pacities and vice
of the samples versa except
studied, whichMonemvassia
were estimated stems andthe
with grapes
FRAP andassay
Aidani mavro
and highlighted
grapes,ofwhich
the stems contained bothvariety
the Monemvassia stilbenes. It must
as the most beactive
noted among
that in all
all samples.
cases, stems were among
Finally,
found to contain the highest concentration of trans-resveratrol,
the wines studied, the red wine, Paros Reserve, was by far the most potent.indicating their great po-
tential to act as a rich source of this bioactive molecule.
Figure 2. Distribution of trans-resveratrol and trans-polydatin content in samples studied.
Figure 2. Distribution of trans-resveratrol and trans-polydatin content in samples studied.
3.5. Antioxidant
Table 8. Results of DPPH and FRAP assays forActivity (DPPH and FRAP
the determination Assays) capacities of the investigated samples.
of antioxidant
The antioxidant activities of samples tested were determined through DPPH and
FRAP assays. The respective results are included in Table DPPH8. The results for theFRAP DPPH
Grape Variety Color Part
IC
assay, which are expressed as IC50 values, determined 50 that the stems of the Monemvassia DW
g TE/kg DW mol E-Fe(II)/kg
variety were substantially Grapes
the most potent among the samples
40.3 ± 0.3 investigated. This result
0.12 is
± 0.04
perfectly in line with all Pomace
findings, which have indicated that
30.2 ± 0.2 stems of this variety dis-
0.31 ± 0.05
Mandilaria Red
played the richest content of phenolic compounds and
Stems 24.20the
± higher
0.04 TPC values. Regarding
0.35 ± 0.07
the wine samples, those originated
Grapes from red grape varieties
69.6 ± (red
1.2 and rose wines)0.03
exhibited
± 0.01
Monemvassia significantly
White more potent antioxidant
Pomace capacities. 30.1 ± 0.1 0.32 ± 0.09
Accordingly, similar results
Stems were observed for5.634
the determination
± 0.009 of the reducing ca-
1.4 ± 0.4
pacities of the samples studied,
Grapes which were estimated with
67.4 ± 0.2 the FRAP assay and high-
0.06 ± 0.02
Aidani mavro lighted
Red the stems of the Monemvassia
Pomace variety as the most
33.31 active among all samples.
± 0.07 Fi-
0.21 ± 0.05
nally, among the wines studied,
Stemsthe red wine, Paros57.2Reserve,
± 0.1was by far the most
0.18potent.
± 0.04
Wine Appellation Color Grape Variety IC50 (mg TE/L) mol E-Fe(II)/L
Paros Reserve Red Mandilaria 0.047 ± 0.002 0.031 ± 0.003
Amphora White Monemvassia 0.121 ± 0.001 0.010 ± 0.002
Rose Moraitis Rose Aidani mavro 0.088 ± 0.002 0.014 ± 0.002
TE: Trolox equivalents; E-Fe(II): iron (II) equivalents. Data from the extracted samples are reported on a dry weight basis and presented as
mean ± standard deviation of three replicates.You can also read