The Survival of Family Farms: Socioemotional Wealth (SEW) and Factors Affecting Intention to Continue the Business - MDPI
←
→
Page content transcription
If your browser does not render page correctly, please read the page content below
agriculture

Article
The Survival of Family Farms: Socioemotional Wealth (SEW)
and Factors Affecting Intention to Continue the Business
Manel Plana-Farran *                 and José Luis Gallizo

                                          Faculty of Law, Economics and Tourism, Universitat de Lleida, 25001 Lleida, Spain; joseluis.gallizo@udl.cat
                                          * Correspondence: manel.plana@udl.cat; Tel.: +34-973-703-206

                                          Abstract: This article addresses the problem of succession in family farms in a context of generational
                                          change. Family businesses are characterized by their long-term orientation and by having a positive
                                          effect through environmental goals that remain in place generation after generation. The general
                                          increase in average age among farmers is seen as a barrier to more sustainable land use, and
                                          the survival of family farming therefore depends on the availability of a successor in the family.
                                          Socioemotional wealth (hereafter, SEW) is understood as the affective endowment of family members.
                                          This study adopts the SEW dimensions conceptually validated to analyse the effects of psychological
                                          and socioeconomic factors on potential successors’ intentions. The results of a survey administered to
                                          students attending agricultural schools in Catalonia show that intentions to assume the management
                                          and ownership of the family farm increase in line with individuals’ interest in creating their own
                                          business, their ability to take over the farm, and their emotional inclination to continue the family
                                          legacy. In addition, SEW was measured in relation to the potential successor and not the incumbent,
                                          as has typically been the case in previous work, bringing this important research subject as a principal

                                   actor. Finally, an empirical validation of a short FIBER scale, i.e., REI scale, was obtained that relates
                                          individuals’ intentions to succeed the family farm to the socioemotional wealth of business families,
Citation: Plana-Farran, M.; Gallizo,
                                          testing suitability of the REI scale as a measure of intention to succeed.
J.L. The Survival of Family Farms:
Socioemotional Wealth (SEW) and
Factors Affecting Intention to
                                          Keywords: family farms; succession; continuity; socioemotional wealth
Continue the Business. Agriculture
2021, 11, 520. https://doi.org/
10.3390/agriculture11060520
                                          1. Introduction
Academic Editor: Ayal Kimhi                     The intention to continue the business is essential for a smooth transition in manage-
                                          ment and the success of family businesses [1]. If we refer to succession in family farms
Received: 14 April 2021                   (hereafter, FFs), this is conditioned by the possibility of designating a successor or heir [2,3].
Accepted: 29 May 2021                     According to Suess-Reyes et al. [4], “The future of family farming does not only depend on
Published: 3 June 2021
                                          the farm’s adaptability to changing environments, but also on the family’s and specially the
                                          next generation’s sense of attachment to the business and its intention to successfully carry
Publisher’s Note: MDPI stays neutral
                                          the family’s heritage on into the future.” As such, the debate and research about intention
with regard to jurisdictional claims in
                                          to succeed FFs among the next generation is the cornerstone for researchers and policy
published maps and institutional affil-
                                          makers. In this vein, one of the main challenges with FFs obtaining transgenerational
iations.
                                          success is adequately preparing the next generation for providing continuity for the farms
                                          in the near future [5].
                                                According to Haberman and Danes [6], FFs are unique businesses in terms of their
                                          continuity, values, and expectations for succession, and they have their own characteris-
Copyright: © 2021 by the authors.         tics that condition their behaviour in decision-making. Rojas and Lorenzo [7] state that
Licensee MDPI, Basel, Switzerland.
                                          appointing a successor to guarantee the continuity of the farm positively moderates the
This article is an open access article
                                          effect of low profitability, while increasing the effect of setting environmental goals. Family
distributed under the terms and
                                          farming accounted for more than 19 of 20 farms across the EU [8], and similar statistics are
conditions of the Creative Commons
                                          seen for Catalonia and Spain in particular. The Eurostat Farm Structure Survey [8] shows
Attribution (CC BY) license (https://
                                          that 55.8% of European farmers are over 55 years of age, 31.4% are older than 65, and only
creativecommons.org/licenses/by/
                                          6% are younger than 35. This indicates the challenge to the future of rural development,
4.0/).

Agriculture 2021, 11, 520. https://doi.org/10.3390/agriculture11060520                                     https://www.mdpi.com/journal/agriculture
Agriculture 2021, 11, 520 2 of 16
i.e., the “young farmer problem”, which refers to the poor generational renewal rates in
the farming sector in the EU [9].
Family businesses are “characterized by visible and active owners, long-term orienta-
tion, collective identity, family values, emotional ownership, and a desire for the firm to
persist across generations” [10]. It is highly unlikely that the agricultural activity on the
farm will be assumed by an outside buyer, given the high investment necessary and the low
expected profitability [11], which is why families have the responsibility of designating a
successor to ensure the continuity of the farm. Chiswell [12] states that farming is the most
hereditary of occupations. The succession process is a concern among rural entrepreneurs
and is key to the survival of FFs [13]. In some cases, farmers are undecided about starting
the succession process, choosing a successor, or assigning responsibilities. To help the
process, different public administrations are developing strategies to support successors
in gaining greater awareness of the links between issues related to succession, business
longevity, and increased competitiveness [4].
Innovation capacity can be built through education and training, and a special focus on
women and youth [14,15] is highly recommended. These strategies are most deeply rooted
in agricultural schools, known as Agricultural Training Schools in Spain, and grouped
within the “European-International” School Network in Europe (https://europea.org
(accessed on 2 April 2021)). Among the aims of agricultural schools is that of encouraging
young people to enter the field by training them to guarantee the profitability of their
farms, recover self-esteem, and explain to society the importance of food production and
the services provided by farms. These educational centres constitute a meeting point for
young people who have made the decision to dedicate their working lives to agriculture
and who, in many cases, come from farming families. FFs are, in general, intergenerational,
so continuity depends on the availability of a successor in the family [16–18].
Education of heirs is another point that influences their decision to continue the
FFs. According to Aldando-Ochoa et al. [19] and Hennessy and Rehman [20], formal
education of the heirs of FFs decreases the probability of succession. However, as stated by
Chiswell [12], research does not consider the intention of successors, or factors affecting
the decision regarding FFs.
In view of the above situation, the research question would be: What are the psy-
chological and socioeconomic factors that influence succession intention related to family
farms? In Spain and particularly in Catalonia, this research question is important because
there is a problem of lack of vocation among young children of farmers, which could cause
a crisis of continuity for family farms. It is important for us to know the psychological
and socioeconomic factors that influence the transmission of control of family farms to the
next generation.
This study attempts to address the intention to continue the FFs in the case of young
members of family farms who study in agrarian schools. We used a set of data obtained
from 156 students from 13 agricultural schools in Catalonia that pertain to family farming.
This article addresses the intention of the interested party to succeed the family business,
investigating how SEW impacts on the will of continuing FFs and adopts the SEW literature
as a framework for identifying the psychological and socioeconomic factors involved in
making the decision to assume the succession [10,21]. In addition, a scale measuring SEW,
named REI (a short version of FIBER scale)—known as affective endowment in the context
of a family business—was validated for application with next-generation FFs’ members.
This research makes a contribution to the research on family farms and the intention
to continue them by empirically investigating how some of the main attributes of potential
successors (i.e., gender, entrepreneurship, considering agriculture as a viable career future,
and affective endowment) influence the intention of these successors to continue the family
farm. The results show that the ability and inclination of the potential successor to remain
in the family business—with men more likely than women—and to assume responsibility
for the management of the business are the most influential factors. The results obtainedAgriculture 2021, 11, 520 3 of 16
are relevant for identifying the succession intention of the heirs and for facilitating the
succession process in farming families.
Based on the responses obtained from the survey, a comparative inferential analysis
was performed on the intention to continue the family farm according to the intention
factors expressed by the respondents. Subsequently, a factor analysis was carried out to
establish a relationship between the aforementioned intention and the SEW of the respon-
dents belonging to family farms. The rest of the article is organized as follows: Section 2
provides a review of the previous literature and develops the theoretical framework on
which the research is based. The sample of respondents and the applied methodology are
explained in Section 3. Section 4 describes the inferential analysis and presents the results
obtained from the study, relating the intention to succeed to SEW. Finally, in Section 5 we
discuss the main findings and conclusions of our study and propose areas for future research.
2. Background and Factors Involved in the Intention to Continue the Family Farm
2.1. Family Farms: The Need to Manage a Generational Change
Family farms in Catalonia and around the world are currently experiencing very
serious economic, social, and environmental changes [4]. Food safety, sustainability of
production, increasing demands on quality standards, and changes in customer tastes have
contributed to a new scenario in which the agricultural sector is forced to act, and young
farmers must assume a leadership role [22].
More than 90% of the world’s farms and almost 75% of agricultural land are managed
by families [23]. The reasons range from FFs’ aim to satisfy the needs of the family [24] to the
use of family labour that allows for the adjustment of labour intensification [25]. Farm tasks
are carried out by family members in a more efficient, motivated way and with the ability
to understand the local environment [26]. Diversification to agricultural or nonagricultural
companies, intensification, or specialization are identified as key strategies for adapting
and facing the demands of the market and the pressures of the environment [27–29].
Generational change on farms is driven by required innovations in agricultural pro-
cesses, new technologies in agricultural work, and climate change, all of which have
direct consequences for the production model. The agrifood sector is therefore facing a
situation of change, challenge, and the need for constant adaptation that affects all its
actors, especially the potential successors of family farming [30]. At the same time, the
new generations do not see the agricultural world as attractive for their professional future.
Previous studies have pointed out the progressive decrease in the number of young people
joining in agricultural activities, an issue that is attributed to economic and social consider-
ations [17,26,31]. This lack of new interest in agriculture has led to a progressive increase
in the age of farmers and a lack of generational change in family farms [18]. Therefore,
the following subsections discuss the importance, benefits, and potential drivers of young
family members’ intentions to continue FFs in a changing scenario.
2.2. The Challenge of Succession and the Intention to Succeed
The problem of succession in an estate is normally decided by the family, which
chooses between heirs; however, the consent of the chosen person is essential for accepting
the responsibility for the management of a business. Chiswell [12] has suggested that suc-
cession in family farms be analysed from the perspective of potential or future successors,
rather than seeing them as marginal figures.
The low proportion of young people engaged in agriculture is a problem that affects
rural sustainability and concerns both government institutions and professional agricul-
tural organizations. Zagata and Sutherland [32] have argued that the low proportion of
young people on farms is perceived as a loss of potential when it comes to creating more
efficient, competitive, and sustainable farms in accordance with the demands derived from
the environment and the sector itself. In the EU, the continuous decline in the number of
young farmers is considered one of the main drawbacks of EU agriculture [33].Agriculture 2021, 11, 520 4 of 16
Succession planning is critical to the life of a family farm. It has been observed that,
when families cannot identify an heir, they either divest or develop a static management
mode, without progress, while farmer families that manage to identify an heir face a variety
of horizontal and vertical growth challenges that threaten the continuity of the farm in the
future [2].
In our use, intention is the attitude that individuals have towards taking over the
family farm. According to different theories, the stronger the intention, the more likely
this behaviour is to take place. However, it is well known that the lack of requirements
regarding behavioural skills, or the presence of environmental restrictions, can prevent
people from acting according to their intentions [34]. “Only when people have control over
behavioural performance is intention expected to be a good predictor of behaviour” [34].
In farm succession research, Duesberg et al. [35] conducted a qualitative study to
understand the perceptions of farmers without a successor regarding various land trans-
fer options, while Morais et al. [18] investigated to understand the beliefs underlying
successors’ intention to take over the farm. One possible use of the results of this study
would be to help farmer families to identify their heirs early by identifying the determining
characteristics of their intention to continue the business.
2.3. Factors Influencing the Intention to Continue the Family Farm
While, in many families, there are no explicit rules about succession, the decisions
families ultimately make include factors related to the number of successors, their gender,
the order of birth, their dedication, and their personal management skills [36].
Based on previous studies [37], we have identified the following factors that influence
the intergenerational succession of rural agricultural enterprises.
In a masculinized agricultural society, the gender of the successor plays a prominent
role in the succession process. The agricultural sector is a very male-oriented field [38].
Gender is one of the first individual identities; being natural, it cannot be chosen, and
it influences behaviour in more categorical ways that can be constructed later [39]. In
general, women are not perceived as eligible successors, especially when there are male
children. However, in recent years there has been a correction of this trend that needs to be
verified [40].
The age of the potential successor is also something to consider. Younger participants
who intend to continue their studies may think that their future will not be on the family
farm [41].
Commitment, understood as the intention of a potential successor to manage the
family farm, was identified as an important factor in previous research. The acquisition
of the family business was positively valued, and there were also positive perceptions
regarding the business management capacity and social pressure to control the family
property [18]. In our work, we asked respondents about their particular interest in con-
tinuing the family business, understanding that this is one of the main elements in the
decision-making process—that is, people are determined to dedicate their lives to the
activities of agricultural and livestock management.
The formal and informal knowledge of the agricultural environment and of the
particular farm can increase the intention of succession of the heir. It has been proven
that specific knowledge of the farm generates an incentive for young people to assume
the responsibility of continuing with the agricultural business [42,43], and that children’s
interest in agriculture is a factor to consider when analysing the characteristics of potential
and/or future successors of family farms [44]. Likewise, previous research has revealed
the need for complementarity of formal and informal knowledge in the agricultural sector.
Specifically, although local experience is valued, a new formal knowledge base is also
required, with new content and learning processes necessary for the transition to a more
sustainable agriculture [45]. Young people trained in this new knowledge will be more
willing to assume the generational transfer [45].Agriculture 2021, 11, 520 5 of 16
2.4. The Relationship between Intention of Potential Successors and Socioemotional Wealth (SEW)
Research has found that “family businesses limit the goal of maximizing profits in
exchange for maintaining control of the business and passing that control on to future
generations” [46]. In addition to economic ownership, FFs have affective values that
influence the succession process; these family business values have been grouped under
the concept of socioemotional wealth. SEW is understood as the “affective endowment of
family owners” [47]; that is, the benefits unrelated to profit that a family obtains from its
position as the owner of a company [47–49]. Unlike nonfamily farms, family-owned farms
attend to both economic and affective values in their decision-making process, and this is
the case of property transfer, where family entrepreneurs have the incentive to preserve
control for future generations [50].
This article looks at the SEW of potential successors to family farms. We assume that
the desire to preserve SEW motivates family farm owners to retain their legal ownership
and that this SEW goes beyond its financial objectives. This is the case with those family
farm owners who show a commitment to preserving the tradition of agriculture in the
region. For them, following a conservation strategy acts as a substitute to ensure the
emotional attachment of their successors to agriculture [51].
One aim of this study was to contribute to the literature on SEW and family businesses
by considering that an owner’s SEW should be studied in the cultural context in which
the family business exists. The young farmers who have participated in this study were
trained through formal and regulated programs at agricultural schools and learned values
of attachment to the land and respect for the environment, with the aim of joining the
family farming business and taking charge of it. These students’ intention to take over the
business is indicated by their willingness to continue the family tradition and the model
of life represented by working on the farm. These features corroborate the existence of an
“affective patrimony” that is not only in the hands of the family owners but also in the
hands of the potential and future successors. This leads us to suppose the existence of a
relationship between the heir’s intention to succeed the family business and the emotional
wealth of the family [12].
2.5. Development of Hypotheses
Identifying the impact of psychological factors and affective values that affect the
succession intention of young farmers is key for farming. The nature of SEW permits the
capture of the affective endowments and how they affect the intention to continue the FFs.
This was our starting point in identifying the impact of psychological and family farm
factors on the succession intention of the potential heirs of agricultural holdings. Following
it, our approach tried to predict the behaviour of the individual involved in the succession
debate, as determined by prospective-successors’ views about continuing the family legacy,
their sense of belonging to the business family, and their personal commitment, according
to SEW, as perceived by the successor—in the assumption of the farm, the individual
prioritizes the preservation of property and the protection of the agricultural community
over economic interests [51].
In this research, we explored the succession intention via the impact of some psycho-
logical factors that are present during the intergenerational succession process in family
farming. It is known that a FF’s continuity exerts a powerful influence on the development
of the farm (Chiswell, 2014). At that moment, the intention to take over the farm will
be greater if the successors consider that the following circumstances exist: viability of
their professional future, ability to take charge of the farm, and the desire to continue
the family legacy (socioemotional wealth). Based on this reasoning, we proposed the
following hypotheses:
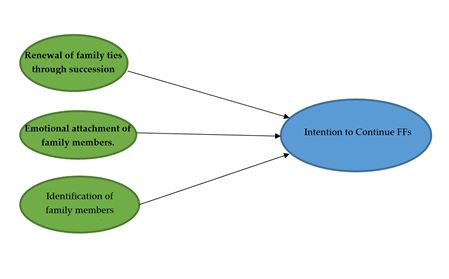
Hypothesis 1. The affective relationship and belonging to the FFs (SEW) exerts a positive influence
on the intention of the successors.Agriculture 2021, 11, 520 6 of 16
In order to obtain more information on the factors that influence the intention of
agricultural successors in Catalonia, we examined two background control variables:
gender and age (Table 1). These two factors were identified in previous studies as drivers
influencing the option to succeed the FF and discouraging the emigration of young people
away from rural areas [18].
Table 1. Comparative inferential analysis. Intention to continue the FFs depending on the gender and age of the participant
(n = 156).
Effect Size
Intention to Succeed (%) Chi-Squared Test
R2
FACTOR/Categories Total Sample (n = 156)
YES NO
Value p-Value
(88.5%) (11.5%)
Gender 5.57 * 0.018 0.036
Male (n = 148) 89.9% 10.1%
Female (n = 8) 62.5% 37.5%
Age 1.19 NS 0.754 0.008
15–20 years (n = 129) 87.6% 12.4%
21–25 years (n = 14) 92.9% 7.1%
26–30 years (n = 6) 100% 0.0%
>01 years (n = 7) 85.7% 14.3%
NS = Nonsignificant. * = Significant.
To establish the relationship between the student members of FFs’ succession intention
and the SEW, an abridged version REI was used [52]. We intend to evaluate the theoretical
construct of emotional wealth via the empirical FIBER scale [53].
The FIBER scale in the REI version consists of 16 items in Likert format with five
options, configured on three dimensions: (a) R—Renewal of family ties through suc-
cession, four items; (b) E—Emotional Relationship of family members, six items; and (c)
I—Identification of family members with the company, another six items. Moreover, the REI
scale has been revalidated for the population of students of agrarian schools that belong to
FFs. A factor analysis by principal components was applied to verify the unidimensionality
of each set of items with the dimension to which they theoretically belong.
For the present statistical analysis, and with the intention that a higher score in the
variable is interpreted as a higher degree (greater domain) in the dimension evaluated,
the responses of the respondents were recoded on a scale of 1 = completely disagree to
5 = strongly agree.
3. Methodology
3.1. Participants and Context
Our field of action in this research comprised agricultural schools, and we obtained
the data of young people planning to join the farming business, who in most cases belonged
to farming families.
The target group was 161 students belonging to family farms who enrolled in Catalan
agricultural schools. The dataset was based on agricultural school students who were
training to work in agriculture and belonged to family farms. Thirteen agricultural schools
are present in the region, and they depend on the Departments of Agriculture and Ed-
ucation. The training courses are recognized by the Catalan Department of Agriculture
and give qualified students eligibility for EU young farmers’ subsidies. Of the total of 161,
5 students had to be excluded from the study because they did not answer some of the
questions. Thus, the final sample consisted of 156 students. Participants’ age ranged from
15 to 31 years old. The most common age was 15 to 20 (71.9%).Agriculture 2021, 11, 520 7 of 16
3.2. Procedure
In order to reach as many students as possible, a schedule was agreed with the
management of each agrarian school. We visited each school (thirteen in total, around
all Catalonia), explaining the objective of the study. Participation was anonymous and
not mandatory. In order to avoid any potential misunderstandings or mistakes, we were
present during the process of survey completion. The data collection was completed
during 2019.
3.3. Instruments and Measures
In the present investigation, a questionnaire with different sections was used. A section
about demographic variables was utilized in order to ask the students about their gender,
age, and the intention to succeed FFs. An additional section was used to assess the
student’s situation with regard to his or her intrinsic factors. Finally, the last section was
the REI scale, which measured three dimensions (i.e., Renewal of family ties through
succession; Emotional attachment of family members; Identification of family members
with the company).
3.4. Statistical Analysis
The obtained data were analysed using Statistical Product and Service Solutions (SPSS)
version 22 (IBM Corporation, 2017, IBM SPSS Statistics v 25.0 for Windows; Armonk, NY,
USA). The distribution of frequencies and percentages was used with the qualitative (nom-
inal) variables, with an estimate of 95% confidence intervals. For quantitative variables,
the data were explored using the Q–Q plot for normality fit, histogram, coefficients of
skewness, and kurtosis/height, together with the Kolmogorov–Smirnov goodness-of-fit
test and description with the usual tools of centrality (mean, median) and variability (stan-
dard deviation and range). Regarding the reliability of our measurement scale, this was
estimated with Cronbach’s α coefficient and intraclass correlation.
Exploratory factor analysis by principal components was used to discover the internal
structure of variables being used to detect the relationship between the different variables.
Moreover, the Mann–Whitney–Wilcoxon test, a nonparametric test that contrasts whether
two samples proceed from an evenly distributed population, was used to test significant
differences between the means of groups, for example, when comparing intention to
succeed FFs with level of SEW. In addition, the effect size was estimated using R2 and the
chi-square test, for the crossover of categorical variables (R2 estimated from Cramér’s V).
Finally, the usual 5% level of significance was established (significant if p < 0.05), except in
the KS goodness-of-fit test, where only serious deviations were considered significant, that
is, at 1% (p < 0.01).
4. Results
4.1. Inferential Analysis
In the first place, we proceed to describe this sample of students attending agricultural
schools, all of whom were related to a family farm. The majority of students in the
general sample who came from FFs were men: 94.9%. The majority were between 15 and
20 years old: 82.7%. Additionally, the majority (88.5%) were conducting their studies to
continue with the farm of the family, based on question that sought to capture the intention
to succeed.
The gender of the potential heir was one of the first factors to consider. There was a
statistically significant relationship (p < 0.05) between the intention to continue with the
FFs and sex (a slight effect of 3.6%), such that we can admit that this intention was higher
among men than among women (89.9% vs. 62.5%). However, there was no statistically
significant relationship (p > 0.05) with age (almost null effect:The gender of the potential heir was one of the first factors to consider. There was a
statistically significant relationship (p < 0.05) between the intention to continue with the
FFs and sex (a slight effect of 3.6%), such that we can admit that this intention was higher
among men than among women (89.9% vs. 62.5%). However, there was no statistically
Agriculture 2021, 11, 520 significant relationship (p > 0.05) with age (almost null effect: 0.300),
(>0.300),so
so that the
that the
reliability of this dimension was good (0.664), (Table
reliability of this dimension was good (0.664), (Table 2). 2).
2. Unidimensionality
Table 2.
Table Unidimensionalityand
andreliability.
reliability.Dimension:
Dimension:R—Renewal
R—Renewalof of
family tiesties
family through succession
through succes-
of the REI (n = 156).
sion of the REI (n = 156).
Descriptive
Descriptive Factor
FactorAnalysis by C.P.
Analysis by C.P.
ITEM
ITEM Reliability
Reliability
Average
Average(D.E.)
(D.E.) Commonality
Commonality Factor
FactorLoad
Load
SEW—R1
SEW—R1 4.43 (0.72)
4.43 (0.72) 0.381
0.381 0.617
0.617 0.359
0.359
SEW—R2
SEW—R2 3.82
3.82(0.94)
(0.94) 0.442
0.442 0.665
0.665 0.409
0.409
SEW—R3
SEW—R3 4.05(1.17)
4.05 (1.17) 0.536
0.536 0.732
0.732 0.474
0.474
SEW—R4
SEW—R4 4.17 (0.93)
4.17 (0.93) 0.661
0.661 0.813
0.813 0.574
0.574
Total
Total 16.47(2.69)
16.47 (2.69) ---— 500.49%
500.49% 0.664
0.664
2. Dimension E (Figure 2) refers to the emotional attachment of family members, consid-
ering whether these bonds are strong or not. This dimension reports on the emotional
proximity of each of the members with reference to the family and the company.2.
2. Dimension
Dimension E E (Figure
(Figure 2)
2) refers
refers to
to the
the emotional
emotional attachment
attachment of
of family
family members,
members, con-
con-
sidering
sidering whether these bonds are strong or not. This dimension reports on
whether these bonds are strong or not. This dimension reports on the
the emo-
emo-
Agriculture 2021, 11, 520 9 of 16
tional
tional proximity
proximity of
of each
each of
of the
the members
members with
with reference
reference to
to the
the family
family and
and the
the com-
com-
pany.
pany.
Figure
Figure 2.
2. Statements
Statements and
and scales
scales used
used for
for the
the measurable
measurable items
items that
that represent
represent SEW
SEW dimension
dimension E. Source:
E. Source: [54].
Source: [54].
[54].
In
In our
In our results,
our results, (Table
(Table 3)
results, (Table 3) the
3) the mean
the mean values
mean values of
values of all
of all the
all the items
the items of
items of dimension
of dimension E
dimension E were
E were high
were high
high
(between
(between 4.11
(between 4.11 and
4.11 and 4.33),
and 4.33), indicating
4.33), indicating favourable
indicating favourable opinions
favourable opinions
opinions ofof potential
of potential successors
successors towards
potential successors towards
towards
the content
the content of each
each one. TheThe values of of the communalities
communalities were very very high, and
and the factorial
factorial
the content ofof each one.
one. The values
values of the
the communalities were were very high,
high, and the
the factorial
weights
weights were as well (between 0.730 and 0.825). This demonstrates the one-dimensional
weights were
were asas well
well (between
(between 0.730
0.730 and
and 0.825).
0.825). This
This demonstrates
demonstrates the the one-dimensional
one-dimensional
belonging of
belonging ofthese
thesesixsixitems
itemstoto dimension E emotional
of emotional attachment. Likewise,relia-
the
belonging of these six items to dimension E of emotional attachment. Likewise,
dimension E of attachment. Likewise, the
the relia-
reliability
bility indices of these items were high (>0.600), which generated a high reliability
bility indices
indices of
of these
these items
items were
were high
high (>0.600),
(>0.600), which
which generated
generated aa high
high reliability
reliability coeffi-
coeffi-
coefficient
cient (0.857).
cient (0.857).
(0.857).
Table 3.
Table Unidimensionality and reliability. Dimension E—Emotional Attachment of family members
Table 3.3. Unidimensionality
Unidimensionality and
and reliability.
reliability. Dimension
Dimension E—Emotional
E—Emotional Attachment
Attachment ofof family
family mem-
mem-
of the
bers REI (n = 156).
bers of
of the
the REI
REI (n
(n == 156).
156).
Descriptive
Descriptive
Descriptive FactorAnalysis
Factor
Factor Analysis by
Analysis byC.P.
by C.P.
C.P.
ITEM
ITEM
ITEM Reliability
Reliability
Reliability
Average
Average(D.E.)
Average (D.E.)
(D.E.) Commonality
Commonality
Commonality Factor
Factor Load
Factor Load
Load
SEW—E1
SEW—E1
SEW—E1 4.11
4.11(0.97)
4.11 (0.97)
(0.97) 0.652
0.652
0.652 0.807
0.807
0.807 0.699
0.699
0.699
SEW—E2
SEW—E2
SEW—E2 4.33
4.33(0.76)
(0.76)
4.33 (0.76) 0.539
0.539
0.539 0.734
0.734
0.734 0.611
0.611
0.611
SEW—E3
SEW—E3 4.17(0.82)
4.17 (0.82) 0.680
0.680 0.825
0.825 0.722
0.722
SEW—E3 4.17 (0.82) 0.680 0.825 0.722
SEW—E4 4.13 (0.83) 0.533 0.730 0.606
SEW—E4
SEW—E4 4.13
4.13 (0.83) 0.533 0.730 0.606
SEW—E5 4.16(0.83)
(0.84) 0.533
0.539 0.730
0.734 0.606
0.614
SEW—E5
SEW—E5
SEW—E6 4.16
4.31(0.84)
4.16 (0.84)
(0.86) 0.539
0.539
0.567 0.734
0.734
0.753 0.614
0.614
0.629
SEW—E6
SEW—E6 4.31
4.31 (0.86)
(0.86) 0.567
0.567 0.753
0.753 0.629
0.629
Total 25.22 (3.89) — 58.49% 0.857
Total
Total 25.22
25.22 (3.89)
(3.89) ---
--- 58.49%
58.49% 0.857
0.857
3.
3. Dimension
DimensionIII(Figure
Dimension (Figure3)
(Figure 3) refers
3) refers to
refers to the
to the identification
identification of
identification of family
of family members
family members with
members with the
the agri-
agri-
cultural exploitation,
cultural exploitation,
cultural where
exploitation, where
where thethe members
the members
members havehave
have a strong sense of belonging and aa
a strong sense of belonging and
great personal
great personal
great commitment
personal commitment towards
commitment towards the
towards the business,
business, to
the business, to the
to the point
point of
of feeling
feeling proud
proud toto
communicate
communicate to
communicate to others
to others that
others that they
that they belong
they belong to
belong to the
the family
family business.
business.
Figure 3. Statements and scales used for the measurable items that represent SEW dimension I. Source: [54].
The mean values of the six items of the dimension that summarize the identification
of the family members were high (between 3.95 and 4.33), which implies a high degree
of agreement with the statements. The communalities were high (>0.500), and the factorFigure 3. Statements and scales used for the measurable items that represent SEW dimension I. Source: [54].
Agriculture 2021, 11, 520 The mean values of the six items of the dimension that summarize the identification 10 of 16
of the family members were high (between 3.95 and 4.33), which implies a high degree of
agreement with the statements. The communalities were high (>0.500), and the factor
loadings were also high (between 0.670 and 0.804). Consequently, we can conclude the
loadings were alsoofhigh
unidimensionality (between
this set of items0.670
withand 0.804).
respect Consequently,
to dimension we canthe
I. Likewise, conclude the
reliability
unidimensionality of this set of items with respect to dimension I. Likewise, the reliability
indices of these items were high (>0.500), so the reliability coefficient of the full dimension
indices
was alsoof these
high items(Table
(0.810) were high
4). (>0.500), so the reliability coefficient of the full dimension
was also high (0.810) (Table 4).
Table 4. Unidimensionality and reliability. Dimension I—Identification of family members with the
Table 4. Unidimensionality
company of the REI (n = 156).and reliability. Dimension I—Identification of family members with the
company of the REI (n = 156).
Descriptive Factor Analysis by C.P.
ITEM Descriptive Factor Analysis by C.P. Reliability
Average (D.E.) Commonality Factor Load
ITEM Reliability
SEW—I1 Average
3.95 (D.E.)
(1.07) Commonality
0.531 Factor
0.729 Load 0.596
SEW—I2
SEW—I1 4.12 (0.92)
3.95 (1.07) 0.449
0.531 0.670
0.729 0.538
0.596
SEW—I2
SEW—I3 4.12 (0.92)
4.32 (0.84) 0.449
0.546 0.670
0.739 0.538
0.580
SEW—I3
SEW—I4 4.32 (0.84)
4.19 (0.91) 0.546
0.647 0.739
0.804 0.580
0.666
SEW—I4 4.19 (0.91) 0.647 0.804 0.666
SEW—I5
SEW—I5
4.33 (0.82)
4.33 (0.82)
0.492
0.492
0.701
0.701
0.536
0.536
SEW—I6
SEW—I6 4.01 (1.02)
4.01 (1.02) 0.447
0.447 0.668
0.668 0.526
0.526
Total
Total 24.90 (4.02)
24.90 (4.02) ---— 51.86%
51.86% 0.810
0.810
In summary, the obtained results adequately guarantee (1) the belonging of these
In summary, the obtained results adequately guarantee (1) the belonging of these
items to the theoretically expected dimension, (2) the sufficient reliability of each of the
items to the theoretically expected dimension, (2) the sufficient reliability of each of the
items, and (3) the high reliability of each of the items.
items, and (3) the high reliability of each of the items.
4.3.
4.3.Confirmatory
ConfirmatoryFactor
FactorAnalysis
Analysisfor
forApplicability
ApplicabilityofofREI
REIScale
Scale
InInorder
order to revalidate the use of the REI scale in thepopulation,
to revalidate the use of the REI scale in the population,aaconfirmatory
confirmatoryfactor
factor
analysis
analysiswaswasused.
used.Figure 4 presents
Figure thethe
4 presents validated
validated model,
model,with the the
with three dimensions
three in-
dimensions
tercorrelated
intercorrelated with each other, together with the items that we have just demonstratedto
with each other, together with the items that we have just demonstrated to
belong
belongtotoeach
eachofofthem.
them.
Figure 4. Correlation diagram of the confirmatory factor analysis. Items and dimensions are from
the REI scale. n = 156 students from agrarian schools with FFs.
The fit of the data with the model was studied using the goodness-of-fit index (Table 5).
The value of the RMSEA index was found to be below the 0.080 cutoff, with both its lower
value (0.065) and almost all of its CI (95%): 0.047–0.082); therefore, it does not generate
doubts about the optimal fit of the data to the model. In the same sense, the other indicesAgriculture 2021, 11, 520 11 of 16
(NFI, IFI, TLI, CFI) exceeded the minimum cut-off (0.800) and generally even the value
0.900 was considered as a large adjustment. Finally, the chi-square test ratio was less than 3,
which confirmed the good fit. In short, the fit of the theoretical model that we were trying
to test with the empirical data was good enough so that the result of the CFA obtained
could be considered as reliable.
Table 5. CFA: Goodness-of-fit. Questionnaire REI (n = 156 students of Agrarian Schools, members
of FFs).
Model RMSEA NFI IFI TLI CFI Cmin/DF
Three dimensions 0.065 0.850 0.935 0.921 0.934 1.65
This CFA result is summarized in Table 6 for clarity of discussion. We can verify that:
(1) the items have high standardized coefficients (>0.500) in the dimension to which they
must belong, and (2) and the dimensions are highly related to each other as proposed in
the model.
Table 6. Confirmatory Factor Analysis. REI Scale (n = 156 students of Agrarian Schools, members
of FFs).
N◦ Ítem PART AU.LID AP.SIG
SEW—R 1 0.518
SEW—R 2 0.596
SEW—R 3 0.510
SEW—R 4 0.710
SEW—E 1 0.788
SEW—E 2 0.648
SEW—E 3 0.764
SEW—E 4 0.684
SEW—E 5 0.679
SEW—E 6 0.682
SEW—I 1 0.630
SEW—I 2 0.586
SEW—I 3 0.697
SEW—I 4 0.763
SEW—I 5 0.664
SEW—I 6 0.551
DIMENSIONES R E I
R – 0.948 0.871
E 0.948 – 0.855
I 0.871 0.855 –
4.4. REI Dimensions and Intention to Continue the FFs
In the next stage, we studied the relationship between the variables of these three
REI dimensions and succession intention, for which a contrast test of the significance of
the difference in means was carried out. Due to the lack of adjustment to normality, a
nonparametric method was chosen, the Mann–Whitney U Test. The existence of significance
implies that there was a relationship between SEW and the succession intention and that
the REI variables were explanatory factors of it. The contrast test was also accompanied
by the estimation of the effect size in R2 , from the value of Cohen’s d. The results are
summarized in Table 7.Agriculture 2021, 11, 520 12 of 16
Table 7. Comparative inferential analysis. Differences in the SEW based on the students’ succession intention (n = 156).
Student Succession Intention
Mann–Whitney Test
Total Sample (%) Effect Size
DIMENSION VARIABLES
(n = 156) Yes Not R2
p-Value
(88.5%) (11.5%)
R—Renewal of family ties
3.25 ** 0.001 0.101
through succession
Mean (standard deviation) 16.47 (2.69) 16.78 (2.44) 14.11 (3.39)
Minimum/Max. values 7/20 8/20 7/20
E—Emotional relationships of
4.38 ** 0.000 0.189
family members
Mean (standard deviation) 25.22 (3.89) 25.83 (3.16) 20.56 (5.58)
Minimum/Max. values 8/30 11/30 8/28
I—Identification of family
3.66 ** 0.000 0.139
members with the company
Mean (standard deviation) 24.90 (4.02) 25.44 (3.52) 20.78 (5.17)
Minimum/Max. values 9/30 15/30 9/29
** = Highly significant.
Dimension R. It was observed that the mean value in this variable was higher in the
group of subjects who intended to continue with the FFs (16.8 vs. 14.1), a difference that we
must consider as highly significant with p < 0.01 and that corresponds to a moderate–high
effect size (10.1%).
Agriculture 2021, 11, x FOR PEER REVIEW 13 of 17
Dimension E. Once again, it was found that the mean value of the participants who
answered that they would continue with their EAF was higher than those who said they
would not (25.8 vs. 20.6). This difference is highly significant (p < 0.001) and is equivalent
Dimension I. Similar to the previous dimensions, in this final dimension, it was again
to an effect size that is already considered large (18.9%).
found that the average values of the respondents who intended to take over the family
Dimension I. Similar to the previous dimensions, in this final dimension, it was again
business was higher than the average of those who said they would not continue (25.4 vs.
found that the average values of the respondents who intended to take over the family
20.8). This difference was also highly significant (p < 0.001) and equivalent to an effect size
business was higher than the average of those who said they would not continue (25.4 vs.
that, although somewhat smaller than the previous one, is still large (13.9%).
20.8). This difference was also highly significant (p < 0.001) and equivalent to an effect size
To contrast the H1, given the positive influence of the SEW on the intention of the
that, although somewhat smaller than the previous one, is still large (13.9%).
successors, we have developed an abridged version of the REI [54], empirically
To contrast the H1, given the positive influence of the SEW on the intention of the
revalidated according to the results obtained in the preceding section. With this version,
successors, we have developed an abridged version of the REI [54], empirically revalidated
we intend to evaluate the theoretical construct of emotional wealth with the empirical
according to the results obtained in the preceding section. With this version, we intend to
validation of the scale. (Figure 5)
evaluate the theoretical construct of emotional wealth with the empirical validation of the
scale. (Figure 5)
Figure 5. REI scale and intention to continue FFs. A comparative inferential analysis. Intention to
continue the FFs depending on SEW student’s level.
Figure 5. REI scale and intention to continue FFs. A comparative inferential analysis. Intention to
5. Discussion
continue and Conclusions
the FFs depending on SEW student’s level.
This study analysed the intention to take over the family business among students
5. Discussion
who belonged andtoConclusions
a family farm and attended agricultural school. It was based on the
theoretical
This studyframework of the
analysed the SEW literature
intention andthe
to take over thefamily
application of REI
business dimensions
among students to
who belonged to a family farm and attended agricultural school. It was based on the
theoretical framework of the SEW literature and the application of REI dimensions to
analyse the intention to succeed FFs [54]. The results obtained from the comparative
inferential analysis on intrinsic factors related to the student indicated that genderAgriculture 2021, 11, 520 13 of 16
analyse the intention to succeed FFs [54]. The results obtained from the comparative
inferential analysis on intrinsic factors related to the student indicated that gender strongly
influences these students’ intention to take over the family farm. Moreover, the rest of the
results obtained shed light on a key aspect for renewal and continuity in farming, i.e., the
commitment of these students to succeed FFs.
This study revealed some significant findings that may contribute to the literature
on both family farming and family business. More specifically, this study found that the
SEW scale (REI) fits well for studying family-farming future-successors; moreover, the
results have shown that level of SEW affects positively the intention to continue family
farms. According to these results, a relationship was observed between the SEW level of
students and the intention of succession. Specifically, we obtained: (a) a high degree of
agreement with the belief in the renewal of family ties through dynastic succession, (b) a
high degree of emotional attachment of family members to FFs, and (c) a high degree of
family identification with the company. The high factorial scores explain that the existence
of a sense of belonging and commitment of the young FF members positively influence the
succession intention of the potential successors. Hence, we state these factors are facilitators
of succession intention.
The REI scale allowed us to use an instrument designed to analyse the level of so-
cioemotional wealth (SEW) to test H1 with respect to the intention to take over the family
farm. From this analysis, three factors were obtained that summarize the influence of the
affective endowments of the family on the control and transfer of the company. The first,
“family ties”, is related to the importance of continuing the family legacy and tradition. In
this regard, it was found that prioritizing succession and family elements over economic
motivations played a major role in determining the intention of the possible successors
to succeed the family farm. Staying in control and transferring the business to future
generations is an important motivation among FFs’ holders to extend the useful life of
the farm. For Inwood and Sharp [2], agricultural families that prioritize succession and
noneconomic domestic factors implement a wide range of growth and innovation strategies
in agricultural production that, ultimately, contribute to the persistence and resilience of
the farm. In this dimension, we observe that prioritizing succession and family elements
over economic motivations are characteristics that give a high weight to the succession
intention of potential successors.
The second factor, “emotional attachment”, obtained a high score for all its items,
showing that the existence of an affective relationship between family members makes it
more likely that a potential successor will decide to accept the inheritance. The emotional
bond of the family has been considered important in the succession process; in fact, in
previous research it has been shown that trust and communication between family members
have a strong influence on the succession process [54–57]. According to the study by
Morris et al. (1997) [58], problems within the family and emotional detachment were the
main factors that led to 60% of failed successions among the companies studied. The third
factor, “identification of relatives with the FF”, explains the high influence that the sense
of belonging and the personal commitment of the members of a family-run agricultural
business have on the intention to continue the farm.
In the end, the results obtained determine the intrinsic and socioemotional factors of
agricultural school students that facilitate the process of incorporation to FFs. Knowledge
of these factors is useful to better understand the generational transition process. The
practical implications of this study include the actions that parents and older relatives can
take with respect to future generations. These should be actions aimed at helping potential
successors to obtain greater knowledge of the business, encouraging them to share the
objectives of the company, and transmitting a sense of belonging, thereby enhancing the
affective relationship of family members. These are elements that must be present in
farming families to improve the intention of succession of their heirs.
Our insights into the intention to continue FFs and bring the successor into focus offer
relevant and insightful managerial implications. Increasing attention to economic, social,Agriculture 2021, 11, 520 14 of 16
psychological, and emotional aspects of FFs’ successors is capital for the present and future
of family farming. This idea goes in line with the findings shown by Arzubiaga et al. [59],
who specifically highlighted the importance of taking care of the socio-emotional aspects
of new successors when facing and designing succession processes.
This study has some limitations that offer opportunities for future research. This
study focuses on a region, Catalonia, and on farming school students. Therefore, any
conclusions should be interpreted carefully in other regions [60], in other FFs’ potential
successors, or in other family farming collectives. As such, these results call for different
settings to theorize about emotional attachment and continuity in family farming, and
future research should take advantage of integrating findings across different contexts
and regions, deepening and building more cumulative research results. FFs’ succession
is supported by considerable research in domains other than the domain of the potential
successor, [12]; however, more research is needed to enrich the family farming literature
from an emotional and psychological perspective. For example, future research is needed
to assess whether and to what extent our findings apply to other agrarian regions or to
family farming principals. Our findings indicate the opportunity of future research to
explore the emotional implication and commitment to family farming. The level of FFs’
continuity represents a challenge for the future of farming.
Author Contributions: All the authors contributed to conceptualization, formal analysis, investiga-
tion, methodology, and writing and editing the original draft. All authors have read and agreed to
the published version of the manuscript.
Funding: This research received support from the Family Business Chair of the University de Lleida.
Institutional Review Board Statement: Informed consent was obtained from the respondents of
the survey.
Informed Consent Statement: Informed consent was obtained from all subjects involved in the study.
Data Availability Statement: The data will be made available on request from the corresponding author.
Acknowledgments: We want to thank the support received from the Catalan Ministry of Agriculture,
Departament d’Agricultura, Ramaderia, Pesca i Alimentació.
Conflicts of Interest: The authors declare no conflict of interest.
References
1. Polcyn, J. Eco-Efficiency and Human Capital Efficiency on the Example of Small and Medium-Sized Family Farms in the Selected
European Countries. Preprints 2021, 2021040192. [CrossRef]
2. Inwood, S.; Sharp, J. Farm persistence and adaptation at the rural–urban interface: Succession and farm adjustment. J. Rural Stud.
2012, 28, 107–117. [CrossRef]
3. Mann, S.; Mittenzwei, K.; Hasselmann, F. The importance of succession on business growth: A case study of family farms in
Switzerland and Norway. J. Socio-Econ. Agric. Swiss Soc. Agric. Econ. Rural Soc. 2013, 6, 109–137.
4. Suess-Reyes, J.; Fuetsch, E.Y. The future of family farming: A literature review on innovative, sustainable and succession-oriented
strategies. J. Rural Stud. 2016, 47, 117–140. [CrossRef]
5. Magrelli, V.; Rondi, E.; De Massis, A.; Kotlar, J. Generational brokerage: An intersubjective perspective on managing temporal
orientations in family firm succession. Strateg. Organ. 2020. [CrossRef]
6. Haberman, H.; Danes, S.M. Father-Daughter and Father-Son Family Business Management Transfer Comparison: Family FIRO
Model Application. Fam. Bus. Rev. 2007, 20, 163–184. [CrossRef]
7. Rojas, A.; Lorenzo, D.Y. Environmental and Social Goals in Spanish SMEs: The Moderating Effect of Family Influence. Sustainabil-
ity 2021, 13, 1998. [CrossRef]
8. Available online: https://ec.europa.eu/eurostat/statistics-explained/index.php?title=Agriculture_statistics-family_faming_
in_the_EU (accessed on 12 February 2021).
9. Available online: Wordpress.ceja.eu/wp-content/uploads/2019/09/CEJA-Delaval-Survey.pdf (accessed on 12 February 2021).
10. Berrone, P.; Cruz, C.; Gómez-Mejia, L.R. Socio-emotional wealth in family firms: Theoretical dimensions, assessment approaches,
and agenda for future research. Fam. Bus. Rev. 2012, 25, 258–279. [CrossRef]
11. Cavicchioli, D.; Bertoni, D.; Tesser, F.Y.; Frisio, D.G. What Factors Encourage Intrafamily Farm Succession in Mountain Areas? Mt.
Res. Dev. 2015, 35, 152–160. [CrossRef]Agriculture 2021, 11, 520 15 of 16
12. Chiswell, H.M. The importance of next generation farmers: A conceptual framework to bring the potential successor into focus.
Geogr. Compass 2014, 8, 300–312. [CrossRef]
13. Lange, A.; Piorr, A.; Siebert, R.Y.; Zasada, I. Spatial differentiation of farm diversification: How 32 rural attractiveness and vicinity
to cities determine farm households’ response to the CAP. Land Use Policy 2013, 31, 136–144. [CrossRef]
14. El Estado Mundial de la Agricultura y la Alimentación; FAO: Rome, Italy, 2014. Available online: http://www.fao.org/3/a-i4036s.pdf
(accessed on 28 April 2021).
15. Pretty, J.N. Regenerating Agriculture: Policies and Practice for Sustainability and Self-Reliance; Earthscan Publications Ltd.: London,
UK; National Academy Press: Washington, DC, USA, 1995.
16. Bertoni, D.; Cavicchioli, D. Farm succession, occupational choice and farm adaptation at the rural-urban interface. The case of
Italian horticultural farms. Land Use Policy 2016, 57, 739–748. [CrossRef]
17. Leonard, B.; Kinsella, A.; O’Donoghue, C.; Farrell, M.Y.; Mahon, M. Policy drivers of farm succession and inheritance. Land Use
Policy 2017, 61, 147–159. [CrossRef]
18. Morais, M.; Borges, J.A.R.; Binotto, E. Using the reasoned action approach to understand Brazilian successors’ intention to take
over the farm. Land Use Policy 2018, 71, 445–452. [CrossRef]
19. Ana, O.; Oliva, V.; Sáez, C. Explaining farm succession: The impact of farm location and off-farm employment opportunities.
Span. J. Agric. Res. 2007, 214–225. [CrossRef]
20. Hennessey, T.Y.; Rehmann, T. An Investigation into Factors Affecting the Occupational Choices of Nominated Farm Heirs in
Ireland. J. Agric. Econ. 2007, 58, 61–75. [CrossRef]
21. Arzubiaga, U.; Diaz-Moriana, V.; Bauweraerts, J.; Escobar, O. Big data in family firms: A socioemotional wealth perspective, Eur.
Manag. J. 2020. [CrossRef]
22. Alsos, A.; Carter, S.; Ljunggren, E. The Handbook of Research on Entrepreneurship in Agriculture and Rural Development; Edward Elgar
Publishing: Cheltenham, UK, 2011.
23. Lowder, S.K.; Skoet, J.; Raney, T. The Number, Size, and Distribution of Farms, Smallholder Farms, and Family Farms Worldwide.
World Dev. 2016, 87, 16–29. [CrossRef]
24. Van Der Ploeg, J.D.; Renting, H.; Brunori, G.; Knickel, K.; Mannion, J.; Marsden, T.; De Roest, K.; Sevilla-Guzmán, E.; Ventura, F.
Rural Development: From Practices and Policies towards Theory. Sociol. Rural. 2000, 40, 391–408. [CrossRef]
25. Calus, M.; Van Huylenbroeck, G. The Persistence of Family Farming: A Review of Explanatory Socio-Economic and Historical
Factors. J. Comp. Fam. Stud. 2010, 41, 639–660. [CrossRef]
26. Dinis, I. The concept of Family Farming in the Portuguese Political Discourse. Soc. Sci. 2019, 8, 213. [CrossRef]
27. Barbieri, C.; Mshenga, P.M. The Role of Firm and Owner Characteristics on the Performance of Agritourism Farms. Sociol. Rural.
2008, 48, 166–183. [CrossRef]
28. Wilson, G. From ‘weak’ to ‘strong’ multifunctionality: Conceptualising farm-level multifunctional transitional pathways. J. Rural
Stud. 2008, 24, 367–383. [CrossRef]
29. Weltin, M.; Zasada, I.; Franke, C.; Piorr, A.; Raggi, M.; Viaggi, D. Analysing behavioural differences of farm households: An
example of income diversification strategies based on European farm survey data. Land Use Policy 2017, 62, 172–184. [CrossRef]
30. Darnhofer, I.; Fairweather, J.; Moller, H. Assessing a farm’s sustainability: Insights from resilience thinking. Int. J. Agric. Sustain.
2010, 8, 186–198. [CrossRef]
31. May, D.; Arancibia, S.; Behrendt, K.; Adams, J. Preventing young farmers from leaving the farm: Investigating the effectiveness of
the young farmer payment using a behavioural approach. Land Use Policy 2019, 82, 317–327. [CrossRef]
32. Zagata, L.; Sutherland, L.A. Deconstructing the ‘young farmer problem in Europe’: Towards a research agenda. J. Rural Stud.
2015, 38, 39–51. [CrossRef]
33. Liontakis, A.; Sintori, A.; Tzouramani, I. The Role of the Start-Up Aid for Young Farmers in the Adoption of Innovative
Agricultural Activities: The Case of Aloe Vera. Agriculture 2021, 11, 349. [CrossRef]
34. Fishbein, M.; Ajzen, I. Predicting and Changing Behavior. The Reasoned Action Approach; Psychology Press: New York, NY, USA,
2010.
35. Stefanie, D.; Pat, B.; Alan, R. Retirement farming or sustainable growth—Land transfer choices for farmers without a successor.
Land Use Policy 2017, 61, 526–535. [CrossRef]
36. Keating, N.C.; Little, H.M. Choosing the successor in New Zealand family farms. Fam. Bus. Rev. 1997, 10, 157–171. [CrossRef]
37. Kimhi, A.; Nachlieli, N. Intergenerational Succession on Israeli Family Farms. J. Agric. Econ. 2001, 52, 42–58. [CrossRef]
38. Jane, G. Gender, power and succession in family farm business. Int. J. Gend. Entrep. 2014, 6, 276–295. [CrossRef]
39. Jenkins, R. Social Identity; Routledge: London, UK, 1996.
40. Louise, C.; Jean, L.; Pierre, H. Succession in Women-Owned Family Businesses: A Case Study. Fam. Bus. Rev. 2002, 15, 17–30.
[CrossRef]
41. Judith, H.; Michael, D. Succession in family firms: How to improve family satisfaction and family harmony. Int. J. Entrep. Small
Bus. 2012, 15, 76–99.
42. Rosenzweig, M.R.; Wolpin, K.I. Specific Experience, Household Structure, and Intergenerational Transfers: Farm Family Land
and Labor Arrangements in Developing Countries. Q. J. Econ. 1985, 100, 961–987. [CrossRef]You can also read