Assessing the Sustainability of High-Value Brands in the IT Sector - MDPI
←
→
Page content transcription
If your browser does not render page correctly, please read the page content below
sustainability

Article
Assessing the Sustainability of High-Value Brands in
the IT Sector
María Ángeles Alcaide, Elena De La Poza *               and Natividad Guadalajara
 Center of Economic Engineering, Universitat Politècnica de València, 46022 Valencia, Spain;
 manalgon@upv.es (M.Á.A.); nguadala@omp.upv.es (N.G.)
 * Correspondence: elpopla@esp.upv.es; Tel.: +34-963877032

 Received: 6 February 2019; Accepted: 11 March 2019; Published: 15 March 2019

 Abstract: Nowadays, companies have more freedom on how they can report their corporate social
 responsibility (CSR) actions and outcomes, despite them being increasingly important for how
 investors and shareholders can obtain knowledge about companies’ non-financial aspects. This is
 why more importance is being attached to sustainability rankings as an additional tool to seek
 excellence and distinguish between companies. The main objective of the present research was to
 analyze the degree of similarity in sustainability valuations among the most important open-access
 sustainability rankings that have appeared in the last decade (Green Ranking, RepTrack, Global
 100 most sustainable corporations, and Finance Yahoo Sustainability). The secondary objective was
 to study whether these rankings incorporated the most de facto prestigious brands, and the third
 objective was to learn of the influence of the level of controversy in Finance Yahoo Sustainability
 scores in technological companies. Our results reveal wide variability among open-access CSR
 rankings. Not all the most valued brands appear in the sustainability rankings, which indicates the
 differences between the rankings of brands and CSR rankings. Finally, the level of controversy was
 found to be an important aspect in companies’ CSR scores.

 Keywords: assessment; brands; open-access CSR rankings; sustainability; technology sector; level
 of controversy

1. Introduction
      The concept of sustainability in the business world has numerous meanings. Indeed, some authors
take the concepts of corporate social responsibility (CSR) and sustainability to be synonyms [1–3],
while others consider that epistemological ones can be found among them [4–7]. Consequently, a
new term which now appears in the scientific literature, corporate sustainability, is used to specify
its differences and similarities in the business domain. In any case, sustainability is understood from
three areas of action or dimensions, namely the “triple bottom line” or “triple result”: the economic
area, the social area, and the environmental area [8,9]. This article uses this “triple result” definition to
homogeneously interpret the terms of CSR and corporate sustainability.
      Currently, some proposals to measure the CSR or corporate sustainability of companies and
countries exist, which have been prepared by private companies, such as the American agency KLD
Research & Analytics, Inc. However, the fact that so many CSR-related standards have been reported
in the world implies heterogeneity and difficulty in assessing and comparing results. Notwithstanding,
it is becoming increasingly more important to measure aspects such as commitment to society and
the environment, as well as the transparency of companies. This is because they are key factors
of competitiveness, of creating tools of value and excellence in management, and of points of
differentiation [10]. As a result of the severe criticism and crisis that some of the world’s biggest

Sustainability 2019, 11, 1598; doi:10.3390/su11061598                      www.mdpi.com/journal/sustainability
Sustainability 2019, 11, 1598 2 of 20
and most recognized companies have gone through, groups of interest are seeking a new index of trust
as a CSR reference.
This is why much importance is attached to the standards and guidelines that several world
organizations prepare. The following is a list of some of the most outstanding ones, along with
the year they were created: the Global Compact (a UN initiative created in 1999), the Green Book
prepared by the European Commission (2001), the OECD guidelines (1976 and updates in 2011),
the Global Reporting Initiative (GRI, 1997), the World Business Council for Sustainable Development
(WBCSD, 1995), SA 8000 (1989), AA 1000 or Accountability 1000 (1996), ISO 26000 (2010), and the
Ethos Indicators of CSR (1998).
Some studies [11,12] have analyzed the impact of CSR activities on the creation of companies’
value using the sustainability indices of private agencies like KLD, or the Chinese agency, Southern
Weekend. Other studies have analyzed the influence of CSR on the value of brands and examined
CSR in line with what this influence implies for interested stakeholders (customers, shareholders,
employers, suppliers, and the community as a whole) [13], or whether their information about CSR
significantly improves consumer attitudes about the brand and how they perceive its singularity [14].
Several other studies [15,16] have focused exclusively on analyzing the strong and weak points
of sustainability indices by, for instance, empirically comparing private access indices in the USA
(Dow Jones Sustainability Index (DJSI), Morgan Stanley Capital International and KLD Research
& Analytics, Inc. Index (MSCI KLD 400 Social Index) and Financial Times Stock Exchange Index
(FTSE4Good Index), and have obtained considerably different results [17]. Similar results on the
divergence among sustainability rankings can be found in the literature [18,19]. Other works have
analyzed only the DSJI to study the impact of its use (e.g., by including its logo in reports and on
websites) in 24 Canadian companies on the Stock Exchange [20], or have evaluated the differences in
the composition between DJSI Emerging markets and DJSI Developed markets (DJSI Europe and DJSI
North America) [21].
In today’s international context, having open access to sources of information via digital media is
essential for investors, and is even more so for companies because they are capable of increasing the
value of their brands by diffusing their strategic policies, actions, results, and achievements. The four
most popular CSR open-access rankings are published by Newsweek, Forbes or Corporate Knights,
the Reputation Institute, and the financial server Yahoo Finance. These four agencies annually evaluate
companies’ levels of CSR from 1% to 100% (from worst to best).
The main objective of the present research was to study the degree of similarity in the sustainability
valuation that might exist among the open-access CSR rankings in companies with the most globally
valued brands. The secondary objective was to study whether these rankings incorporated the most
de facto prestigious brands, and the third objective was to know of the influence of technological
companies’ controversy levels on the CSR ranking of Finance Yahoo Sustainability.
In this way, the study’s premises are: (i) Smaller differences in the scores granted to companies
between CSR rankings generate more confidence on financial markets in the “triple result”,
and consequently, free-access indices are more widely used when making investment and financing
decisions; (ii) smaller differences between CSR rankings and brand rankings also means greater
commitment of large companies for sustainability. Thus, the present work contributes to the literature
by analyzing the open-access sustainability rankings that have not been studied to date. Companies
from the technology sector (IT) were chosen, for which no previous work exists despite it being the most
incipient sector in the economy, and one that has been revolutionizing markets and society worldwide,
particularly since the 1990s [22]. It is also the sector that is growing the most in terms of both turnover
and the number of companies.
This article is arranged as follows: Section 2 offers a background for understanding the selected
sample and the objective set in this research. Section 3 describes the research objective, the methodology,
and the sample and data employed herein. Section 4 presents the results. Finally, the discussion of the
results and a few final remarks are provided.Sustainability 2019, 11, 1598 3 of 20
2. Background
2.1. Brands and Brand Valuation
A brand is usually associated with a name, term, signal, symbol, design, or a combination of
some of these, which identifies the company’s products and services, and differentiates it from its
competitors [23]. Keller uses a similar definition by stating that whenever a marketer creates a new
name, logo, or symbol for a new product, a brand has been created [24]. Understanding the factors
that affect the reputation of a brand and its value is crucial for managers.
In the international literature, the techniques which are followed for the assessment of brands are
classified according to the perspective or purpose of the valuation. In this way, methods for valuing
brands can be grouped into two main categories:
(1) Marketing perspective or consumer perception: These models provide an index of the brand’s
value using qualitative variables. From this perspective, it is important to take into account the
relationship of trust built between the brand and its consumers [25–29].
(2) The economic-financial perspective: This provides the brand with a quantitative value
through economic-financial variables. There are generally four main approaches to classifying
economic-financial brand valuation methods—according to their basis market [30–32], costs [33],
incomes [34], or mixed methods [35].
However, the vast majority of studies use a combination of both methods [30,36] by combining
qualitative and quantitative variables, because no consensus about methodologies exists.
The importance of providing a brand with a monetary value allows international consultancy
companies to develop their own methods for valuing brands by performing annual rankings that
are recognized worldwide. These rankings are used by authors as a basis to build their own brand
valuation models [37,38]. The best-known consultancy companies are the British Interbrand [39],
the American Millward Brown [40], and the British Brand Finance [41]. These three agencies employ
mixed valuation methods by combining economic-financial information with qualitative variables,
as discussed in Section 3, and their valuations are used in this work.
In this study, we paid attention to the IT industry, an emergent sector that covers a myriad of
processes and services, and products as well. Thus, the technological and digital revolution has led
to new companies arising that provide solutions, but also adjust any existing ones whose brands are
top-ranked by the three major consulting groups.
In this way, the considerable importance of this study for investors and creditors is shown because
companies with very valuable intangible assets in the business world are analyzed, as is the possible
impact that their CSR actions can have on the brand’s value.
2.2. Sustainability and Brand Value
Many companies have been found to consider sustainability to be used to contribute to society,
but also to make financial profits and gain an advantage over competitors. However, several
researchers on sustainability and corporate financial performance (CFP) suggest that findings on this
are inconclusive [42,43]; other researchers show that the overall effect is positive, but small, and then
conclude whether, apart from striving to do no harm, companies have grounds for doing good [44].
Other studies show that corporate sustainability correlates positively with CFP [45,46], and the basic
premise is that CSR improves financial performance by improving a firm’s relationships with its major
stakeholder group [47]. The literature generally shows that there is a positive relationship in mature
markets, especially in the banking industry, but there is less evidence for its impact on other sectors [48].
In addition, the link between what companies really do in sustainability terms and how consumers
see it is unclear [49], and it depends on not only reported information, but also on brand reputation.
Accordingly, the literature has investigated the relationship between sustainability and brand
reputation. A good brand reputation is an important strategic asset because it distinguishes a company
from its competitors [50]. Many companies use CSR as a strategic tool to respond to stakeholderSustainability 2019, 11, 1598 4 of 20
expectations and, thus, to create a favorable corporate image [49], which is why managers seek to
implement CSR activities with their business strategy [51]. Thus, the CSR must be considered as a
strategic investment to create or maintain one’s reputation [52].
Moreover, the relationship between brand value and reputation has also been studied. The results
indicate that a good reputation can improve brand value, and brand equity as the brand value is
created to meet the expectations of shareholders (not just customers), and what shareholders expect is
a company with a good reputation [49].
These relationships between sustainability and brand reputation, and between brand value and
reputation, contribute to positively and significantly link corporate sustainability and brand value.
Likewise, the way in which sustainability information is reported also makes a huge influence,
especially nowadays with the growing impact of digital communication. Despite this growing amount
of attention being paid to both the academic and business communities, models to analyze and
evaluate online sustainability communication have not yet been developed [53]. However, it is
important to communicate the commitment to corporate sustainability to stakeholders because a
sustainable business approach cannot be implemented without effective communication, which aims
to share CSR values with stakeholders [54].
It is true that the new digital era has changed the ways in which an organization can communicate
with its shareholders or with society, and that these new digital tools have empowered networks to
contribute to discussions on CSR, and with them, to bring about some changes between citizens or
society and organizations. That is why several authors [55,56] have paid attention to the true dialog
that must exist between a company and its shareholders in order to communicate the reality about
CSR actions, and not only what they (shareholders) want to hear [57]. However, only a few companies
are ready to hold open conversations on topics that stakeholders and civil society wish to discuss [57].
Although this digital revolution affects the way CSR is communicated, sustainability reports are
the communication medium most widely used by companies to report their economic, environmental,
and social impacts [58], and many organizations include these reports on their websites. In fact, better
communication of companies’ sustainable behavior improves its reputation [59] and, therefore, this can
also improve the brand value.
2.3. Sustainability and Controversial Industries
Corporate sustainability, or CSR, has recently been gaining much importance within companies.
In fact, it seems like all large companies nowadays are taking special care to report this information [58]
and to improve their CSR activities, and it is particularly important for the industries considered to be
controversial [60].
Wilson and West [61] initiated studies on controversial industries by linking their concept with
the controversial product, defined as
“products, services, or concepts that for reasons of delicacy, decency, morality, or even to fear
to elicit reactions of distaste, disgust, offense, or outrage when mentioned or when openly
presented”. Later, other ideas were incorporated into this concept, such as controversial
advertising “by the type of product or execution, [which] can elicit reactions of embarrassment,
distaste, disgust, offence, or outrage from a segment of the population when presented” [62].
Some typically identified controversial industries are tobacco, gambling, alcohol, abortion
providers, and health- or sex-related products [63]. However, the identification of other industries is
less obvious, such as the chemical and pharmaceutical, petroleum, transport (including automobile
and airline), utility and resource industries, and the steel industry [64]. In these cases, the degree of
controversy may vary according to the product or business [65].
Some studies have linked controversial industries with CSR communication or sustainability that
companies get involved in by concluding that US [66] and German companies [65] included in the
controversial sectors consider CSR to be important, even though their products are harmful to theSustainability 2019, 11, 1598 5 of 20
environment and society. Logically, these companies work more actively to communicate CSR by
using it as a strategy to mitigate the level of controversy [60]. Controversial industries use the majority
of their CSR reports to communicate their socio-community activities, while uncontroversial industries
devote a considerably bigger share to communicate their environmental activities. This suggests that
controversial companies place more emphasis on the actions in a given area to compensate for the
damage caused in other areas that is inherent to their main business [67].
3. Materials and Methods
3.1. Methods
To study the degree of similarity in the sustainability valuations that open-access CSR rankings
make of technology companies with the most valued brands over time, a descriptive and graphical
statistical analysis was done of the scores that each company obtained in the four open-access CSR
ranking agencies.
Linear regression by Ordinary Least Squares (OLS) was applied, where the dependent variable
was the companies’ score in each ranking and year, and the explanatory variables were the four
rankings, defined as dummy variables (with 1 being if the ranking scored a company within this year,
and 0 being otherwise). In addition, indicators of the company’s size and performance were included
as control variables. Size was measured by total asset (millions in $) and the number of employees
in each tax year (these two variables were obtained from companies’ annual accounts for the years
2010–2018). Performance was measured by market capitalization (market capitalization = share market
price x number of shares).
The equation of the model is expressed as follows:
Yij = α + β1 Green Rankingij + β2 RepTrakij + β3 Global 100ij + β4 Finance Yahoo
(1)
Sustainabilityij + β5 Total Assetij + β6 No. Employeesij + β7 Market Capitalizationij + ε
where:
Yij : Score of company i (i = 1 to 13) in the year j (j = 2010 to 2018).
α: Constant term.
βm : Coefficients of the explanatory variables.
ε: Random disturbance term.
Different regression models were obtained for all the companies as a whole, for each separate
company and for each individual year.
Finally, in order to know the influence of the controversy level in the technological sector on
the ranking scores of Finance Yahoo Sustainability, another model was obtained by OLS regression.
This third objective was applied only to the Finance Yahoo ranking for 2018, as it is the only one
that provides this indicator among the four rankings studied herein. The indicator’s five levels were
transformed into five dummy variables (with 1 being if the company has that level of controversy,
and 0 otherwise). The equation of this model is expressed as follows:
Yi = α + β1 Level of controversyi1 + β2 Level of controversyi2 +
(2)
β3 Level of controversyi3 + β4 Level of controversyi4 + β5 Level of controversyi5 + ε
where:
Yi : Score of company i (i = 1 to 13) in Finance Yahoo Sustainability.
α: Constant term.
βm : Coefficients of the explanatory dummy variables.
ε: Random disturbance termSustainability 2019, 11, 1598 6 of 20
The models’ goodness of fit was measured with the adjusted R2 and the Student’s t. The error
considered levels were 0.5%, 1%, and 5%. Multicollinearity was measured with the condition index
(CI) and the variance inflation factor (VIF).
3.2. Sources of Information
For our study, the selection of companies belonging to the IT sector was based on the brand
value criterion, using the ratings of the rankings published by Intebrand, Millward Brown, and Brand
Finance. These three consultancy firms only analyze companies whose brands are global, visible,
growing, and relatively transparent with financial results. These companies only publish the top
100 brands according to their rankings. Given their relevance, these brand valuation rankings have
been previously used in other studies [68].
It is notable that these three consultancy companies employ mixed valuation methods. Interbrand uses
a mixed model of discounted cash flows, along with marketing methods. Millward Brown publishes the
ranking Brand Z and uses a mixed model between marketing variables and the Millward Brown Optimor.
Brand Finance combines market approaches (royalty-based methods) with the brand strength associated
with these approaches. Therefore, these three agencies combine economic-financial information with
qualitative variables. These qualitative variables measure the strength of the brand and how consumers
perceive it, which is what Interbrand calls “brand strength” (a measure of the ability of a brand to
create loyalty), and what Millward Brown calls “brand contribution” (which assesses the ability of brand
associations in consumers’ minds). However, neither of these agencies include environmental or social
performance variables, which constitute the other two CSR dimensions, along with the economic-financial
dimension. Only the company Brand Finance was found to calculate the “Brand Strength Index” using a
balanced scorecard of a number of relevant attributes, such as emotional connection, financial performance,
and sustainability, among others. The weight of “sustainability” is diluted among the other variables used
to calculate this index, which is then multiplied by the royalties tax.
The brand value criterion for selecting the companies in the sample are companies that have been
in the top 100 in at least two rankings published by Interbrand, Millward Brown, and Brand Finance
between 2000 and 2018 (inclusive). This requirement was met by 13 companies, which made up our
study object sample—namely: Accenture, Apple, Cisco, Facebook, Google, HP, IBM, Intel, Microsoft,
Oracle, Samsung, SAP, and Sony.
To facilitate understanding of the importance attached to the value that brands take in companies,
especially in the companies selected for the present work, Table 1 shows the evolution of the mean brand
values of all 13 of the studied companies. The mean brand value was obtained as the means of the
valuations made by Interbrand, Millward Brown, and Brand Finance for each year from 2010 to 2018.
Table 1 shows how all 13 companies obtained very high values and whose values increased with
time, except for Sony, IBM, and HP. Apple leads the Interbrand, Millward Brown, and Brand Finance
rankings in all the sectors by occupying either first or second position between 2012 and 2018. It is
followed by brands Google, Microsoft, and Facebook, which have also appeared in the top 10 of these
rankings in recent years, and were higher up than the most prestigious brands in other economy sectors.
According to the Global Industry Classification Standard (GICS), the 13 selected companies came
from different industries, but appeared more (with four companies) in “consumer electronics” (Table 2).
According to their location, nine had their headquarters in the USA, two in Europe, and two in Asia.
Differences in their ages also appeared (the oldest was created in 1911, the youngest in 2004), as they
did in economic results. Their size was measured as their amount of assets and number of employees.
It is noteworthy that the companies belonging to the “IT services” industry required more employees,
such as Accenture or IBM, while, conversely, the “internet, content, & services” industry employed
fewer workers, such as Facebook. Some companies stood out for several reasons: Apple for its amount
of assets, net income, and market capitalization; Microsoft for its total number of outstanding shares;
and Google for its price to earning ratio (PER) and earnings per share ratio. (EPS). All this information
was valid on 31 December 2017.Sustainability 2019, 11, 1598 7 of 20
Table 1. Temporal evolution of the average value of brands according to international valuation rankings (in thousands of $).
Year Accenture Apple Cisco Facebook Google HP IBM Intel Microsoft Oracle Samsung SAP Sony
2018 20,914 223,795 25,106 98,986 192,827 2615 57,240 31,223 124,955 27,190 61,457 31,769 9316
2017 18,953 175,322 23,130 79,995 165,585 11,780 61,676 27,249 99,829 24,901 43,891 27,662 8325
2016 15,841 184,166 21,539 56,382 150,208 17,026 56,831 26,143 87,292 22,726 51,494 23,141 8233
2015 14,023 181,857 20,751 39,110 123,550 21,388 64,837 26,270 83,410 23,950 49,538 28,497 7846
2014 13,994 123,808 21,810 19,969 111,634 21,017 73,766 22,920 71,374 22,509 50,035 22,363 9401
2013 12,987 123,564 18,779 14,497 86,364 19,439 76,355 24,051 58,298 20,058 39,928 20,517 8597
2012 12,432 110,041 17,793 19,327 75,015 23,564 76,884 25,642 60,105 20,562 28,418 16,799 10,004
2011 11,716 72,107 17,763 19,102 70,370 30,213 68,970 22,733 60,045 19,604 19,034 20,310 10,862
2010 11,108 41,375 17,139 5524 64,669 31,322 61,605 20,956 56,948 17,491 16,589 18,524 10,717
Table 2. Sample composition of technology companies.
Creation
Company Headquarter Industry FTE Total Assets Net Income PER EPS M.C. S.O.
Date
Accenture Dublin (Ireland) 1989 Information Technology Services 449,000 22,689,890 3,445,149 23.72 5.39 81,706 639,452.5
Apple Cupertino (CA, USA) 1977 Consumer Electronics 100,000 375,319,000 48,351,000 15.82 9.43 765,004 5,126,201
Cisco San Jose (CA, USA) 1984 Communication Equipment 72,900 108,784,000 110,000 16.68 1.93 160,245 4,983,000
Facebook California (USA) 2004 Internet Content & Information 30,275 84,524,000 15,934,000 28.92 5.49 460,870 2,901,000
Google Mountain View (CA, USA) 1998 Internet Content & Information 89,058 197,295,000 12,662,000 50.95 18.22 645,135 694,783
HP Palo Alto (CA, USA) 1939 Consumer Electronics 49,000 32,913,000 2,526,000 12.04 1.53 30,402 1,649,580
IBM Armonk (NY, USA) 1911 Information Technology Services 366,600 125,356,000 5,753,000 24.4 6.17 140,349 932,800
Intel Santa Clara (CA, USA) 1968 Semiconductors 104,200 123,249,000 9,601,000 18.29 2.04 175,578 4,701,000
Microsoft Redmond (WA, USA) 1975 Software—Infrastructure 131,000 258,848,000 16,571,000 26.16 2.74 554,678 7,746,000
Oracle Redwood (USA) 1977 Software—Infrastructure 137,000 137,264,000 3,825,000 20.82 2.21 194,372 4,217,000
Samsung Suwon (South Korea) 1938 Consumer Electronics 320,671 283,263,492 39,604,983 7.62 5.4 284,309 6,901,250
SAP Walldorf (Germany) 1972 Software—Application 91,120 42,497,000 4,018,000 17.79 5.05 107,531 1,197,000
Sony Tokyo (Japan) 1946 Consumer Electronics 128,400 169,301,977 4,358,251 70.97 0.54 48,052 1,263,8950
Data on 31 December 2017 taken from companies’ yearly accounts. Total assets, net income, and market capitalization (MC) in thousands of $. Shares outstanding (SO) in $. PER is the
price to earning ratio (calculated as Stock Price/EPS). EPS is earnings per share (calculated by net income/number of shares). FTE stands for full-time employees.Sustainability 2019, 11, 1598 8 of 20
The four open-access CSR rankings employed (2018) herein are described in order of age:
Newsweek classifies the biggest companies in corporate sustainability or environmental impact
terms as a ranking. This list is known as the “Green Ranking” and has been published continuously
ever year since 2010, except for 2013. The “Green Ranking, Global 500” assesses the sustainable
performance (measured in environmental terms) of the 500 biggest companies worldwide, according to
their income and whether they were on the Stock Exchange on December 31 of each year. This ranking
exclusively employs environmental indicators [69].
Reputation Institute classifies those companies with the best reputation in CSR matters worldwide.
Its ranking, known as “CSR RepTrak”, has been published since 2012 and lists the top 100 companies
with the best reputation [70].
The financial Finance Yahoo portal includes Environment, Social, and Governance (or ESG) scores
of more than 2000 companies on the Stock Exchange [71]. Such information provides a given company’s
numerical score for all three ESG categories, as well as its overall score. It also graphically presents
information, which is compared with the averages of either their category or industry over time,
and indicates their level of controversy. The level of controversy is measured by identifying the
companies involved in incidents and events that may have a negative impact on the interested parties,
the environment, or a company’s operations. This is scored on a scale from 1 to 5, where 1 indicates a low
level, 2 a moderate level, 3 is significant, 4 is high, and 5 indicates the gravest or most serious controversy,
with the strongest potential impact. The Yahoo Finance Sustainability ranking was published for the
first time on 1 February 2018, but has included data of each company since 2014. However, the level of
controversy is available only for the current year. The methodology that it employs was developed by
Sustainalytics, a leading independent world supplier of corporate governance and ESG research works
and scores. This is further proof that investors at all levels look beyond the conventional financial risk,
and consider the risk of investing in ESG to better assess companies’ performance from many angles.
Forbes has published the “Global 100 most sustainable corporations”, also known as “Global
100” [72], from 2015 to 2018. This ranking was named one of the best CSR rankings in 2017 and 2018,
and has been prepared by the company Corporate Knights since 2005. The objective of creating this
index was to design a methodology to quantitatively compare and classify the largest public companies
in the world (with a minimum income of 1000 million US dollars). In 2018, it employed 15 indicators,
of which five are environmental and 10 are corporate.
The 13 brands selected for our sample were not equally present in the four open-access CSR
rankings, and the years that the four rankings have been available also differed. This provided 266
data for the series of scores obtained by the four rankings for our selected sample of 13 companies.
The values of the rankings to be analyzed corresponded to the period between 2010, which was when
the first ranking was published (“Green Ranking”) and 2018. The data distribution is shown below in
Tables 3 and 4 for years and companies, respectively.
Table 3. Number of data provided by the CSR rankings for each year.
Year 2018 2017 2016 2015 2014 2013 2012 2011 2010
No. 17 43 43 40 35 10 22 11 5
Table 4. Number of data provided by the CSR rankings for each brand.
Company Accenture Apple Cisco Facebook Google HP IBM Intel Microsoft Oracle Samsung SAP Sony
No. 14 19 21 9 17 21 18 21 19 17 21 13 16Sustainability 2019, 11, 1598 9 of 20
The years with the most information were the more recent ones, except for 2018, as some rankings
had still not published their classification when the present study was conducted. The first years
provided less information because most public rankings still did not exist at that time. The presence of
different technology companies was similar, with a mean of 8.2%.The least present companies were
SAP and Facebook because they were included in fewer rankings (Facebook appeared in only two)
and in fewer years.
4. Results
4.1. Descriptive Analysis
A descriptive analysis was firstly carried out (Table 5) of the scores obtained jointly by the
13 companies from the technology sector in the four open-access CSR rankings.
Table 5. Descriptive statistics: scores of the CSR rankings of the companies in the sample for the
2010–2018 period.
Green Ranking RepTrak Finance Yahoo Sustainability Global 100
Valid 79 63 63 20
No.
Lost 37 53 53 96
Mean 60.34 69.72 71.52 60.55
Median 63.70 69.32 73 58.39
Range 94.60 10.90 45 25.42
Minimum 5.40 64.50 41 51.60
Maximum 100 75.40 86 77.02
The mean scores were similar: “Green Ranking” and “RepTrack” came close to 60%, and “Global
100” and “Finance Yahoo Sustainability” came close to 70%. Thus, it can be stated that the technology
sector companies have a mean RSC index of 60–70. However, none of these four CSR indices coincided
in terms of maximum and minimum scores. This is due to the methodology used, the number
of companies studied, and the years analyzed (Table 6). The “Green Ranking” is the oldest and,
therefore, includes more years—and as seen below, there have been differences over time, as well as the
inclusion of more companies (top 500), meaning that its range is wider. Finance Yahoo Sustainability
follows in terms of the number of valid cases and rank, with it being 63 and 45, respectively. This
is because, despite being quite recent (since 2014), it analyzes more than 2000 companies and, thus,
the sample included the 13 companies. The smallest number of analyzed valid cases, 20, corresponds
to “Global 100”, and its range is 25.42 because it includes the fewest companies in our sample in its
Top 100 ranking, as it has been publishing for a fewer number of years. Finally, the narrowest range
corresponds to RepTrak, which, despite having published its ranking since 2012, employs a completely
different methodology to the other rankings, and obtains values through surveys with a panel of
experts, who could make more subjective and homogeneous assessments.Sustainability 2019, 11, 1598 10 of 20
Some companies did not appear in any ranking for any studied year. This was the case for
Accenture and Facebook, because they did not appear in “RepTrack” (Figure 1). The “Global 100”
index did not include six of the 13 companies in any studied year—namely, Facebook, Google, IBM,
Oracle, Sap, and Sony. Therefore, the number of companies assessed in the four rankings in any study
year was 53.84%.
Table 6. Characterization of open-access corporate social responsibility (CSR) rankings.
Ranking Source Methodology Year the Ranking Began
This uses eight indicators, which are all
environmental: energy productivity, greenhouse
productivity, water productivity, waste
Green Ranking Newsweek productivity, green revenue score, green pay link, 2010 (except 2013)
sustainability board committee, and audited
environmental metrics. Publishes the top
500 rankings.
This is based on questions that measure the quality
of the workplace, governance, and citizenship.
Reputation Drivers of CSR are defined by ethics, fairness,
CSR RepTrak 2012
Institute and societal impact. Collects information through
surveys carried out by a panel of experts. Publishes
the top 100 rankings.
This uses environmental, social, and governance
(ESG) ratings of more than 2000 companies on the
Finance Yahoo Yahoo Finance
Stock Exchange. It numerically scores the company 2014
Sustainability (Sustaynalitcs)
for all three ESG categories, and provides an
overall score.
This uses 15 indicators, of which five are
environmental (energy intensity or productivity,
carbon productivity, water productivity, waste
productivity, and clean air productivity) and ten are
Global 100 most
Corporate Knight corporate (innovation capacity, percentage of tax 2015 1
sustainable corporations
paid, CEO-to-average-worker pay, suppliers score,
pension fund status, safety performance, employee
turnover, leadership diversity, sustainability pay
link, and clean capitalism pay link).
1 This ranking has been published since 2005 and ranks from 1 to 100 companies in it, but it was not until 2015 when
it incorporated scores from 1% to 100%.
Figure 1. Cont.Sustainability 2019, 11, 1598 11 of 20
Figure 1. Cont.Sustainability 2019, 11, 1598 12 of 20
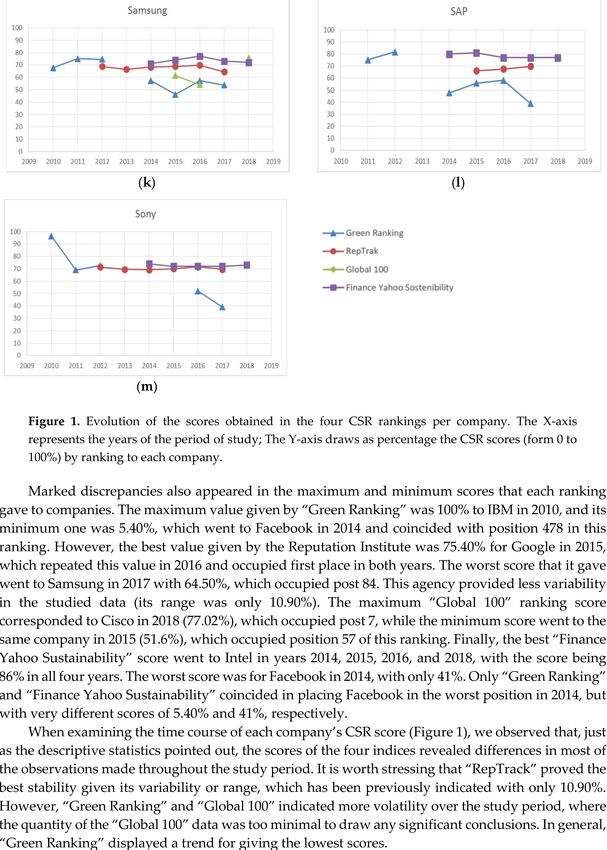
Figure 1. Evolution of the scores obtained in the four CSR rankings per company. The X-axis represents
the years of the period of study; The Y-axis draws as percentage the CSR scores (form 0 to 100%) by
ranking to each company.
Marked discrepancies also appeared in the maximum and minimum scores that each ranking
gave to companies. The maximum value given by “Green Ranking” was 100% to IBM in 2010, and its
minimum one was 5.40%, which went to Facebook in 2014 and coincided with position 478 in this
ranking. However, the best value given by the Reputation Institute was 75.40% for Google in 2015,
which repeated this value in 2016 and occupied first place in both years. The worst score that it
gave went to Samsung in 2017 with 64.50%, which occupied post 84. This agency provided less
variability in the studied data (its range was only 10.90%). The maximum “Global 100” ranking
score corresponded to Cisco in 2018 (77.02%), which occupied post 7, while the minimum score went
to the same company in 2015 (51.6%), which occupied position 57 of this ranking. Finally, the best
“Finance Yahoo Sustainability” score went to Intel in years 2014, 2015, 2016, and 2018, with the score
being 86% in all four years. The worst score was for Facebook in 2014, with only 41%. Only “Green
Ranking” and “Finance Yahoo Sustainability” coincided in placing Facebook in the worst position in
2014, but with very different scores of 5.40% and 41%, respectively.
When examining the time course of each company’s CSR score (Figure 1), we observed that,
just as the descriptive statistics pointed out, the scores of the four indices revealed differences in most
of the observations made throughout the study period. It is worth stressing that “RepTrack” proved
the best stability given its variability or range, which has been previously indicated with only 10.90%.
However, “Green Ranking” and “Global 100” indicated more volatility over the study period, where
the quantity of the “Global 100” data was too minimal to draw any significant conclusions. In general,
“Green Ranking” displayed a trend for giving the lowest scores.Sustainability 2019, 11, 1598 13 of 20
To measure the consistency of the rankings on the selected companies’ sustainability valuations,
the coefficient of variation was calculated for each company and year (mean scores/standard deviation)
of their score in all four rankings. Table 7 shows that the coefficients of variation lie between
0.92 (Facebook in 2014) and 136.59 (Oracle in 2012). The vast majority obtained low values, which
indicated a high degree of variability among rankings. The highest coefficients were obtained in 2012
for Microsoft and Oracle, which indicated that the degree of variability between rankings was lower
for that particular year. These coefficients lowered in the following years, but rose again in 2018, which
implies fewer discrepancies among the scores that the four CSR rankings provided.
Table 7. Temporal evolution of the coefficient of variation of the scores of the CSR rankings for
each company.
Company 2012 2013 2014 2015 2016 2017 2018
Accenture 4.14 10.24 10.79 5.72
Apple 7.69 9.00 12.70 8.15 8.51
Cisco 25.57 5.88 7.18 6.31 12.14 37.26
Facebook 0.92 2.65 1.89 1.84
Google 36.93 2.05 5.09 4.24 1.61
HP 9.74 7.66 11.72 2.03 3.47 6.47
IBM 8.57 2.49 4.86 5.17 4.84
Intel 20.27 3.92 5.27 6.72 3.88 7.47
Microsoft 106.77 6.45 10.12 25.56 7.88
Oracle 136.59 4.28 3.40 17.23 15.40
Samsung 17.77 9.03 5.17 6.03 6.59 27.72
Sap 2.80 5.36 7.19 3.05
Sony 86.18 21.10 53.74 5.75 3.28
In relation to the third objective about the influence of the level of controversy on the Finance
Yahoo Sustainability ranking in 2018, according to this ranking, the average level of controversy
of the technology sector was around 1.3, which indicates that it is a sector with a low level of
controversy. However, the average level of controversy obtained by the 13 companies in the sample
was somewhat higher with a score of 2.69, which lies between the moderate (2) and significant (3)
levels. The companies Apple, Facebook, Google, and Samsung reached a higher level of controversy of
level 4, possibly because they have been involved in 2018 in some type of event with either a negative
impact on the environment, the interested parties, or the company. On the contrary, Accenture was the
only company to obtain a low level of controversy, level 1, in that particular year.
4.2. Regression Analysis
The linear regression results corresponding to mathematical Equation (1) are offered in Tables 8
and 9, and several models are presented. Table 8 presents ten models: one for the data (226) and nine
individual models for each company, except for HP, IBM, Oracle, and Sony, for which no significant
results were obtained.Sustainability 2019, 11, 1598 14 of 20
Table 8. Regression models for the 2010–2018 study period.
1 2 3 4 5 6 7 8 9 10
Models
All Companies Accenture Apple Cisco Facebook Google Intel Microsoft Samsung SAP
Constant 60.37 71.18 67.70 66.87 19.75 51.9 67.5 70.27 64.31 62.44
RepTrak 9.27 *** 22.1 *
Global 100 −12.51 * −15.278 *
Finance Yahoo
11.30 *** −11.70 ** 11.92 *** 28.85 *** 20.86 *** 9.08 * 15.72 *
Sustainability
Adjusted R2 14.10% 33.20% 31.60% 32.90% 79.80% 32.50% 58.30% 20% 17.20% 32.80%
N 226 14 19 21 9 16 21 19 21 15
CI 3.06 2.68 3.25 3.45 2.61 2.92 3.45 2.95 3.14 2.80
VIF 1.182 1 1 1 1 1 1 1 1 1
The dependent variable was the score of the CSR rankings. The independent dichotomic variables were the four rankings (with a value of 1 if the ranking scored this company and/or year,
and 0 otherwise). ***, **, and * are the 0.5%, 1% and 5% error levels, respectively. CI is the condition index which, in all the obtained models, presented a low level. VIF is the inflation factor
of variance, with a low level in all the models. Thus, there was no multicollinearity among variables.Sustainability 2019, 11, 1598 15 of 20
A model was also obtained for the years 2014, 2015, and 2016 (Table 9). No significant results
were found for 2018, 2017, and 2012, and this was not possible for 2013, 2011, and 2010 because only
one of the four rankings gave scores in these years.
Table 9. Annual regression models.
11 12 13
Models
2016 2015 2014
Constant 55.78 55.75 44.83
RepTrak 15.12 ** 13.79 *** 23.86 ***
Global 100
Finance Yahoo
15.36 *** 15.25 *** 25.39 ***
Sustainability
Adjusted R2 29.80% 36.50% 47.50%
N 43 40 35
CI 2.62 2.80 3.09
VIF 1.175 1.223 1.310
The dependent variable was the score of the CSR rankings. The independent dichotomic variables were the four
rankings (with a value of 1 if the ranking scored this company and/or year, and 0 otherwise). *** and ** are the
0.5% and 1% error levels, respectively. CI is the condition index which, in all the obtained models, presented a low
level. VIF is the inflation factor of variance, with a low level in all the models. Thus, there was no multicollinearity
among variables.
Of all the obtained models (Tables 8 and 9), “Green Ranking” was selected as the reference
variable. It is noteworthy that none of the economic-financial control variables (total assets, no. of
employees, and market capitalization) were statistically significant in any model.
The constant in all the models was extremely similar, being between 44.83 and 71.18, except
for Facebook. In contrast, the coefficient for the Finance Yahoo ranking was the highest (28.85),
because Facebook was valued by only two rankings (Green Ranking and Finance Yahoo Sustainability),
with large differences between them of 28.85 points on average. These differences were due to the fact
that Green Ranking measures only the environmental dimension, while Finance Yahoo Sustainability
measures the three ESG dimensions. This corroborates the low coefficients of variability obtained
by Facebook in Table 7, especially in 2014. Indeed, Facebook was fully expanding and building an
important datacenter in 2014, which allowed its environmental footprint to considerably increase [73],
a fact that was much criticized by organizations like Greenpeace. As a result, Facebook took energy
efficiency measures to improve its score in the rankings, especially in the Green Ranking.
We also found that the obtained CSR scores lay between 14.10% (for the sample as a whole) and
79.80% (for Facebook) for the company that prepared the ranking.
The scores given by “Finance Yahoo Sustainability” for all the companies were above those given
by “Green Ranking” (a positive coefficient), except for Apple, which was lower (a negative coefficient),
and no difference was found for the companies Accenture, Google, and Microsoft. Indeed, for these
three companies, “Global 100” scored below the “Green Ranking” (for Accenture and Microsoft),
and “RepTrak” scored above it (for Google).
In the joint model (1) for the years 2014–2016 (13, 12, and 11), the “Finance Yahoo Sustainability”
coefficient was always above that which corresponded to RepTraK. “Global 100” did not appear,
which meant that no significant differences were found between its valuations and those of the control
variable “Green Ranking”.
Thus, we concluded that the “Finance Yahoo Sustainability” ranking tends to score above the
other rankings in most cases, while “Green Ranking” and “Global 100” tends to score below.
The linear regression result corresponding to mathematical Equation (2) is offered in Table 10 to
analyze the influence of the level of controversy in the Finance Yahoo Sustainability scores in 2018.Sustainability 2019, 11, 1598 16 of 20
Table 10. The regression model results for Finance Yahoo Sustainability in 2018.
14
Model
Finance Yahoo Sustainability
Constant 76.33
Level of controversy 4 −12.33 *
Adjusted R2 45.90%
N 13
CI 1.86
VIF 1.0
The dependent variable was the score of the companies in Finance Yahoo Sustainability in 2018. The independent
dichotomic variables were the five levels of controversy (with a value of 1 if the company had this level,
and 0 otherwise). * is the 5% error levels, respectively. CI is the condition index and VIF is the inflation factor of
variance, both with a low level. Thus, there was no multicollinearity among variables.
The obtained results (Table 10) reveal that only the level of controversy explains 45.90% variability
of the score of the Finance Yahoo ranking for technology companies in 2018. In addition, there were
only differences in the Finance Yahoo Sustainability scores between a level of controversy of 4 (high)
and the other levels (1, 2, and 3), which did not appear in the model because they were not statistically
significant. Companies with a level of controversy of 4 had a mean score in the ranking of 12.33 points
less (negative coefficient) than those with levels 1, 2, and 3 (76.33 points). Therefore, there were no
differences in score due to the level of controversy among levels 1, 2, and 3. A level of controversy
of 5 (gravest level) did not appear in the model because none of the 13 companies that we analyzed
obtained this level in 2018 and, therefore, its impact on the ranking score could not be determined.
5. Concluding Remarks
This study confirms that, like private CSR rankings, which have been the study object of previous
research works [17–19], the degree of variability between different open-access CSR rankings is high.
In other words, the scores that these rankings give to technology companies do not coincide to assess
their level of sustainability throughout our study period (2010–2018). These differences between
rankings are due to the methodology used by each one. Green Ranking, Global 100, and Finance Yahoo
use quantitative indicators, which is why they are more objective than Rep Track, which is based on
expert surveys. Green Ranking only measures the environmental aspect of CSR; thus, any variation
in only this aspect will more strongly influence the final score of the ranking, and will lead to wider
temporal variability in the same company. On the contrary, Finance Yahoo Sustainability measures the
three aspects (ESG), so the same environmental variation will have a much lower impact on the final
score. Therefore, Finance Yahoo Sustainability is much stabler over time. The same can be stated of
private access rankings, where differences have been observed for the methodologies they use, and also
for other aspects such as lack of standardization, transparency, bias, tradeoffs, and the credibility of
both information and the independence between rating organizations and companies [17,19]. These
differences are corroborated empirically in the study conducted by Delmas and Blass [18] in the
chemical sector, where 15 companies in that sector were analyzed during the 2000–2005 period. Hence,
it can be stated that these differences are not specific to a given sector, but exist in different sectors of
the economy.
It has been verified that these differences in scores between rankings are due solely to the different
forms of their performance, regardless of the differences that may exist between companies for
economic-financial aspects, such as total assets, number of employees, and market capitalization.
Hence, nowadays, these rankings do not provide investors and shareholders with reliability, so
they can be used as further information with which to assess companies’ performance. A trend is
stressed for the “Finance Yahoo Sustainability” ranking—that of scoring above the rest. “RepTrack”
can be considered the stablest, or that its variability is narrower. The results indicate wide variability
among open-access CSR rankings depending on the analyzed companies and years. The widestSustainability 2019, 11, 1598 17 of 20
variability was obtained for Facebook in 2014, and the smallest differences went to Oracle in 2012.
In general, 2012 was the year with the smallest differences among rankings.
Rankings are useful for companies themselves because they help them to know their position
compared to other companies in the sector, which can be useful for making improvements in the future
and, with it, to increase their reputation in the market. However, this study shows that, depending
on the pursued investment-financing object, some sustainability indicators are more useful than
others. For example, if a company chooses to finance itself by issuing green bonds, which entails its
environmental performance being monitored, the Green Ranking will be used as a reference. On the
contrary, if investors wish to buy stocks of technology companies, they will look more at Finance Yahoo
Sustainability, which encompasses the three dimensions (ESG), where it is also one of the stablest
rankings that incurs a lower risk.
All this evidences the need for both financial agents and society to define a regulation or
homogeneous standard for measuring and diffusing companies’ CSR actions, as well as standards
for reporting financial information (e.g., International Financial Report Standards). This is because
investors and shareholders particularly need increasingly stabler and more reliable indices to measure
companies’ non-financial aspects.
Moreover, the companies studied herein have brands that have been more economically valued
(the top 100) since 2000, which indicates that the highest economic value is no synonym of sustainability
according to the agencies that measure CSR, because the companies in our sample have not always
been included in the top 100 of open-access CSR rankings. In other words, there is no correspondence
between CSR rankings and brands rankings. This is because the methodologies used to value
brands and those that value CSR differ as the consultancy firms that value brands do not include
any variables to contemplate the three sustainability dimensions in their methodologies, but only
the economic-financial dimension. Likewise, no CSR measurement agency explicitly includes the
economic-financial dimension in its methodology. However, some companies like Newsweek or Forbes
implicitly consider them in order to include sales in productivity indicators.
Probably in the future, international consultancy firms of brands valuations will include variables
of socio-environmental dimensions because non-financial information is becoming increasingly more
relevant for investors and creditors and could also affect the value of brands. If a regulation or standard
existed to measure CSR actions, it would help the agencies that value brands to include these results in
their methodologies.
This work has demonstrated that levels of controversy is an important aspect in the CSR score
of companies, but it is only measured explicitly by the Finance Yahoo ranking. According to this
ranking, the technology sector generally has a low level of controversy [65], but some analyzed
companies have a high level of controversy, which is possibly due to them having performed some
specific act with a negative impact on both their own operations and the environment. It would be
desirable for all sustainability and brand valuation rankings to explicitly include this measure in
order to compare them, although, implicitly, some rankings are already considering this by completely
excluding companies from certain highly controversial sectors from their presence in rankings, which
is the case for companies in the tobacco or armament sectors in the Global 100.
This study has two main limitations. One is its small sample size, which means that its results
cannot be extrapolated to other technological brands and sectors because only 13 companies were
selected, given the interest in knowing what effect CSR had on the best-valued brands. Future research
could be extended to all companies in the technology sector on the Stock Exchange and to other
sectors. The second limitation is the different time availability of the open-access CSR ranking scores,
specifically for the years 2010, 2012, 2014, and 2015 for the rankings by Newsweek, the Reputation
Institute, Finance Yahoo, and Forbes, respectively.
Finally, it would be relevant to perform a cost–benefit analysis in the future, and what it means
for companies to provide CSR information, by comparing the cost of collecting information with the
benefit that it confers their reputation, their position in rankings, and their market value.Sustainability 2019, 11, 1598 18 of 20
Author Contributions: This article was originally conceived and designed by M.Á.A., E.D.L.P., and N.G. These
three authors contributed equally to this work.
Funding: This research received no external funding.
Conflicts of Interest: The authors declare no conflict of interest.
References
1. Cavalcanti, M.; Teixeira, L.; Barlow, C. Institutional dynamics and organizations affecting the adoption of
sustainable development in the United Kingdom and Brazil. Bus. Ethics A Eur. Rev. 2015, 24, 73–90.
2. Choi, Y.; Yu, Y. The influence of perceived corporate sustainability practices on employees and organizational
performance. Sustainability 2014, 6, 348–364. [CrossRef]
3. Hahn, R.; Kühnen, M. Determinants of sustainability reporting: A review of results, trends, theory, and
opportunities in an expanding field of research. J. Clean. Prod. 2013, 59, 5–21. [CrossRef]
4. Lozano, R. A holistic perspective on corporate sustainability drivers. Corp. Soc. Responsib. Environ. Manag.
2015, 22, 32–44. [CrossRef]
5. Maletic, M.; Maletic, D.; Dahlgaard, J.; Dahlgaard-Park, S.M.; Gomiscek, B. Sustainability exploration and
sustainability exploitation: From a literature review towards a conceptual framework. J. Clean. Prod. 2014,
79, 182–194. [CrossRef]
6. Montiel, I.; Delgado-Ceballos, J. Defining and measuring corporate sustainability: Are we there yet?
Organ. Environ. 2014, 27, 113–139. [CrossRef]
7. Schneider, A.; Meins, E. Two dimensions of corporate sustainability assessment: Towards a comprehensive
framework. Bus. Strategy Environ. 2012, 21, 211–222. [CrossRef]
8. Archel, P. Las Memorias de Sostenibilidad de la Global Reporting Initiative, Quinto Congreso de Economía de Navarra:
Economía y Desarrollo Sostenible, Pamplona, España, Noviembre de 2003; Gobierno de Navarra, Departamento de
Economía y Hacienda: Navarra, Spain, 2003.
9. Liang, X.; Zhao, X.; Wang, M.; Li, Z. Small and Medium-Sized Enterprises Sustainable Supply Chain
Financing Decision Based on Triple Bottom Line Theory. Sustainability 2018, 10, 4242. [CrossRef]
10. Strandberg, L. La medición y la comunicación de la RSE: Indicadores y normas. Cuadernos de la Cátedra
“La Caixa” de Responsabilidad Social de la Empresa y Gobierno Corporativo, 9. Pamplona, 2010: IESE
Busines School—Universidad de Navarra. Available online: https://studylib.es/doc/5989799/la-medici%
C3%B3n-y-la-comunicaci%C3%B3n-de-la-rse--indicadores-y-no (accessed on 28 July 2018).
11. Ding, D.K.; Ferreira, C.; Wongchoti, U. Does it pay to be different? Relative CSR and its impact on firm value.
Int. Rev. Financ. Anal. 2016, 47, 86–98. [CrossRef]
12. Kao, E.H.; Yeh, C.C.; Wang, L.H.; Fung, H.G. The relationship between CSR and performance: Evidence in
China. Pac. Basin Financ. J. 2018, 51, 155–170. [CrossRef]
13. Torres, A.; Bijmolt, T.H.A.; Tribó, J.A.; Verhoef, P. Generating global brand equity through corporate social
responsibility to key stakeholders. Int. J. Res. Mark. 2012, 29, 13–24. [CrossRef]
14. Manzano, J.A.; Simó, L.A.; Pérez, R.C. La responsabilidad social como creadora de valor de marca: El efecto
moderador de la atribución de objetivos. Rev. Eur. Dir. Econ. Empresa 2013, 22, 21–28.
15. Sharfman, M. The construct validity of the kinder, lydenberg & domini social performance ratings data.
J. Bus. Ethics 1996, 15, 287–296.
16. Chatterji, A.K.; Levine, D.I.; Toffel, M.W. How Well Do Social Ratings Actually Measure Corporate Social
Responsibility? J. Econ. Manag. Strategy 2009, 18, 125–169. [CrossRef]
17. Chatterji, A.; Levine, D. Breaking down the wall of codes: Evaluating non-financial performance
measurement. Calif. Manag. Rev. 2006, 48, 29–52. [CrossRef]
18. Delmas, M.; Blass, V.D. Measuring corporate environmental performance: The trade-offs of sustainability
ratings. Bus. Strategy Environ. 2010, 19, 245–260. [CrossRef]
19. Windolph, S.E. Assessing Corporate Sustainability Through Ratings: Challenges and Their Causes.
J. Environ. Sustain. 2011, 1, 1–22. [CrossRef]
20. Searcy, C.; Elkhawas, D. Corporate sustainability ratings: An investigation into how corporations use the
Dow Jones Sustainability Index. J. Clean. Prod. 2012, 35, 79–92. [CrossRef]
21. Kutay, N.; Tektüfekçi, F. A New Era for Sustainable Development: A Comparison for Sustainability Indices.
J. Account. Financ. Audit. Stud. 2016, 22, 70–95.You can also read