QBD BASED MEDIA DEVELOPMENT FOR THE PRODUCTION OF FAB FRAGMENTS IN E. COLI - MDPI
←
→
Page content transcription
If your browser does not render page correctly, please read the page content below
bioengineering

Article
QbD Based Media Development for the Production of
Fab Fragments in E. coli
Deepak Kumar 1 , Jyoti Batra 1 , Claire Komives 2 and Anurag S. Rathore 1, *
 1   Department of Chemical Engineering, Indian Institute of Technology, Hauz Khas 110016, India;
     dpakk10@gmail.com (D.K.); batrajyoti123@gmail.com (J.B.)
 2   Department of Biomedical, Chemical and Materials Engineering, San Jose State University, San Jose,
     CA 95192, USA; claire.komives@sjsu.edu
 *   Correspondence: asrathore@biotechcmz.com

 Received: 26 January 2019; Accepted: 23 March 2019; Published: 28 March 2019

 Abstract: Ranibizumab is a biotherapeutic Fab fragment used for the treatment of age-related
 macular degeneration and macular oedema. It is currently expressed in the gram-negative bacterium,
 Escherichia coli. However, low expression levels result in a high manufacturing cost. The protein
 expression can be increased by manipulating nutritional requirements (carbon source, nitrogen
 source, buffering agent), process parameters (pH, inducer concentration, agitation, temperature),
 and the genetic make-up of the producing strain. Further, understanding the impact of these factors
 on product quality is a requirement as per the principles of Quality by Design (QbD). In this paper,
 we examine the effect of various media components and process parameters on the expression level
 and quality of the biotherapeutic. First, risk analysis was performed to shortlist different media
 components based on the literature. Next, experiments were performed to screen these components.
 Eight components were identified for further investigation and were examined for their effect and
 interactions using a Fractional Factorial experimental design. Sucrose, biotin, and pantothenate were
 found to have the maximum effect during Fab production. Furthermore, cyanocobalamin glutathione
 and biotin-glutathione were the most significant interactions observed. Product identification was
 performed with Liquid Chromatography–Mass Spectrometry (LC-MS), the expression level was
 quantified using Bio-layer Interferometry, Reverse Phase-HPLC, and SDS-PAGE, and product quality
 were measured by RP-HPLC. Overall, a five-fold enhancement of the target protein titer was obtained
 (from 5 mg/L to 25 mg/L) using the screened medium components vis-a-vis the basal medium,
 thereby demonstrating the efficacy of the systematic approach purported by QbD.

 Keywords: quality by design; Ranibizumab; design of experiments; media development

1. Introduction
     Monoclonal antibodies (mAb) and their derivatives such as antibody fragments (Fab) and single
chain fragments (scFv) dominate the biopharmaceutical industry with their demonstrated effectiveness
for the treatment of various life-threatening diseases [1]. Recombinant antibody fragments have
considerable commercial potential as these molecules possess a similar antigen binding affinity as that
of the parent molecule with the added advantage of simplified bioprocessing and lower cost because
of production in microbial hosts [2]. Ranibizumab is a recombinant humanized IgG1 kappa isotype
monoclonal antibody fragment designed for intraocular use [3]. It has been approved to treat the
“wet” type of age-related macular degeneration (AMD), a common form of age-related vision loss [4].
However, lower expression levels render the manufacturing uneconomical [4,5].
     Biopharmaceutical process development usually faces a plethora of challenges due to the complex
and heterogeneous nature of biotherapeutic products because of which their complete analytical

Bioengineering 2019, 6, 29; doi:10.3390/bioengineering6020029            www.mdpi.com/journal/bioengineering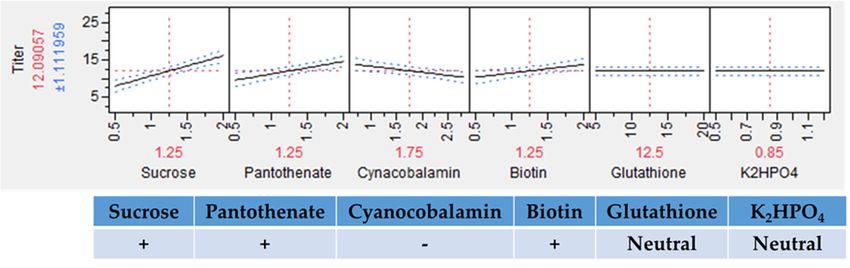
Bioengineering 2019, 6, 29                                                                          2 of 17

characterization is not possible [6]. Media development in upstream processing (USP) is one of the
major challenges due to its significant impact on process productivity, cell growth, and product quality.
Optimization of media, however, remains a non-trivial task due to the significant diversity of media
components and interactions between components and metabolic pathways.
      Traditionally, complex media has been popular due to favourable costing and ease of preparation.
However, lack of knowledge of its composition results in batch to batch variability affecting process
performance as well as product quality [7]. As a result, the use of defined media is steadily increasing
as all the components are well characterized and quantified and, as a result, its use allows for a simpler
purification process with improved reproducibility. In particular, this offers a significant advantage
when process control is to be achieved by means of controlling the growth rate [8]. A variant of a
defined medium is a minimal medium that contains components that are specifically required for
growth including carbon sources (e.g., glucose), inorganic salts, trace elements, vitamins, and amino
acids [8].
      Media components such as amino acids and sugars act as the building blocks of proteins and
nucleotide precursors, respectively. Supplements such as micronutrients and enzyme co-factors further
accelerate cell growth. Excess medium nutrients may lead to the generation of unwanted metabolic
by-products, resulting in reduced cell viability and product yield [9]. High concentration of carbon
source has been shown to result in the diversion of the fermentative pathway to formation of acetic
acid whereas lower than optimal concentrations can result in cell starvation, resulting in cell stress
and favouring the propagation of the plasmid-free population and lower protein production [10].
Consequently, a careful balance is required with respect to concentrations of the various media
components and their interactions with process parameters such as pH, temperature, and agitation for
achieving optimal protein production [11].
      The one factor at a time (OFAT) approach serves as the conventional strategy for design, selection,
and optimization of fermentation media. However, the biopharmaceutical research community has
reached a consensus that for most applications, OFAT is a laborious and time-consuming exercise and,
most importantly fails, to unravel the synergistic interactions of components. Nonetheless, if a large
number of factors are to be examined, OFAT can be useful for screening them prior to performing
design of experiments (DOE) studies. All these efforts are aimed at gaining a deeper understanding of
the process and its effects on the product, in line with principles of Quality by Design (QbD) [12–14].
According to the ICH Q8 guidelines, QbD is a systematic approach which emphasises the building
product quality by better understanding the process itself [15]. Increased process knowledge can
enhance process development by delivering an optimized and robust process [16].
      Optimization of fermentation media is influenced by the nature of the cell line as well as the
therapeutic protein under consideration. Careful optimization of the medium components and process
parameters can minimize the level of process-related impurities in the fermentation broth and, thereby,
reduce the burden of downstream processing, significantly altering the overall process economics.
The rationale behind media optimization is enhancing the final yield of the target product by identifying
the most significant nutrients and, thereafter, optimizing their concentration. In order to assess the
genetic and metabolic burden of the plasmid in recombinant cells, various growth media need to be
screened, finally narrowing it down to the optimal one [17]. Each nutrient and media component
has a unique role to play depending on the cellular environment. Thus, examining these individual
components, as well as their interactions, is of foremost importance. This helps in establishing a
platform process in the early stages of drug discovery under the QbD paradigm, thereby expediting
the overall bioprocess development.
      The objective of this study was to examine the role of the various media components and thereby
create an optimal medium based on QbD principles that would give the high cellular growth of
E. coli together with the high productivity of the Fab product under consideration. First, different
basal media (King’s medium [18], Cossins medium [19], Sletta medium [20], Zhang medium [21],
Champion medium [22], and Riesenberg medium [23]) were shortlisted based on the literature review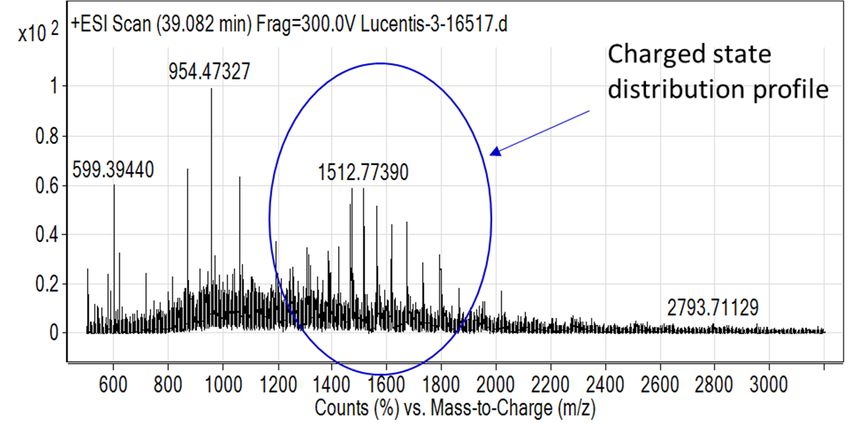
Bioengineering 2019, 6, 29                                                                    3 of 17

and screened for the application at hand. Next, experiments were performed to screen a variety
of media additives and then, based on the results, eight components were identified for further
investigation. Finally, eight components were shortlisted and further examined for their effect and
for their interactions using a Fractional Factorial experimental design. To our knowledge, this is
the first such report involving the optimization of the production media for the production of a
Fab biotherapeutic.

2. Materials and Methods

2.1. Strain and Genetic Construct
     The plasmid was purchased from DNA2.0 (currently ATUM, Newark, CA, USA). The protein
sequence for the heavy and light chains of Ranibizumab was obtained from the Drug Bank (DB01270).
The gene sequence was optimized for E. coli. The sequence was submitted to the NCBI GenBank and
the accession number is MH507507. The plasmid chosen was pD881, a low copy number plasmid
with the kanamycin resistance gene for selection. The rhamnose promoter (rhaBAD) was chosen
for an inducible system. A strong ribosome binding sequence was chosen. Two different secretion
sequences were selected for the heavy and light chain genes, which were the mal and pelB sequences,
respectively. The heavy chain was placed upstream from the light chain and the cloning process
omitted the methionine upstream of the heavy chain gene for fidelity to the original sequence. BL21
(DE3) E. coli cells were transformed with the plasmid for good expression levels and the deletion
of proteases.

2.2. Chemicals and Media
    All chemicals were of the analytical grade and obtained from Sigma Aldrich (St. Louis, MI, USA).
Shake flask cultures were performed with Luria Bertani (LB) broth containing 30 µg/mL of Kanamycin.
Frozen stocks of transformed E. coli were prepared from LB overnight cultures and maintained at
−80 ◦ C with 10% glycerol.

2.3. Screening of Growth Media
     Initially, different growth media including King’s medium [18], Cossins medium [19], Sletta
medium [20], Zhang medium [21], Champion medium [22], and Riesenberg medium [23] were screened
for maximal cell concentration (Table 1). Baffled shake flasks with a capacity of 250 mL containing
50 mL of media were used for bacterial cell culture. Cells were cultivated at 30 ◦ C and 200 rpm and
the culture samples were taken at regular intervals of 1 h and the absorbance (OD) was measured at
600 nm. All experiments were performed in duplicate.

2.4. Purification of Fab Using Capto L Resin
      To confirm the presence of the Fab protein, the concentrated sample was loaded onto Capto L
column pre-equilibrated with equilibration buffer (20 mM Sodium Phosphate, 150 mM NaCl, pH 7.2)
at a flow rate of 0.2 mL/min. The Fab fragment was eluted from the column via isocratic elution
using a buffer (0.1 M Glycine, pH 3.0) at a flow rate of 0.5 mL/min with a dynamic binding capacity
(DBC) of 18 mg/mL and a residence time of 4 min. The pH corresponding to the elution peak of the
Fab was determined to be 3.25 based on a decreasing pH linear gradient elution from 6.0 to 2.5. The
flow-through and elute fractions were stored at 4 ◦ C for further analysis.

2.5. Liquid Chromatography-Mass Spectrometry (LC-MS) of Intact Fab
     The LC-MS of the Fab was performed to determine its molecular mass. RP-HPLC was conducted
using a Zodiacsil column (150 × 4.6 mm) and an Agilent 1260 Infinity Bio-inert Quaternary LC system
coupled to an Agilent 6230 electrospray ionization-time of flight-mass spectrometer (ESI-TOF-MS)
instrument. Gradient elution was carried out with 0.1% (v/v) TFA in MilliQ water (A) and 0.1% (v/v)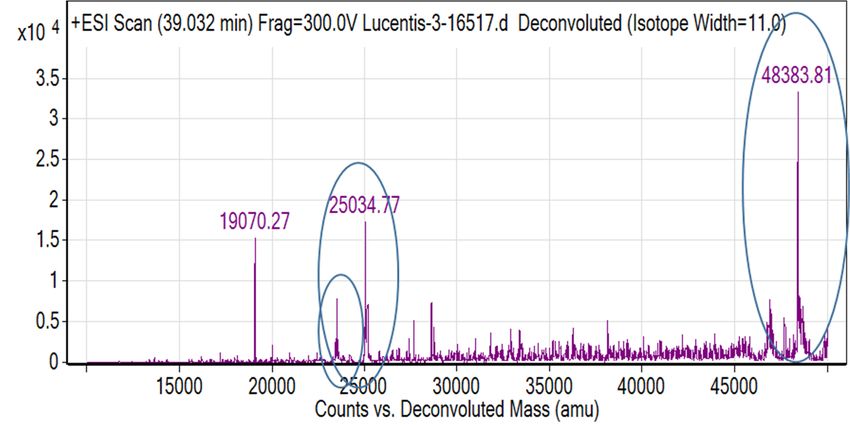
Bioengineering 2019, 6, 29                                                                                    4 of 17

TFA in acetonitrile (B) at 0.5 mL/min and 70 ◦ C from 45% B in 5 min and followed by 45 to 100%
in 25 min. MS was calibrated in the positive ion mode with MS spectra recorded for m/z 500–3200.
The mass spectrum obtained was deconvoluted using the maximum entropy algorithm in the Agilent
MassHunter Qualitative Analysis and BioConfirm Intact Protein workflow. MS source parameters
included a gas temperature of 250 ◦ C, a gas flow rate of 10 L/min, and a nebulizer pressure of 40 psig.
Scan source parameters were as follows: Vcap: 4500, Fragmentor: 300, Skimmer: 65 and Octopole
RFPeak of 750.

                Table 1. The key attributes of different media that were screened for Fab production.

          Medium                                                Components
                              (NH4 )2 SO4 (5.2 g/L), NaH2 PO4 (4.15 g/L), KCl (4.025 g/L), Citric Acid (5.2 g/L),
     Cossins Medium          Glycerol (93.33 g/L), MgSO4 .7H2 O (1.04 g/L), Thiamine Hydrochloride (6.67 mM)
                                                             and Trace Elements *
                             KH2 PO4 (16.6 g/L), (NH4 )2 HPO4 (4.0 g/L), Citric Acid (2.1 g/L), Glucose (20 g/L),
       Sletta Medium
                                                MgSO4 .7H2 O (1.04 g/L) and Trace Elements *
                                  (NH4 )2 SO4 (5.2 g/L) NaH2 PO4 (4.15 g/L) Yeast Extract (5 g/L), Glycerol,
       King Medium
                                                MgSO4 .7H2 O (1.04 g/L) and Trace Elements *
                             Glycerol (20 g/L), KH2 PO4 (20 g/L), (NH4 )2 HPO4 (5 g/L), Na (Pyruvate) (5 g/L),
      Zhang Medium
                             MgSO4 .7H2 O (1.04 g/L), Thiamine Hydrochloride (6.67 mM) and Trace Elements *
                              (NH4 )2 SO4 (55.7 mM), NaH2 PO4 (13.9 mM), K2 HPO4 (21.9 mM), Sodium Citrate
    Champion Medium            (5 mM), KCl (29.6 mM), MgSO4 .7H2 O (14.7 mM), NZ Amine AS (1.11%), Yeast
                                            Extract (1.11%), Glucose (0.11%) and Trace Elements *
                                 Glucose (27.5 g/L), KH2 PO4 (13.3 g/L), (NH4 )2 HPO4 (4.0 g/L), Citric Acid
   Riesenberg Medium         (1.7 g/L), MgSO4 .7H2 O (1.04 g/L), Thiamine Hydrochloride (4.5 mg/L) and Trace
                                                                  Elements *
      * Trace elements include Na-EDTA, MnCl2 , CoCl2 , CuCl2 , H3 BO4 , Na2 MoO4 , Zinc acetate, and Ferric
      ammonium citrate.

2.6. Screening of Process Parameters
     Various physicochemical parameters including pH (6.0–8.0), temperature (20–37 ◦ C), agitation
(150–250 rpm), and inducer concentration (25–150 mM) were screened for their effect on Fab production.
All experiments were performed in duplicate.

2.7. Screening of Various Medium Components Using OFAT Approach
     Various media components including glycine (0.2%), ammonium sulphate (0.4%), di-sodium
succinate (1%), L-proline (0.2 g/L), L-isoleucine (0.2 g/L), ferrous chloride (FeCl2 ) (2.7%), potassium
sulphate (0.18%), aluminium sulphate (2 g/L), biotin (1 mg/L), di-potassium hydrogen phosphate
(K2 HPO4 ) (0.12%), calcium sulphate (0.1%), yeast extract (1%), sodium chloride (1%), ammonium
chloride (0.2%), peptone (2%), pantothenate (1 mg/L), nickel sulphate (25 g/L), cobalt sulphate
(0.75 g/L), cyanocobalamin (1.4 mg/L), sodium ethylenediaminetetraacetic acid (EDTA) (10.5 mg/L),
sodium bicarbonate (1%), ferrous sulphate (FeSO4 ) (0.1%), glutathione (10 mM), sucrose (1%), and zinc
chloride (0.2%) were screened for their effect on Fab production. The Riesenberg medium was used as
the basal medium. Bacterial cells were cultivated at 30 ◦ C and 200 rpm in baffled shake flasks with a
capacity of 250 mL. All experiments were performed in duplicate.

2.8. Fractional Factorial Design Based Two-Level Screening of Selected Medium Components
     A fractional factorial resolution for a design of experiments (DOE) study was performed with
2-factor interactions [24]. Statistical modelling was performed and an empirical correlation was
developed between the media constituents and product titre using the JMP software (SAS Institute,
Cary, NC, USA). The media additives selected were Potassium hypophosphate (K2 HPO4 ), biotin,
glutathione, sucrose, potassium sulphate, calcium sulphate, pantothenate, and cyanocobalamin. Each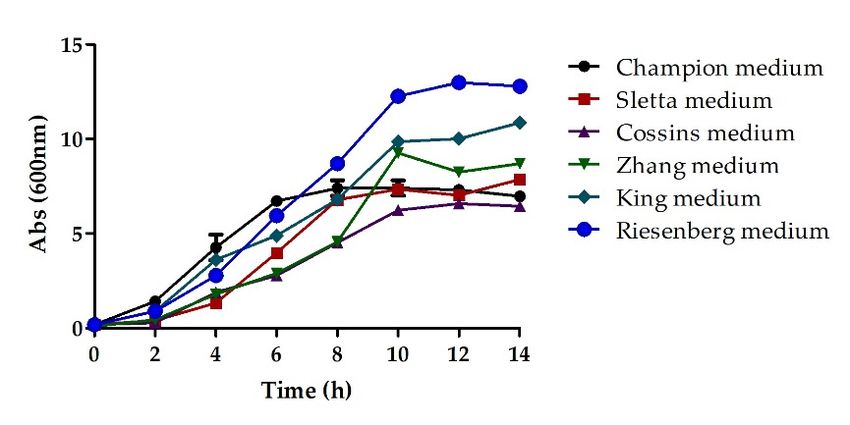
Bioengineering 2019, 6, 29                                                                                   5 of 17

additive was screened at two concentrations (high and low) (Table 2). All experiments were performed
in duplicate.

      Table 2. The assigned concentrations of variables at different levels in the Fractional factorial design
      for Fab production.

                     S. No.             Variables              Lower Level        Higher Level
                        1            K2 HPO4 (%)                     0.5                1.2
                        2           Biotin (mg/L)                    0.5                 2
                        3          Glutathione (mM)                   5                 20
                        4             Sucrose (%)                    0.5                 2
                        5        Potassium Sulfate (%)              0.09               0.36
                        6         Calcium Sulfate (%)               0.05                0.2
                        7      Panthothenic Acid (mg/L)              0.5                 2
                        8       Cyanocobalamin (mg/L)                0.7                2.8

2.9. Periplasmic Protein Extraction
     The periplasmic protein fraction of E. coli was extracted by cold osmotic shock [25]. Briefly,
the harvested bacterial cells were gently suspended in Tris-EDTA-Sucrose (TES) buffer (50 mM Tris
buffer pH 7.4, 1 mM EDTA and 20% sucrose w/v) and were incubated on ice for 30 min. The periplasmic
fraction was separated by centrifuging the cells at 3250 g for 10 min. The supernatant containing
periplasmic protein fraction was concentrated using centrifugal concentrators.

2.10. Fab Quantification by SDS PAGE
     The protein concentration was determined by the Bradford method using bovine serum albumin
as the standard [26]. Absorbance was measured at 595 nm. Protein fractions were analyzed by
SDS-PAGE using 12.5% acrylamide gel. Gels were rinsed three times with Milli Q water, stained with
silver nitrate, and analyzed with the Image J Software.

2.11. Fab Quantification by Reversed-Phase High-Performance Liquid Chromatography (RP-HPLC)
     Samples were analyzed by RP-HPLC on Ultimate 3000 (Dionex, Thermo Scientific) using the
Zodiacsil column (150 × 4.6 mm) operated at 70 ◦ C and with a flow rate of 0.5 mL/min. Mobile phase
A consisted of 0.1% TFA in Milli Q water and mobile phase B consisted of 0.1% TFA in acetonitrile.
Equilibration of the column was achieved using 45% B for 5 min. Elution was performed using a
linear gradient of 45–100% B in 25 min. The column was regenerated using 45% B for 15 min. Protein
detection was performed by UV absorption at 214 nm. Purity was determined based on the area of the
peaks in the chromatogram.

2.12. Fab Quantification by BLI
     Protein L possesses a high affinity for the kappa light chain of antibodies and antibody fragments.
The immunoglobulin binding of IgG to the Protein L does not interfere with its antigen-binding
property [27]. This binding affinity on Protein L biosensors has been used to determine the antibody
or antibody fragment moiety concentration as the interference pattern of light reflected from the
biosensor surface changes upon binding, allowing the association and dissociation events to be
monitored in real time [28]. Octet RED96 (Fortebio, Pall Life Sciences, CA, USA) was used for the
quantification of antibody fragment using Protein L Biosensors (ForteBio part no, 18-5085, Pall Life
Sciences, Port Washington, NY, USA). The standard curve was prepared based on the purified Fab
molecule at concentrations of 5 µg/mL, 10 µg/mL, 15 µg/mL, and 25 µg/mL. To rule out any
possibility of variability with wells, standard curves were repeated in different well locations in
three independent experiments. All samples to be analyzed were diluted in the sample diluent.
The hydration of the protein L sensor was performed in phosphate buffer saline (PBS) at pH 7.4.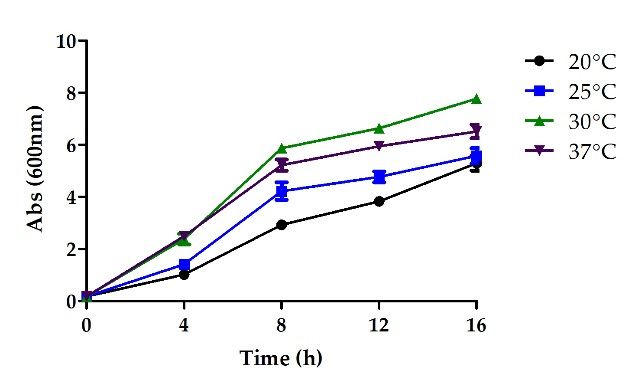
Bioengineering 2019, 6, x FOR PEER REVIEW 6 of 17
Bioengineering 2019, 6, 29 6 of 17
Regeneration was performed in 10 mM glycine (pH 1.5) and the neutralization buffer was kept
identical to the hydration buffer. The control/samples (200 µL/well) and the hydration solution were
Regeneration
placed was corresponding
in the wells performed in 10 mMposition
to the glycineof(pH 1.5) and the
the biosensor neutralization
to be buffer was
used in the analysis kept
and were
identical to the hydration buffer. The control/samples (200 µL/well) and the hydration
hydrated for 10 minutes prior to starting the experiment. Subsequently, samples were quantified at solution
were
130 g placed
for 300ins [28].
the wells corresponding
All experiments to the
were positionatof30
performed the
°C.biosensor
The assaytowas
be used in the analysis
performed and
in the basic
were hydrated for 10 min prior to starting the experiment. Subsequently, samples were
quantitation with the regeneration assay format of the Octet data acquisition software. Data analysis quantified
at 130
was g for 300 susing
performed [28]. the
All Octet
experiments were performed
Data Analysis 30 ◦ C. 7.1
Softwareatversion Thefrom
assayPall
wasLife
performed
Sciences.inThe
the
basic quantitation
acquired data waswith the regeneration
corrected by subtractingassaytheformat
blank of the Octet
matrix fromdata
the acquisition
sample matrixsoftware.
which Data
was
analysis was performed using the Octet Data Analysis
analyzed using the initial slope binding rate equation. Software version 7.1 from Pall Life Sciences.
The acquired data was corrected by subtracting the blank matrix from the sample matrix which was
analyzed
3. Resultsusing the initial slope binding rate equation.
3. Results
3.1. Screening of Basal Growth Media
The selection
3.1. Screening of growth
of Basal Growth media
Media is crucial to attaining the desired productivity and quality [29,30].
Previous studies have shown that the usage of chemically defined media helps achieve better
The selection of growth media is crucial to attaining the desired productivity and quality [29,30].
productivity and reproducibility in a cost-efficient manner [9,31,32]. This approach results in the
Previous studies have shown that the usage of chemically defined media helps achieve better
maximal conversion of the substrates into the product with the simultaneous elimination of
productivity and reproducibility in a cost-efficient manner [9,31,32]. This approach results in
undesirable components that would otherwise interfere with purification. In order to optimize the
the maximal conversion of the substrates into the product with the simultaneous elimination of
media, the concentration and nature of the medium components were examined via shake flask
undesirable components that would otherwise interfere with purification. In order to optimize
experimentation and their impact on growth rate and cell density (Biomass) was examined by
the media, the concentration and nature of the medium components were examined via shake
comparison of optical density. High turbidity was observed in the flask containing the Champion
flask experimentation and their impact on growth rate and cell density (Biomass) was examined
medium and an optical density (OD @600 nm) of 8 was observed after 10 hours of cultures. The high
by comparison of optical density. High turbidity was observed in the flask containing the Champion
turbidity could be attributed to the high concentration of metal ions present in this medium. The use
medium and an optical density (OD @600 nm) of 8 was observed after 10 h of cultures. The high
of Sletta medium yielded a maximum OD of 7.34 after 10 hours of cultures whereas that with Cossins
turbidity could be attributed to the high concentration of metal ions present in this medium. The use of
medium was 6.23, implying low growth. A higher OD of 10 was observed with both Zhang and King
Sletta medium yielded a maximum OD of 7.34 after 10 h of cultures whereas that with Cossins medium
medium after 10 hours. The highest OD after 10 hours of cultures was that of 12.26 with the
was 6.23, implying low growth. A higher OD of 10 was observed with both Zhang and King medium
Riesenberg medium (Figure 1). Thus, the Riesenberg medium was selected as the basal medium for
after 10 h. The highest OD after 10 h of cultures was that of 12.26 with the Riesenberg medium (Figure 1).
all subsequent experiments.
Thus, the Riesenberg medium was selected as the basal medium for all subsequent experiments.
Figure 1. The cell density as a function of time plotted for different basal media.
Figure 1. The cell density as a function of time plotted for different basal media.
3.2. Confirmation of Product Formation
3.2. Confirmation of Product Formation
Capto LTM affinity chromatography was used to purify the target Fab (Figure 2A). The purified
Capto
protein hadLaTM affinity
yield chromatography
of more than 85%. This was
wasused to purify
confirmed bythe
SDStarget
PAGE Fab (Figurewhere
analysis 2A). The purified
a prominent
protein
band was had a yield of
observed atmore than
48 kDa 85%. This
(Figure was confirmed
2B). Figure by SDSthe
2C,D illustrate PAGE analysis
RP-HPLC where a prominent
chromatogram of the
band
Fab standard and the Fab produced. The quantification was achieved by comparing the peak areasthe
was observed at 48 kDa (Figure 2B). Figure 2C,D illustrate the RP-HPLC chromatogram of of
Fab standard protein
the standard and the(known
Fab produced. The quantification
concentration) with that ofwas
the achieved by comparing
target protein the peakextract
in the periplasm areas
of the standard
(pre-filtered) protein
based (known concentration)
on identical retention times.with that of
Figure 3Athe target
shows protein
the chargeindistribution
the periplasm extract
profile of
(pre-filtered) based on identical retention times. Figure 3A shows the charge
the intact Fab with a maximum charge of +32 based on LC/MS analysis. Upon deconvolution by distribution profile of
the
the intact Fab with
maximum a maximum
entropy charge
algorithm, the of +32 mass
intact basedobtained
on LC/MSwas analysis.
48383 Upon deconvolution
Da (Figure 3B) whichbyisthe
in
maximum entropy
agreement with algorithm, mass
the theoretical the intact
of the mass
Fab. Inobtained
addition,was 48383
masses DakDa
of 19 (Figure
and 253B)kDa
which
wereisalso
in
agreement with the theoretical mass of the Fab. In addition, masses of 19 kDa and 25 kDa were also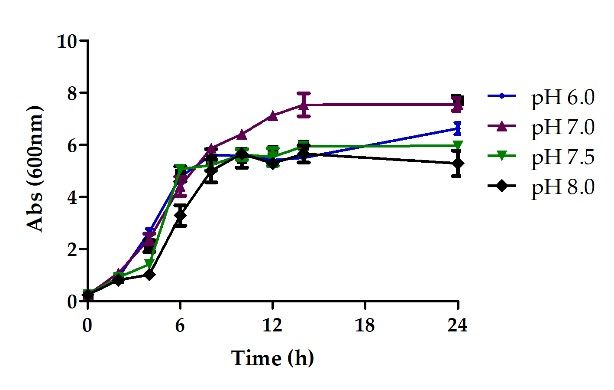
Bioengineering 2019, 6, 29                                                                                              7 of 17
  Bioengineering 2019, 6, x FOR PEER REVIEW                                                                              7 of 17

seen, corresponding
  seen, correspondingto the light
                        to the     chain
                                light    andand
                                      chain  heavy chain
                                                heavy    of the
                                                       chain  ofFab,
                                                                 the respectively. Thus, Thus,
                                                                     Fab, respectively.  the analysis was
                                                                                               the analysis
able to confirm the product   formation.
  was able to confirm the product formation.

                                (A)                                                            (B)

                                                               (C)

                                                               (D)

        Figure2. 2.(A)
      Figure        (A)Chromatogram
                         Chromatogramofofpreparative
                                              preparativescale
                                                            scalepurification
                                                                   purificationofofthe
                                                                                     theFab
                                                                                          Fabusing
                                                                                                usingCapto
                                                                                                         CaptoL Laffinity
                                                                                                                   affinity
        chromatography:absorbance
      chromatography:        absorbance(black
                                          (blacktrace)
                                                  trace)and
                                                         andconductivity
                                                              conductivity(grey
                                                                              (greytrace)
                                                                                      trace)(B)
                                                                                              (B)Confirmation
                                                                                                    ConfirmationofofFabFab
        molecule
      molecule    byby SDS
                     SDS     PAGE.
                          PAGE.      Lane
                                  Lane  M:M:   Protein
                                            Protein     Marker,
                                                      Marker, LaneLane
                                                                     1: 1: Uninduced,
                                                                         Uninduced,       Lane
                                                                                        Lane   2: 2:Uninduced,
                                                                                                     Uninduced,LaneLane3:3:
        Periplasmic
      Periplasmic      extract,
                    extract,    Lane
                             Lane     4: Concentrated
                                  4: Concentrated        periplasmic
                                                    periplasmic  extract,extract,
                                                                          Lane 5:Lane    5: Concentrated
                                                                                  Concentrated                periplasmic
                                                                                                     periplasmic  extract
      (C)extract
          RP-HPLC(C) RP-HPLC     chromatogram
                      chromatogram                of themolecule,
                                      of the standard    standard(D)molecule,
                                                                       RP-HPLC  (D)chromatogram
                                                                                    RP-HPLC chromatogram            of Fab
                                                                                                       of Fab molecule.
        molecule.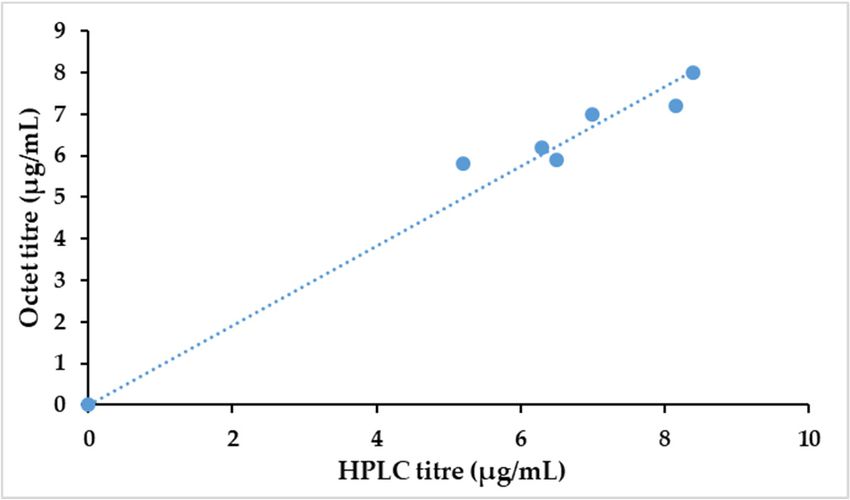
Bioengineering 2019, 6, 29                                                                                8 of 17

Bioengineering 2019, 6, x FOR PEER REVIEW                                                                 8 of 17

                                                   (A)

                                                      (B)

       Figure3.3.The
      Figure     TheLC/MS
                     LC/MS analysis of fab (A) Mass spectrum       De-convolutedmass
                                                    spectrum (B) De-convoluted     massspectrum.
                                                                                       spectrum.The
                                                                                                 Thecircled
                                                                                                     circled
       peaksshow
      peaks  showthetheparent
                        parentmolecules,
                              molecules,heavy
                                         heavychain
                                                chainand
                                                      andlight
                                                           lightchain
                                                                 chainrespectively.
                                                                       respectively.

3.3.
 3.3. Fab
      FabQuantification
          QuantificationUsing
                        UsingBLI
                              BLI
      Figure
      Figure4A,B
              4A,Bpresent
                    presentthe
                            thebinding
                                bindingrate
                                        ratecurve
                                              curveofofthe
                                                        thestandard
                                                            standardmolecule
                                                                       moleculeasaswell
                                                                                    wellas
                                                                                        asexpressed
                                                                                           expressedtarget
                                                                                                       target
protein.
 protein. The reported value of the assay sensitivity for Fab fragment quantification wasin
         The   reported value of the assay  sensitivity for Fab  fragment  quantification  was  inthe
                                                                                                   therange
                                                                                                       range
of
 of0.05–300   µg/mL. The
    0.05–300µg/mL.     The quantification
                           quantification results
                                          results of
                                                   of Fab
                                                      Fab obtained
                                                          obtained using
                                                                     using HPLC
                                                                            HPLC were
                                                                                   were compared
                                                                                         comparedand andBLI
                                                                                                          BLI
HPLC    was  performed   using the samples   without   any  dilution. Differences  between  the
 HPLC was performed using the samples without any dilution. Differences between the titer valuestiter values
obtained
 obtainedusing
           usingthe
                  thetwo
                      twomethods
                          methodswere
                                    wereless
                                          lessthan
                                               than10%,
                                                     10%,which
                                                           whichindicates
                                                                   indicatesthe
                                                                             thecomparability
                                                                                 comparabilitybetween
                                                                                                betweenthethe
two  (Figure  4C).
 two (Figure 4C).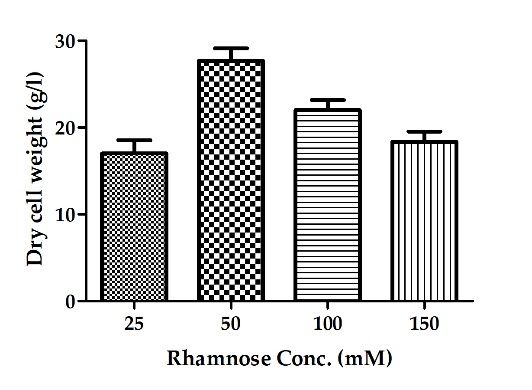
Bioengineering 2019, 6, 29                                                                                   9 of 17
Bioengineering 2019, 6, x FOR PEER REVIEW                                                                   9 of 17

                                                       (A)

                                                       (B)

                                                       (C)
     Figure
     Figure 4.
            4. (A)
                (A) The
                     The real-time
                          real-time binding
                                    binding data
                                              data of
                                                   of the
                                                      the standard
                                                          standard Fab
                                                                     Fab molecule,
                                                                          molecule, (B)
                                                                                    (B) aa graph
                                                                                           graph depicting
                                                                                                 depicting the
                                                                                                           the
     binding rate of the standard  as well as target Fab protein, (C) the comparison  of Fab protein measured
     binding rate of the standard as well as target Fab protein, (C) the comparison of Fab protein measured
     by
     by Octet
        Octet and
               and RP-HPLC
                   RP-HPLC methods.
                               methods.

3.4. Effect of Process Parameters

3.4.1. Effect of Temperature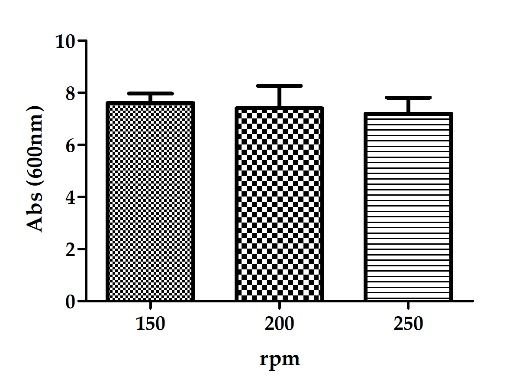
7.5, and 8.0. Maximum OD of 8 was achieved at pH 7.0, which was chosen as the optimum pH for
further studies (Figure 5B).

3.4.3. Effect of Inducer Concentration
      Selecting
Bioengineering 2019,a6,suitable
                        29       expression system is crucial for achieving high productivity, plasmid         10 of 17
stability, and desirable expression [36–38]. The L-rhamnose-inducible promoter is capable of
expressing soluble recombinant proteins that are susceptible to insoluble protein formation at high
3.4. Effect of Process Parameters
concentrations [39]. Protein expression was induced with 25–150 mM rhamnose after 8 hours of
secondary
3.4.1. Effectculture   or when OD of E. coli culture is 8. Cultures were grown at 30 °C for an additional
               of Temperature
8 h. The highest biomass was observed in the culture induced with 50 mM rhamnose compared to
      Once a desired
that obtained    with the chemically    defined
                            other induction        medium
                                                 levels      had5C).
                                                        (Figure   been chosen, the next step was to look at the
various growth co-factors, both physical and physiochemical. This was done in order to determine the
contribution
3.4.4. Effect ofofAgitation
                  each parameter during Fab production. The temperature during a fermentation process
is known to be a critical parameter as it affects plasmid stability, cellular metabolism and growth,
     Agitation
and protein        is required
               solubility  [33,34].to The
                                      achieve    homogenous
                                           literature  suggestsmixing,    thus ensuring
                                                                 that fermentation          uniform availability
                                                                                      at temperatures   below 37 ◦of C
oxygen,   nutrients,    additives,    and   necessary    substrates to  all cells [40].  In order
improves the quality and folding of the recombinant proteins and results in the reduced formation to  determine    the
optimum     agitation
of byproducts            speed for heat
                  and metabolic       our [35].
                                            culture,
                                                  Theprotein
                                                       biomassexpression
                                                                productionwas  wasevaluated
                                                                                   studied atatdifferent
                                                                                                 differentincubation
                                                                                                            agitation
conditions    (150,   200,  250   rpm)    and ◦ protein   expression  was    induced    by
temperatures ranging from 20 to 37 C by incubating the cultures at 200 rpm. Cultivation at  supplementing    5030mM ◦C
rhamnose     at culture   OD  600 nm 6.0. Similar biomass production was observed at◦ all three levels tested
for 12 h in a shake flask led to the highest OD of 10.27 (Figure 5A). Thus, 30 C was selected as the
(Figure
optimum  5D).   Thus, for subsequent
            temperature                    experiments, 200 rpm was chosen for bacterial cultivation.
                            for cultivation.

 Bioengineering 2019, 6, x FOR PEER REVIEW                                                                     11 of 17
                             (A)                                                       (B)

                              (C)                                                       (D)

      Figure 5. The optimization of various physiochemical parameters to enable higher biomass production,
     (A) temperature (B) pH (C) inducer concentration and (D) agitation.
       Figure 5. The optimization of various physiochemical parameters to enable higher biomass
3.4.2. production,
       Effect of pH(A) temperature (B) pH (C) inducer concentration and (D) agitation.
      Another important physiological parameter that significantly impacts cell growth and protein
 3.5. One Factor at a Time (OFAT) Experimentation for Screening of Media Components
stability is the pH of the medium [33]. Shake flask study was performed at pH levels of 6.0, 6.5, 7.0, 7.5,
       To Maximum
and 8.0.   evaluate theODimpact   ofachieved
                           of 8 was   the various
                                               at pHadditives,
                                                      7.0, whichthewas
                                                                    OFAT   approach
                                                                       chosen           was usedpH
                                                                               as the optimum      to for
                                                                                                       screen  the
                                                                                                          further
 factors (Figure
studies   before performing
                   5B).        a DOE. Experiments were performed at 30 °C, pH 7.0, 200 rpm, and with
 50 mM rhamnose. The effect of 25 different additives (e.g., a carbon source, nitrogen source, vitamins,
3.4.3. Effect of Inducer
 and buffering    agents) Concentration
                           were examined and the Fab titer was measured by HPLC. Additives yielding
 recombinant
      Selecting protein  concentration
                 a suitable              greateristhan
                            expression system          8.0 mg/L
                                                   crucial        were considered
                                                           for achieving             to have a plasmid
                                                                          high productivity,   significant  effect.
                                                                                                         stability,
 This  was   chosen  with  respect to  the basal Riesenberg    medium    with no   additives which
and desirable expression [36–38]. The L-rhamnose-inducible promoter is capable of expressing soluble gave   a titer
 of 8.0  mg/mL.    Based  on  these lines, of the  25 additives   examined,   8  nutrients (sucrose,
recombinant proteins that are susceptible to insoluble protein formation at high concentrations [39].  potassium
 sulfate,expression
Protein   calcium sulfate,   dipotassium
                        was induced   with phosphate,
                                            25–150 mMbiotin,
                                                         rhamnosepantothenate,
                                                                     after 8 h ofcyanocobalamin,
                                                                                   secondary cultureglutathione)
                                                                                                        or when
 were   found   to have  the  highest  impact  on  Fab  production
                                                             ◦       (Table  3). Additionally,   a
OD of E. coli culture is 8. Cultures were grown at 30 C for an additional 8 h. The highest biomass higher   purity
 (more than 80%) was observed with these eight additives.
       An optimum source of carbon is crucial to attaining the desired productivity in the culture
 process. The addition of excess glucose in the culture media for the desired biomass production
 would result in the reduction in pH due to the formation of the acetic acid and this which will be
 detrimental to the product quality and also for controlling the pH in shake flasks. This issue can be
Bioengineering 2019, 6, 29 11 of 17
was observed in the culture induced with 50 mM rhamnose compared to that obtained with the other
induction levels (Figure 5C).
3.4.4. Effect of Agitation
Agitation is required to achieve homogenous mixing, thus ensuring uniform availability of oxygen,
nutrients, additives, and necessary substrates to all cells [40]. In order to determine the optimum
agitation speed for our culture, protein expression was evaluated at different agitation conditions (150,
200, 250 rpm) and protein expression was induced by supplementing 50 mM rhamnose at culture
OD600 nm 6.0. Similar biomass production was observed at all three levels tested (Figure 5D). Thus,
for subsequent experiments, 200 rpm was chosen for bacterial cultivation.
3.5. One Factor at a Time (OFAT) Experimentation for Screening of Media Components
To evaluate the impact of the various additives, the OFAT approach was used to screen the
factors before performing a DOE. Experiments were performed at 30 ◦ C, pH 7.0, 200 rpm, and with
50 mM rhamnose. The effect of 25 different additives (e.g., a carbon source, nitrogen source, vitamins,
and buffering agents) were examined and the Fab titer was measured by HPLC. Additives yielding
recombinant protein concentration greater than 8.0 mg/L were considered to have a significant effect.
This was chosen with respect to the basal Riesenberg medium with no additives which gave a titer of
8.0 mg/mL. Based on these lines, of the 25 additives examined, 8 nutrients (sucrose, potassium sulfate,
calcium sulfate, dipotassium phosphate, biotin, pantothenate, cyanocobalamin, glutathione) were
found to have the highest impact on Fab production (Table 3). Additionally, a higher purity (more
than 80%) was observed with these eight additives.
Table 3. The protein titre obtained as a result of the addition of various nutrient additives as found by
the one factor at a time (OFAT) approach.
S. No. Media Additives Concentration Protein Titre (mg/L)
1 CoSO4 (g/L) 0.75 1.24
2 Di-sodium succinate (%) 1.00 2.10
3 NaEDTA (mg/L) 10.50 2.21
4 Nickel sulphate (%) 0.25 2.35
5 Al2 (SO4 )3 (g/L) 2.00 2.75
6 NaCl (%) 1.00 3.34
7 Yeast extract (%) 1.00 4.50
8 Peptone (%) 2.00 4.79
9 Glycine (%) 0.20 4.90
10 NH4 CI (%) 0.20 5.22
11 FeSO4 (%) 0.10 5.73
12 (NH4 )2 SO4 (%) 0.40 5.95
13 L-Isoleucine (g/L) 0.20 6.75
14 FeCl2 (%) 2.70 6.95
15 L-Proline (g/L) 0.20 7.30
16 NaHCO3 (%) 1.00 7.65
17 ZnCl2 (%) 0.20 7.80
18 Panthothenic Acid (mg/L) 1.00 8.30
19 Calcium sulfate (%) 0.10 8.86
20 Potassium sulfate (%) 0.18 8.88
21 Biotin (mg/L) 1.00 10.05
22 Sucrose (%) 1.00 10.65
23 Cyanocobalamin (mg/L) 1.40 12.54
24 K2 HPO4 (%) 0.12 13.80
25 Glutathione (mM) 10.00 16.80
26 Control (no additive) - 8.00Bioengineering 2019, 6, 29 12 of 17
An optimum source of carbon is crucial to attaining the desired productivity in the culture process.
The addition of excess glucose in the culture media for the desired biomass production would result in
the reduction in pH due to the formation of the acetic acid and this which will be detrimental to the
product quality and also for controlling the pH in shake flasks. This issue can be resolved using sucrose
instead of glucose. Besides being a rich source of energy, sucrose aids in the periplasmic expression
of the protein due to the enhanced folding of proteins and osmotic enlargement of the periplasmic
space [9]. This is consistent with the results of our study, in which sucrose resulted in the enhanced
productivity of the Fab molecule (83% higher compared to basal medium) (Table 3).
Maintaining the medium pH is necessary to achieve high productivity and protein stability.
Potassium sulfate and dipotassium phosphate, being buffering agents, enhance the ability to maintain
the desired pH of the medium. Hence, while a higher concentration of potassium sulfate increased
productivity by 53% as compared to the basal medium, the addition of dipotassium phosphate resulted
in a 137% higher productivity (Table 3).
The sulphate ion in bacterial cells is readily utilized upon entering the cell by active transportation
wherein it is activated by the ATP sulfurylase enzyme [41]. This explains the 52% increase in
productivity upon increasing calcium sulfate (0.2%) (Table 3).
E. coli is known to achieve better growth in media that has been supplemented with vitamins
and co-factors [42,43]. These co-factors participate in multiple processes including but not limited
to enzymatic reactions, transcription, translation, and signal transduction. This is why many
researchers [42,43] have demonstrated that the use of co-factors accompanied by NADH/NAD+
in cellular metabolic reactions results in higher biomass (43% higher compared to basal medium)
(Table 3). Pantothenate, the other effective factor from our results, is a carrier of the acyl group which
plays an important role in the formation of coenzyme A [42]. Another cofactor that was found to have
a significant impact is biotin, as it is involved in the transport of CO2 [43]. During the ATP-dependent
carboxylation of acetyl-CoA, the biotin carboxyl carrier protein is part of the acetyl-CoA carboxylase
that serves as a carrier protein in the malonyl CoA formation pathway [43]. In our study, the addition
of biotin enhanced biomass production by 73% compared to the basal medium without biotin (Table 3).
Glutathione, a well-known antioxidant, helps in maintaining the balance between reduction and
oxidation potentials by regulating interconversion of the reduced and oxidized forms (e.g., NAD(P)H/
NAD(P)+) of redox molecules [44]. It also helps to reshuffle incorrectly formed disulfides. Its higher
concentration resulted in a 190% increase in productivity compared to the basal medium (Table 3).
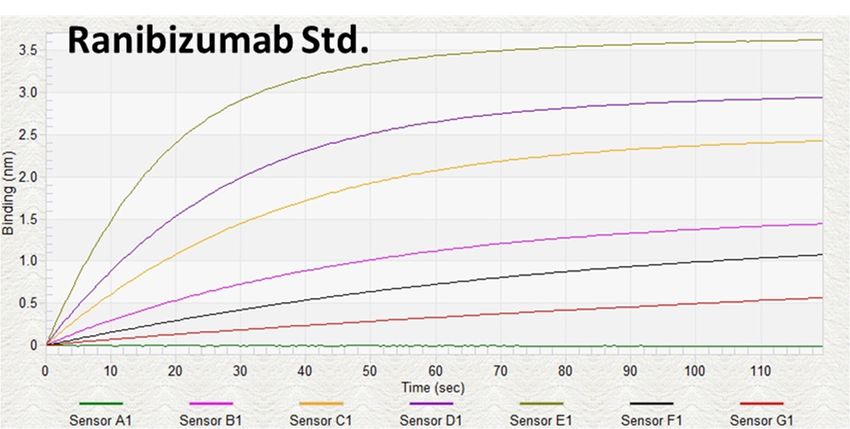
3.6. Screening of Additives using Fractional Factorial DOE
Statistical analysis of the data was performed as per the procedure described earlier. Media
components found to have a significant impact on Fab titer and purity, as estimated by HPLC, were
used to build a model. Carbon source, vitamins, buffering agents, and additives such as sucrose,
potassium sulfate, calcium sulfate, dipotassium phosphate, biotin, pathothenate, cyanocobalamin, and
glutathione were examined in this investigation. The resulting model is illustrated in Figure 6A. It is
evident that the model is statistically relevant (R2 = 0.81, RMSE = 3.15). Sucrose, panthothenate,
cyanocobalamin, K2 HPO4 , biotin, and glutathione are seen to directly impact Fab production
(Figure 6B). The results are in agreement with those from the OFAT study. Among the eight factors
identified in the OFAT study that were further examined through fractional factorial DOE, only six were
found to have a significant effect on Fab production. While concentrations of sucrose, panthothenate,
and biotin are positively correlated to mAb yield, the concentration of cyanocobalamin is negatively
correlated. Sucrose had the highest positive impact on mAb yield. Additionally, a significant level
of interaction was observed between glutathione and K2 HPO4 and an appreciable Fab production
was observed even at their lower concentrations (Figure 6C). Other significant interactions among the
media components included that of glutathione with cyanocobalamin (cyanocobalamin-glutathione)
and biotin (biotin-glutathione) (Figure 6B). Figure 6D depicts the correlation between purity and titerBioengineering 2019, 6, x FOR PEER REVIEW 13 of 17
interaction was observed between glutathione and K2HPO4 and an appreciable Fab production was
Bioengineering
observed even2019, 6,at29their
lower concentrations (Figure 6C). Other significant interactions among13theof 17
media components included that of glutathione with cyanocobalamin (cyanocobalamin-glutathione)
and biotin (biotin-glutathione) (Figure 6B). Figure 6D depicts the correlation between purity and titer
levels and it is seen in the application under consideration that we are able to achieve higher purities
levels and it is seen in the application under consideration that we are able to achieve higher purities
at higher titer values.
at higher titer values.
(A)
(B)
(C)
Figure 6. Cont.Bioengineering 2019, 6, 29 14 of 17
Bioengineering 2019, 6, x FOR PEER REVIEW 14 of 17
(D)
Figure 6. The results of the design
design of
of experiment
experiment (DOE)
(DOE) study
study showing (A) the
the actual
actual vs.
vs. predicted
production; (B)
plot for Fab production; (B) the
the estimates
estimates of
of the
the interactions
interactions amongst
amongstthe
thesorted
sortedparameters,
parameters,**P P < 0.05;
0.05;
prediction profiles
(C) the prediction profiles for
for Fab
Fab production;
production; (D)
(D)the
thecomparison
comparisonof
ofFab
Fabtiter
titervs.
vs.purity.
purity.
4. Discussion
4. Discussion
Fermentation
Fermentation is is arguably
arguably the the most
most vital
vital step
step inin the
the process
process of of biotherapeutic
biotherapeutic production.
production.
Optimization
Optimization of media components and process parameters are crucial for achieving optimized
of media components and process parameters are crucial for achieving optimized
productivity
productivity without compromising on product quality. Owing to the dynamic nature of the various
without compromising on product quality. Owing to the dynamic nature of the various
phases
phases of of bioprocesses,
bioprocesses,the thequality
qualityofofthetheproduct
product primarily
primarily depends
depends on onthethe microenvironment
microenvironment of
of the
the
cell,cell, which
which in turn
in turn is determined
is determined bybythethedesign
designofoffermentation
fermentationmedium mediumasaswell well asas the
the process
process
conditions.
conditions. In light of this, two aspects require due consideration: the role of each media component
In light of this, two aspects require due consideration: the role of each media component
in
in microbial
microbial growth
growth and and the the interactions
interactions among
among the the components. However, it
components. However, it is
is not
not feasible
feasible to to study
study
all
all possible
possible concentrations
concentrations and and combinations
combinations of of the
the myriad
myriad components
components that that are
are typically
typically present
present in in
the media. In this study, we have attempted to identify and optimize
the media. In this study, we have attempted to identify and optimize the critical media components the critical media components
with
with thethe minimum
minimum number number of of experiments,
experiments, as as suggested
suggested in in the
the QbD
QbD paradigm.
paradigm. The The results
results provide
provide
an insight into the effects of the various inorganic compounds and
an insight into the effects of the various inorganic compounds and other media additives towards other media additives towards
maximizing production of
maximizing production of anan antibody
antibody fragment
fragment biotherapeutic.
biotherapeutic. These These findings
findings could
could serve
serve as as the
the
foundation for creating a platform process for the manufacturing
foundation for creating a platform process for the manufacturing of such products in E. coli.of such products in E. coli.
Besides
Besides the the identification
identification of of the
the optimal
optimal medium,
medium, the the significant
significant rolerole ofof process
process parameters
parameters
(temperature,
(temperature, pH, agitation) on cell growth and product quality has also been demonstrated in
pH, agitation) on cell growth and product quality has also been demonstrated in this
this
study, complementing already published research [45]. QbD-based
study, complementing already published research [45]. QbD-based media development was media development was performed
to achieve greater
performed to achieveprocess understanding
greater so as to achieve
process understanding so optimal product
as to achieve titer and
optimal quality.titer
product Besides
and
media
quality.composition,
Besides media certain process parameters
composition, too areparameters
certain process highly criticaltooforarethe protein
highly production
critical for the process.
protein
One such factor that has been identified ◦ C resulted in
production process. One such factoristhat
temperature.
has beenOperating
identifiedat is a temperature
temperature. of 30
Operating at a
optimal
temperatureproteinof 30production
°C resulted in our case, both
in optimal in terms
protein of quality
production inand
our quantity.
case, bothOn in similar
terms of lines; pH and
quality and
agitation
quantity. too have contributing
On similar lines; pH and roles during too
agitation protein
haveproduction.
contributingThese were studied
roles during proteinand tuned to
production.
attain optimum yield and quality.
These were studied and tuned to attain optimum yield and quality.
The inducer concentration
The inducer concentrationand andinduction
inductionperiodperiod areareotherother factors
factors thatthat
affectaffect protein
protein yield.yield.
Just
Just as low inducer levels result in suboptimal induction and low recombinant
as low inducer levels result in suboptimal induction and low recombinant protein yields in the higher protein yields in
the higher concentration of inducer results in the formation of protein
concentration of inducer results in the formation of protein aggregates and protein toxicity, aggregates and protein toxicity,
consequently
consequently diminishing
diminishing thetheproductivity
productivitylevelslevels
[46]. The
[46].crucial
The role of inducers
crucial role ofis well substantiated
inducers is well
by the fact that out of all the inducer concentrations studied, the highest
substantiated by the fact that out of all the inducer concentrations studied, the highest biomass was biomass was attained
particularly with 50 mM
attained particularly withrhamnose at 30 ◦ C and
50 mM rhamnose at 30a °C
pHand
of 7.0
a pHwhen induced
of 7.0 when for 8 h. for 8 hours.
induced
In
In reality,
reality, more
more than
than oneone factor
factor and
and nutrient
nutrient source
source are simultaneously involved
are simultaneously involved in in any
any process,
process,
thus, making Design of experiment (DoE) based studies indispensable
thus, making Design of experiment (DoE) based studies indispensable [47]. Results reveal [47]. Results reveal that sucrose,
that
pathothenate, biotin, and cyanocobalamin have a significant impact
sucrose, pathothenate, biotin, and cyanocobalamin have a significant impact whereas glutathione whereas glutathione and K 2 HPO
and4
K2HPO4 are relatively less significant. A goodness of fit of R2 > 0.80 implies a satisfactory agreement
between the predicted and the actual values. Media additives such as sucrose, pantothenate andBioengineering 2019, 6, 29 15 of 17
are relatively less significant. A goodness of fit of R2 > 0.80 implies a satisfactory agreement between the
predicted and the actual values. Media additives such as sucrose, pantothenate and biotin improved
the Fab expression levels whereas a higher concentration of cyanocobalamin resulted in a reduced
expression. Glutathione and K2 HPO4 produced no appreciable change in the Fab expression levels.
Interesting to note was the reduction in Fab levels due to the interaction between biotin and glutathione,
which underlined the crucial role of interactions among multiple additives in protein production.
It should be highlighted that in most cases, the purity of Fab was higher for the experiments when the
titer was higher.
Implementation of the QbD approach has become inevitable in order to be able to identify and
optimize crucial media components as well as determine the essential interactions amongst them. Thus,
this paper presents the results from an effort to systematically study the impact of media components
and process parameters for the production of a Fab fragment. The growth medium was rapidly
optimized with the aid of the statistical experiment design. The highest fab yield in this study was
25 mg/L, which is a significant yield compared to published reports. The benefits of following a QbD
based approach is well demonstrated.
Author Contributions: Conceptualization, A.S.R., D.K., J.B. and C.K.; methodology, D.K., J.B. and C.K.;
paper writing: D.K.; manuscript review: A.S.R.
Funding: This work was funded by the Department of Biotechnology, Government of India (number
BT/COE/34/SP15097/2015).
Acknowledgments: Authors acknowledge support from Susheelendra Vaidya and Sriram Kumaraswamy from
ForteBio—A Division of Pall Life Sciences for their help with Octet.
Conflicts of Interest: The authors declare that they have no competing interests.
References
1. Walsh, G. Biopharmaceutical benchmarks 2014. Nat. Biotechnol. 2014, 32, 992–1000. [CrossRef] [PubMed]
2. Rathore, A.S.; Batra, J. Antibody Production in Microbial Hosts. BioPharm Int. 2016, 28, 18–23.
3. Zhang, K.; Zhang, L.; Weinreb, R.N. Ophthalmic drug discovery: Novel targets and mechanisms for retinal
diseases and glaucoma. Nat. Rev. Drug Discov. 2012, 11, 541–559. [CrossRef] [PubMed]
4. Mullard, A. Can next-generation antibodies offset biosimilar competition? Nat. Rev. Drug Discov. 2012, 11,
426–428. [CrossRef] [PubMed]
5. Million, R.P. Therapeutic area crossroads: Anti-angiogenesis. Nat. Rev. Drug Discov. 2008, 7, 115–116.
[CrossRef]
6. Rathore, A.S. Follow-on protein products: Scientific issues, developments and challenges. Trends Biotechnol.
2009, 27, 698–705. [CrossRef]
7. Thiry, M.; Cingolani, D. Optimizing scale-up fermentation processes. Trends Biotechnol. 2002, 20, 103–105.
[CrossRef]
8. Yee, L.; Blanch, H.W. Defined media optimization for growth of recombinant Escherichia coli X90. Biotechnol.
Bioeng. 1993, 41, 221–230. [CrossRef]
9. Ukkonen, K.; Veijola, J.; Vasala, A.; Neubauer, P. Effect of culture medium, host strain and oxygen transfer on
recombinant Fab antibody fragment yield and leakage to medium in shaken E. coli cultures. Microb. Cell Fact.
2013, 12, 73. [CrossRef]
10. Eiteman, M.A.; Altman, E. Overcoming acetate in Escherichia coli recombinant protein fermentations. Trends
Biotechnol. 2006, 24, 530–536. [CrossRef]
11. Kipriyanov, S.M.; Moldenhauer, G.; Little, M. High level production of soluble single chain antibodies in
small-scale Escherichia coli cultures. J. Immunol. Methods 1997, 200, 69–77. [CrossRef]
12. Rathore, A.S. Quality by design (QbD)-based process development for purification of a biotherapeutic.
Trends Biotechnol. 2016, 34, 358–370. [CrossRef] [PubMed]
13. Rathore, A.S. QbD/PAT for bioprocessing: Moving from theory to implementation. Curr. Opin. Chem. Eng.
2014, 6, 1–8. [CrossRef]
14. Rathore, A.S.; Winkle, H. Quality by design for biopharmaceuticals. Nat. Biotechnol. 2009, 27, 26. [CrossRef]
[PubMed]Bioengineering 2019, 6, 29 16 of 17
15. ICH Harmonised Tripartite Guideline. Pharmaceutical development. Q8 (2R). As Revis, 23 August 2009.
16. Rathore, A.S. Roadmap for implementation of quality by design (QbD) for biotechnology products. Trends
Biotechnol. 2009, 27, 546–553. [CrossRef]
17. Saida, F.; Uzan, M.; Odaert, B.; Bontems, F. Expression of highly toxic genes in E. coli: Special strategies and
genetic tools. Curr. Protein Pept. Sci. 2006, 7, 47–56. [CrossRef]
18. King, D.J.; Byron, O.D.; Mountain, A.; Weir, N.; Harvey, A.; Lawson, A.D.G.; Proudfoot, K.A.; Baldock, D.;
Harding, S.E.; Yarranton, G.T.; et al. Expression, purification and characterization of B72. 3 Fv fragments.
Biochem. J. 1993, 290, 723–729. [CrossRef]
19. Cossins, A.J.; Harrison, S.; Popplewell, A.G.; Gore, M.G. Recombinant production of a VL single domain
antibody in Escherichia coli and analysis of its interaction with peptostreptococcal protein L. Protein Expr.
Purif. 2007, 51, 253–259. [CrossRef]
20. Sletta, H.; Nedal, A.; Aune, T.E.V.; Hellebust, H.; Hakvåg, S.; Aune, R.; Ellingsen, T.E.; Valla, S.; Brautaset, T.
Broad-host-range plasmid pJB658 can be used for industrial-level production of a secreted host-toxic
single-chain antibody fragment in Escherichia coli. Appl. Environ. Microbiol. 2004, 70, 7033–7039. [CrossRef]
21. Zhang, C.; Chen, X.; Zou, R.; Zhou, K.; Stephanopoulos, G.; Too, H.-P. Combining genotype improvement
and statistical media optimization for isoprenoid production in E. coli. PLoS ONE 2013, 8, e75164. [CrossRef]
22. Champion, K.M.; Nishihara, J.C.; Joly, J.C.; Arnott, D. Similarity of the Escherichia coli proteome upon
completion of different biopharmaceutical fermentation processes. Proteomics 2001, 1, 1133–1148. [CrossRef]
23. Riesenberg, D.; Schulz, V.; Knorre, W.A.; Pohl, H.-D.; Korz, D.; Sanders, E.A.; Ross, A.; Deckwer, W.-D. High
cell density cultivation of Escherichia coli at controlled specific growth rate. J. Biotechnol. 1991, 20, 17–27.
[CrossRef]
24. Kumar, V.; Bhalla, A.; Rathore, A.S. Design of experiments applications in bioprocessing: Concepts and
approach. Biotechnol. Prog. 2014, 30, 86–99. [CrossRef] [PubMed]
25. Erdag, B.; Koray Balcioglu, B.; Ozdemir Bahadir, A.; Serhatli, M.; Kacar, O.; Bahar, A.; Seker, U.O.S.;
Akgun, E.; Ozkan, A.; Kilic, T.; et al. Identification of novel neutralizing single-chain antibodies against
vascular endothelial growth factor receptor 2. Biotechnol. Appl. Biochem. 2011, 58, 412–422. [CrossRef]
[PubMed]
26. Bradford, M.M. A rapid and sensitive method for the quantitation of microgram quantities of protein
utilizing the principle of protein-dye binding. Anal. Biochem. 1976, 72, 248–254. [CrossRef]
27. Nilson, B.H.K.; Lögdberg, L.; Kastern, W.; Björck, L.; Åkerström, B. Purification of antibodies using protein
L-binding framework structures in the light chain variable domain. J. Immunol. Methods 1993, 164, 33–40.
[CrossRef]
28. Rathore, A.S.; Kumar, D.; Batra, J.; Krull, I. Biolayer Interferometry as an Alternative to HPLC for measuring
Product Concentration in Fermentation Broth. LC GC N. Am. 2017, 35, 870–877.
29. Shokri, A.; Sandén, A.; Larsson, G. Cell and process design for targeting of recombinant protein into the
culture medium of Escherichia coli. Appl. Microbiol. Biotechnol. 2003, 60, 654–664. [CrossRef]
30. Sørensen, H.P.; Mortensen, K.K. Advanced genetic strategies for recombinant protein expression in Escherichia
coli. J. Biotechnol. 2005, 115, 113–128. [CrossRef]
31. Huang, C.-J.; Lin, H.; Yang, X. Industrial production of recombinant therapeutics in Escherichia coli and its
recent advancements. J. Ind. Microbiol. Biotechnol. 2012, 39, 383–399. [CrossRef]
32. Carter, P.; Kelley, R.F.; Rodrigues, M.L.; Snedecor, B.; Covarrubias, M.; Velligan, M.D.; Wong, W.L.T.;
Rowland, A.M.; Kotts, C.E.; Carver, M.E.; et al. High level Escherichia coli expression and production of a
bivalent humanized antibody fragment. Nat. Biotechnol. 1992, 10, 163–167. [CrossRef]
33. Dragosits, M.; Frascotti, G.; Bernard-Granger, L.; Vázquez, F.; Giuliani, M.; Baumann, K.;
Rodríguez-Carmona, E.; Tokkanen, J.; Parrilli, E.; Wiebe, M.G.; et al. Influence of growth temperature
on the production of antibody Fab fragments in different microbes: A host comparative analysis. Biotechnol.
Prog. 2011, 27, 38–46. [CrossRef] [PubMed]
34. Cabilly, S. Growth at sub-optimal temperatures allows the production of functional, antigen-binding Fab
fragments in Escherichia coli. Gene 1989, 85, 553–557. [CrossRef]
35. Gasser, B.; Saloheimo, M.; Rinas, U.; Dragosits, M.; Rodríguez-Carmona, E.; Baumann, K.; Giuliani, M.;
Parrilli, E.; Branduardi, P.; Lang, C.; et al. Protein folding and conformational stress in microbial cells
producing recombinant proteins: A host comparative overview. Microb. Cell Fact. 2008, 7, 11. [CrossRef]
[PubMed]You can also read