You Won't Believe Our Results! - But They Might: Heterogeneity in Beliefs About The Accuracy of Online Media - OSF
←
→
Page content transcription
If your browser does not render page correctly, please read the page content below
You Won’t Believe Our Results!
But They Might: Heterogeneity in Beliefs About The Accuracy of
                       Online Media
                   Preliminary Draft

           Mario Luca∗          Kevin Munger†      Jonathan Nagler‡
                                 Joshua A. Tucker§

                                  January 2, 2020

                                        Abstract
          “Clickbait” media has long been espoused as an unfortunate conse-
      quence of the rise of digital journalism: faced with new monetary incen-
      tives driven by digital advertising, journalists are forced to chase “clicks”
      at the expense of high quality news. But little is known about why readers
      choose to read clickbait stories. Is it merely curiosity, or might voters think
      such stories are more likely to provide useful information? We provide a
      first test of this question with a survey experiment conducted in Italy,
      where a major political party, the Five Star Movement, enthusiastically
      embraced the aesthetics of new media and encouraged their supporters
      to distrust legacy outlets in favor of online news. We offer respondents a
      monetary incentive for correct answers, and thus manipulate the relative
      salience of the motivation for accurate information. Surprisingly, this in-
      centive increases differences in the preference for clickbait; older and less
      educated subjects become even more likely to opt to read a story with a
      clickbait headline when the incentive to produce a factually correct an-
      swer is higher. In contrast to other explanations for the rise of low-quality
      online media, our model suggests that a politically relevant subset of the
      population prefers clickbait media because they trust it more.

  ∗ Sciences Po Paris, Economics Department, mario.luca@sciencespo.fr
  † Penn  State University, Political Science Department, kmm7999@psu.edu
   ‡ New York University, Politics Department, Center for Social Media and Politics,

jonathan.nagler@nyu.edu
   § New York University, Politics Department, Center for Social Media and Politics,

joshua.tucker@nyu.edu

                                            1
1 Utility and Media Choice
A central parameter in the study of political media is the process by which the
public selects media to consume. The degree to which media exposure happens
incidentally or as the result of an explicit choice varies with both the individual
and the larger sociotechnical context, and while incidental and explicit exposure
are both large components of the media diet, the latter is particularly relevant
in the “hyperchoice“ context of contemporary online media( Arceneaux and
Johnson 2013; Messing and Westwood 2012 ).
Faced with either a blank search bar or a “feed” of articles on a social media
platform (eg Facebook) or general interest web portal (eg MSN News), the citi-
zen must take some action. She can “scroll“ through the feed—a prominent form
of online behavior akin to browsing newspaper headlines but far more extensive
in terms of content (Settle 2018)—but the central act of media consumption
only takes place after she makes a selection or “clicks”. Indeed, fewer and fewer
people navigate directly to media companies’ homepages, and even then they
have to select an article to read or video to watch (Guess 2016).
The increasing centrality of consumer choice has not been met with suffi-
cient attention by scholars of political communication. Although there is a large
literature on online media choice (especially from UT Austin’s Center for Me-
dia Engagement), Sood and Lelkes 2018 identify a key theoretical limitation.
The robust evidence of the preference for information from congenial sources
conflates two possible effects: the preference for congenial information, and the
belief in the greater accuracy of congenial sources.
Here, we present results from an experiment that transcends this limitation.
We collect an experimental sample of Italian Facebook users through a paid
advertisement. The sample is thus not representative of the general population,
but should be quite representative of the actual population of interest: people
who click on links on Facebook. Italy is a useful case study because it has in
many ways been ahead of the rest of the West in terms of disillusionment with
the media establishment (due to its close ties with long time Prime Minister
Silvio Berlusconi, who was himself the controlling shareholder in Medianet, a
major Italian media firm) and the ensuing rise to power of anti-establishment
politicians who embrace the credibility-through-virality that clickbait entails.
We first present subjects with a series of non-experimental choice tasks to
estimate their individual “preference for clickbait,” and the distribution of this
propensity across the sample population. We replicate the findings in Munger
et al (2020) that the elderly, the less educated, and the less digitally literate
2have a higher “preference for clickbait”; we also find this to be higher among
women, frequent internet users, and supporters of the ruling coalition.
For the experiment, we again present subjects with a choice of several news
articles, varying the ideological slant and the level of clickbait, but this time re-
spondents are told that they will read the article they rank highest. In addition,
subject are then randomly assigned into one of two treatments conditions: being
told there will be a quiz on the material, or being told there will be a quiz on
the material and that providing correct answers to the quiz will increase their
chance of winning a lottery for a financial prize; the control group is simply told
they will read the article.1
There are no direct effects of the addition of the financial incentive, but
this masks significant and offsetting heterogeneous treatment effect. The treat-
ment increased the preference for clickbait among the elderly, the less educated,
and less digitally literate, while at the same time it decreased the preference
for clickbait among those on the other ends of these respective distributions.
The heterogeneity in “preference for clickbait“ thus increases in the financial
incentive for accuracy. This finding contrasts with the results in (Prior and
Lupia 2008) and (Prior, Sood, Khanna, et al. 2015), which find that increasing
financial incentives decreases heterogeneity in civic knowledge and perceptions
of the economy. Even more importantly, the result provides strong evidence for
the hypothesis that people who prefer clickbait headlines do so because they
consider them more likely to be accurate. More generally, this finding supports
a theory of media choice that more heavily weights perceived source accuracy
than preference for congenial information.
The troubling implication of this finding in the current context is that people
may not be opting to consume low-quality news sources because they are being
cognitively lazy (Pennycook and Rand 2019) or because they lack the savvy
to differentiate low and high quality news. Instead, our results suggest that—
for a certain subset of elderly, pro-populist, less-educated individuals—they are
opting to consume low-quality news sources because they actually trust them
more.
1 Financial incentives have been shown to improve accuracy in answering civic knowledge
questions and reporting the state of the economy by increasing the salience of accuracy relative
to the other determinants of survey response (Prior and Lupia 2008; Prior, Sood, Khanna,
et al. 2015). Our experiment, however, is the first (to our knowledge) to apply this design in
the context of media choice.
32 Online Media and the Italian Context
In many ways, Italy has been a bellwether for the trends in media and pop-
ulism that have swept through Western democracies in recent years. Silvio
Berlusconi’s lengthy tenure in power has been followed by a series of short-lived
center-left governments. More recently, Matteo Salvini, secretary of the far-right
party Lega, has taken Berlusconi’s place as leader of the Italian right, espousing
a populist and xenophobic agenda.
Largely as a result, Italy was also the first European nation to be governed
by a coalition of new-wave populist parties: Lega and Movimento Cinque Stelle.
These parties experienced rapid growth in the past 10 years, attacking both the
legacy media and the traditional parties as part of the same corrupt establish-
ment.2
Both parties, who were together in a coalition government at the time when
our study was conducted, have encouraged their voters to acquire information
through online outlets and affiliated Facebook pages (Santoro 2012). The mech-
anisms for generating credibility in this context are completely different from
the broadcast era of media. In particular, these mechanisms include “credi-
bility cascades,” where the extent of the spread of a given piece of news (as
quantified by social media likes and shares) can generate credibility even for
stories produced by media firms with little name recognition (Munger 2019).
Munger (2019) calls this “Clickbait Media,” and indeed the clickbait headline
is indicative of a news outlet that understands the existence of this type of
audience.
In Italy, this kind of communication was adopted early and successfully
by the comedian, blogger and founder of the Movimento Cinque Stelle Beppe
Grillo, whose blog became a centralized platform for all the important commu-
nications of the party, as well as “counter-information” articles reporting news
that mainstream media would (Grillo claimed) not report. The internet and
unmediated communication between the party and its voters played a crucial
role in the emergence of the Movimento (Bordignon and Ceccarini 2013) and
Grillo’s communication has always been characterised by emotionally-charged
wording and a strong critique of the establishment and printed media.
The structural reasons for the emergence of Clickbait Media are complex,
2 Salvini’s Lega was born as an independence movement for the North of Italy in the 1990s.
As such, it never managed to go beyond 10% at the national level until Salvini changed its
political message to a xenophobic anti-establishment one, receiving vote totals of 17.6% in
2018 and 34.3% in 2019. Luigi Di Maio’s Movimento Cinque Stelle ran for the first time in a
general election in 2013, obtaining 25.6% of the votes and improved its performance in 2018
to 32.7%.
4and outside the scope of this paper. But there exists an intrinsic connection
between the business model of Clickbait Media and the style of headline that
gives it that name. We argue that this style serves as a signal to readers that
the media firm is not aligned with the legacy media establishment.
3 Theory and Hypotheses
Clicking on a link is central to the process of online media consumption, and
thus is reflected in the behavior of online media firms. Munger (2019) describes
the market dynamics of “Clickbait Media“ in which each online news story must
compete with thousands of other stories for the audience’s attention. Hundreds
of new online media firms employ a novel business model enabled by two in-
terrelated features of Clickbait Media: the sharing or retweeting of posts along
homophilous social networks and the quantified accretion of these decisions in
the form of the number of likes (or shares, or retweets) associated with a given
post.
The role of social recommendation in online media choice is thus larger to-
day than in previous media contexts, but other theories of media choice remain
very much relevant. Sood and Lelkes (2018) summarize the state of this litera-
ture, explaining the empirical regularity of consumers’ preference for congenial
sources. The key argument is the need to conceptually differentiate preference
for congenial sources from preference for congenial information. The former is
well-established but often naively assumed to be caused by the latter; Sood and
Lelkes (2018) make the case that the preference for congenial sources is also a
function of perceived accuracy.
The other major implication of Clickbait Media is the massive expansion in
the number of media firms and articles from which to choose. The expansion of
the media choice set reveals previously unobservable heterogeneities in consumer
preference; the most famous example is Markus Prior’s argument that the roll
out of cable television revealed that many Americans had a high “preference for
entertainment” and thus opted out of viewing any television news if given the
option of more and better entertainment programs (Prior 2007).
In the early days of the internet, online headlines were no different from
newspaper headlines. But the development of “clickbait” headlines by web na-
tive media firms like Upworthy in the early 2010s introduced a new dimension
of preference heterogeneity. Munger et al (2020) demonstrate that this “pref-
erence for clickbait“ varies widely among the US population. Republicans, the
elderly and the less educated tend to prefer clickbait headlines, holding the topic
5constant and in the absence of source or social recommendation cues. Possible
explanations for this variation is simply that these people are less “digitally
literate” (Hargittai 2001; Hargittai, Piper, and Morris 2018) or lower in analyt-
ical reasoning (Pennycook and Rand 2019), also posited as explanations for the
related propensity to consume or share “fake news” (Guess, Nagler, and Tucker
2019).
The key limitation of these studies is the same described in Sood and Lelkes’
summary of broader theories of selective exposure: an inability to differentiate
between theoretically distinct mechanisms underlying media preferences (Sood
and Lelkes 2018).
Our approach to address this problem is to adapt the framework used in
(Prior and Lupia 2008; Prior, Sood, Khanna, et al. 2015) and experimentally
add incentives for correct answers, thereby raising the relative salience of the
motivation for accuracy. In (Prior, Sood, Khanna, et al. 2015), the behavior of
interest is how people respond to survey questions that probe their perception
of economic conditions. Analogously to our context, these respondents face
incentives that can be in conflict: the desire to be accurate and the desire to
report congenial information. In these studies, the addition of an incentive for
accuracy decreases the heterogeneity of the responses, suggesting that in the
absence of the desire to report congenial information, people’s estimates would
be centered on the truth.
The situation with contemporary media choice is different. Our theory is
that some people have a preference for clickbait that is linked to a sense that
legacy media is aligned with the distrusted political establishment, and that it
is only from new online sources that employ the distinctive style of partisan
emotional clickbait that can be trusted. Some other people have a preference
for non-clickbait based on the analogous idea that only information from vetted
and reputable media outlets can be trusted.
As a result, our hypothesis is that the addition of incentives for accuracy will
increase the heterogeneity in media choice, along the dimensions that predict
non-experimental preference for clickbait. First, we aim to replicate findings
about this preference for clickbait from the US context: it is higher among the
elderly, the less educated and the less digitally literate.
Hypothesis 1 Non-experimental preference for clickbait will be higher among
the elderly, the less educated and the less digitally literate.
Next, we test our main hypothesis:
6Hypothesis 2 The addition of incentives for accuracy will increase the het-
erogeneity in the selection of clickbait headlines along the dimensions of age,
education and digital literacy.
4 Sampling and demographic characteristics
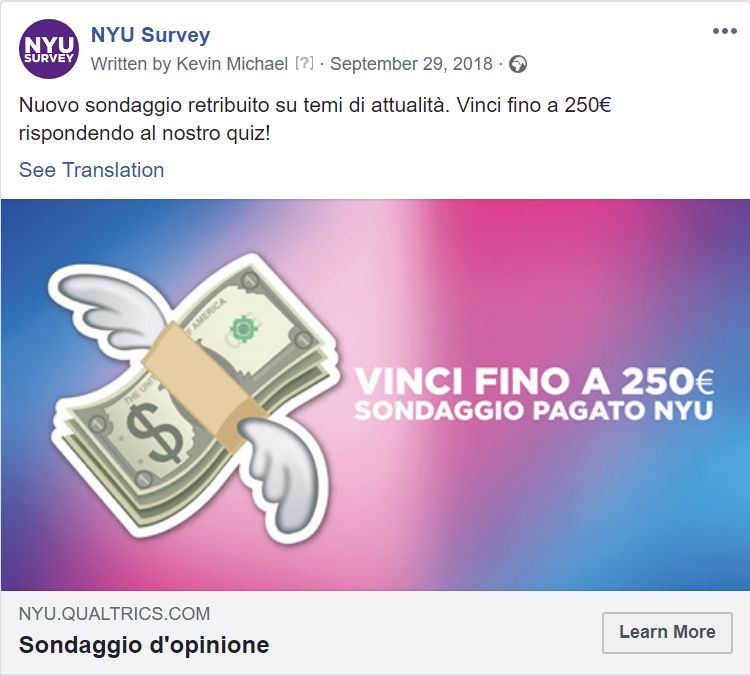
We recruited subjects to participate in a Qualtrics Survey using a Facebook ad
campaign, following the model of Munger et al (2020). The ad simply promoted
a survey about “news consumption,” and offered the possibility to enter a raffle
to win e 250 to all participants who finished the 15-minute survey.
The campaign ran between September 28 and October 15, 2018. Overall,
around 540,000 people were exposed to the ad, 16,000 people clicked on the ad,
4,104 started the survey and 1,754 finished it. Most attrition was in the very
early stages of the survey, and was not related to treatment conditions.
The campaign was run using Facebook’s tool for promoting pages, which
automatically “learns“ the optimal target population to maximize the number
of clicks to the link. As a result, we did not specify who was exposed to the ad,
though we do have ex-post information on demographic characteristics.
Table 2 presents the full demographic breakdown. As in related studies on
the “demand for spam” (Redmiles, Chachra, and Waismeyer 2018), women are
overrepresented (72%), while we manage to capture a very heterogeneous pop-
ulation in terms of age and other main covariates. Although not representative
of citizens, voters, or even Facebook users, the population contains sufficient
variation in the demographics of interest.
The other variables listed in Table 2, and included in our analyses, follow.
Education is a measure on a 1 to 5 scale of the respondent’s level of education;
Like GVT measures on a 1 to 7 scale how much the respondent likes the Conte
Government, a coalition of the populist Movimento Cinque Stelle party and
the far-right Lega. All of the following variables are on a 1 to 7 scale where 7
means “Very Often”: Internet refers to how often respondents use the Internet;
Facebook and Twitter refer to the how often they use these named social media
platform; and News Offline and News Online refer to how often they consume
news on TV and newspapers or on web magazines, blogs and social media.
Finally, Digital Literacy is a % score on the 14 questions that comprise (Hargittai
2005)’s measure of “digital literacy”: respondents are asked to declare how
familiar they are with a set of computer-related terms (eg phishing, selfie, tag).
Interspersed with measurement questions, we also include an attention check.
We ask people to answer “65 ” to a question to show they are not replying
7randomly. Of the 1,754 initial respondent, 1,537 passed the attention check.
In our analysis, we restrict our focus to people who passed the (pre-treatment)
attention check.3
5 Experimental design
Prior to the experiment, we asked respondents to rank a set of fictional head-
lines in order from “most prefer to read” to “least prefer to read,” to estimate
each individual’s taste for clickbait media. The headlines have the following
structure:
• Clickbait - Pro Government (henceforth, CB Pro);
• Non Clickbait - Pro Government (henceforth, NCB Pro);
• Clickbait - Anti Government (henceforth, CB Ag);
• Non Clickbait - Anti Government (henceforth, NCB Ag);
• Neutral.
We follow Munger et al (2019) and create partisan clickbait headlines by the
addition of phrases like “This will make you furious...” or “You won’t believe
this! ...” to headlines with a strong partisan valence. The full list of headlines
(and their English translations) are found in the Appendix.
We took several steps to mimic the style of Italian media. We first studied
clickbait-news outlets, following examples provided by the main Italian website
for debunking fake-news butac.it. We selected only topics that were politically
controversial, where each side (Pro and Anti government) had a clear stance.
We then wrote headlines changing the slant and the style to provide something
that would look like it was published from either a slanted newspaper (e.g. La
Repubblica or Il Giornale) or from a non-traditional news outlet (e.g. Infor-
mareXResistere or Matteo Renzi News). While a reader who is not accustomed
to Italian politics might not catch the tokens that point to the slant and style
of the headline, we believe that any Italian reader could easily guess these char-
acteristics by the headline alone.
3 It is also worth noting that, despite the fact that we targeted our advertisement at people
who were 18 or older, 38 respondents self reported as 17 or younger. This is an important issue
of which future researchers using Facebook opt-in samples need to be aware. In accordance
with our IRB approval, we deleted all data regarding these under-aged respondents.
8In addition to the four slanted headlines, Neutral headlines report events
without a clear slant or a clickbait style. They are designed to imitate sources
with a sober style, with no implicit judgment on the Government.
The pre-treatment section consisted of two sets of 5-headline choices that
needed to be ordered in terms of preference to read. We then use this ordering
to construct the individual-level measure of preference for clickbait (CB-Score):
we assigned 4 points if a clickbait headline was ranked first, 3 if ranked second,
and so on. The maximum CB-Score is 14, which would result if a user ranked the
two clickbait headlines in the top two positions for both batches (i.e., 4+3+4+3
points, adding up to 14). The mean value of this variable is 6.7, the median is 7.
This variable is a strong predictor of the likelihood of choosing clickbait in the
second part of the survey and is a crucial control for ex-ante taste for clickbait.
Table 1 shows that older, less educated, more pro-government, less tech-
savvy people are more likely to choose clickbait. In column (1) we regress the
CB-Score discussed above on the characteristics of the reader. In column (2)
we run a Probit on the likelihood of ranking a CB article in the first position at
least once. Both models show the strong link between choosing Clickbait and
the age, gender, education and digital literacy of subjects. This finding – to the
best of our knowledge for the first time in the Italian context – nicely replicates
previous research from the United States. However, in the Italian case, we also
find a relationship between support for the government and taste for clickbait
after controlling for other demographics.
5.1 Incentivized Article Selection
Next, we implement our experimental manipulation in order to understand the
mechanism that explains variation in taste for clickbait. In this section, subjects
had to rank 5 headlines with the same structure as above, but they were told
that they would then read the article they put in the first position.
Our experimental manipulation involves changing the message that subjects
receive before selecting a headline. All of the articles cover a cut in expenditure
for pensions in the House of Representatives (Camera dei Deputati ), which was
one of the main campaign issues for the largest party in government (Movimento
Cinque Stelle) during the electoral campaign. We have 3 treatment conditions:
• No Incentive: Respondents were told that they would have the chance
to read the article they put on the top of the list
• Intrinsic Incentive: No Incentive + they were told that there would be
a quiz on the topic covered by the article
9Table 1: Taste for CB
OLS Probit
(1) (2)
∗∗∗
Education −0.089 −0.188∗∗∗
(0.020) (0.039)
Age 0.002∗ 0.007∗∗∗
(0.001) (0.003)
Men −0.127∗∗∗ −0.227∗∗∗
(0.040) (0.080)
Internet 0.067∗∗ 0.133∗∗
(0.031) (0.060)
Facebook 0.0002 −0.004
(0.013) (0.026)
Twitter 0.002 0.007
(0.011) (0.022)
Like GVT 0.045∗∗∗ 0.102∗∗∗
(0.010) (0.021)
Often Online −0.011 −0.036
(0.015) (0.030)
Often Offline 0.011 0.036∗
(0.010) (0.019)
Dig Literacy −0.761∗∗∗ −1.564∗∗∗
(0.159) (0.318)
Constant 0.761∗∗∗ 0.224
(0.231) (0.454)
Observations 1,439 1,439
R2 0.089
Adjusted R2 0.083
Log Likelihood -906.197
Akaike Inf. Crit. 1,834.393
∗∗∗
p < 0.01, ∗∗ p < 0.05, ∗ p < 0.1.
In column (1) we show the results of an OLS regression having the Clickbait
Score as dependent variable. In columns (2) we show the results of a Probit
model on the likelihood of choosing at least one Clickabit article as first article.
Coefficients and standard errors in brackets.
10• Monetary Incentive: Intrinsic Incentive + users were told that there
would be a second raffle for a e 250 voucher and that their likelihood
of winning would increase based on how many answers to the factual
questions they answered correctly.
The monetary incentive is exactly as large as the raffle prize with which we
recruited subjects, and thus we consider that it is a strong incentive to increase
one’s performance. The five headlines and articles can be found in the Appendix.
6 Results
6.1 Descriptive Taste for Clickbait
Table 2 summarizes the characteristics of those who selected the different arti-
cles. It also confirms that the choice of article was not random. Pro Government
(Pro) articles were far more popular than Anti Government ones (Ag), which
reflects the fact that our sample includes many more Pro Government people.
Also striking is that the average age of those selecting Clickbait (CB ) articles is
much higher than those selecting Non Clickbait (NCB ) articles, consistent with
Hypothesis 1.4
Table 2: Descriptive statistics by chosen article
None CB-Pro CB-Ag NCB-Pro NCB-Ag Neutral All
Men 0.23 0.25 0.30 0.20 0.25 0.38 0.27
Age 39.03 45.34 42.06 34.66 35.64 35.89 38.49
Education 1.84 2.05 2.19 2.14 2.20 2.39 2.19
Like GVT 5.23 5.28 3.74 4.50 3.52 3.81 4.34
Internet 6.58 6.36 6.44 6.50 6.60 6.55 6.48
Facebook 5.52 5.91 5.83 5.40 5.48 5.66 5.65
Twitter 1.55 1.86 1.71 1.86 1.98 2.02 1.89
News Offline 3.55 3.74 3.56 3.13 3.50 3.51 3.47
News Online 6.10 5.77 5.81 5.53 5.77 5.92 5.75
Digital Literacy 0.85 0.82 0.84 0.88 0.89 0.91 0.87
n 31.00 365.00 145.00 405.00 168.00 383.00 1497.00
11Table 3: Effort under different treatments
Time spent choosing the article Time spent reading the chosen article
(1) (2) (3) (4) (5) (6)
Intrinsic Inc 0.054 0.054 −0.025∗∗ −0.023∗
(0.035) (0.035) (0.012) (0.012)
Monetary Inc 0.056∗ 0.061∗ 0.039∗∗∗ 0.040∗∗∗
(0.034) (0.035) (0.012) (0.012)
CB Score −0.011∗∗ −0.011∗∗ −0.006∗∗∗ −0.006∗∗∗
(0.005) (0.005) (0.002) (0.002)
Study −0.008 −0.009 0.003 0.003
(0.016) (0.016) (0.006) (0.006)
Age 0.011∗∗∗ 0.011∗∗∗ 0.001∗ 0.001∗∗
(0.001) (0.001) (0.0004) (0.0004)
Sex −0.085∗∗∗ −0.084∗∗∗ −0.033∗∗∗ −0.034∗∗∗
(0.032) (0.032) (0.011) (0.011)
Internet −0.070∗∗∗ −0.069∗∗∗ −0.019∗∗ −0.017∗∗
(0.024) (0.024) (0.009) (0.008)
Facebook −0.049∗∗∗ −0.048∗∗∗ −0.018∗∗∗ −0.018∗∗∗
(0.011) (0.011) (0.004) (0.004)
Twitter −0.028∗∗∗ −0.027∗∗∗ 0.0005 0.0001
(0.009) (0.009) (0.003) (0.003)
LIke GVT 0.002 0.002 −0.001 −0.001
(0.008) (0.008) (0.003) (0.003)
Often Online −0.019 −0.020∗ −0.009∗∗ −0.009∗∗
(0.012) (0.012) (0.004) (0.004)
Often Offline −0.023∗∗∗ −0.023∗∗∗ −0.008∗∗∗ −0.008∗∗∗
(0.008) (0.008) (0.003) (0.003)
Dig Literacy 0.271∗∗ 0.273∗∗ 0.123∗∗∗ 0.123∗∗∗
(0.127) (0.127) (0.045) (0.044)
Constant 4.063∗∗∗ 4.015∗∗∗ 3.599∗∗∗ 0.543∗∗∗ 0.528∗∗∗ 0.329∗∗∗
(0.187) (0.189) (0.025) (0.066) (0.066) (0.009)
Observations 1,410 1,410 1,497 1,383 1,383 1,466
R2 0.125 0.127 0.002 0.062 0.082 0.019
Adjusted R2 0.118 0.119 0.001 0.055 0.073 0.017
∗∗∗
p < 0.01, ∗∗ p < 0.05, ∗ p < 0.1.
OLS on the log of the time spent choosing and reading the article, as a proxy
of the effort undergone by users
Standard error in brackets
126.2 Manipulation check: time spent reading the article
We first provide a manipulation check by analyzing the time people spent choos-
ing and reading the article according to the different levels of incentive. 3 dis-
plays the log of the time spent choosing and reading the article as the dependent
variable and runs an OLS with the treatment dummies and the vector of con-
trols. As the articles differ slightly in length, we divide the time spent reading
by the number of words in the article, which does not alter our results.
We find that people spend significantly more time both choosing and reading
the article when given a Monetary Incentive. However, the Intrinsic Incentive
has a negative effect: people spent less time reading when they knew that there
was an unpaid quiz than when they did not know there would be a quiz.
6.3 Choice of Clickbait headlines
Table 4 depicts the main results. Each column represents the results of a Probit
model where the dependent variable is whether the subject selected a clickbait
article in the incentivized article task. Column 1 includes only demographic con-
trols, and displays only the variables that were related to pre-treatment taste
for clickbait and dummy variables for the two treatment conditions. Reassur-
ingly, the likelihood of selecting a clickbait headline is strongly predicted by this
CB Score. Even controlling for preference for clickbait, age and digital literacy
remain highly significant, although not education.
In the aggregate, there are no significant effects of either incentive on the
propensity to select clickbait in Column 1. The remaining columns in Table
4 demonstrate that this null main effect is masking offsetting heterogeneous
treatment effects for the Monetary Incentive, as predicted in Hypothesis 2. In
contrast, there are generally null effects for the Intrinsic Incentive.
Column 2 interacts the treatment conditions with the subjects’ age. There
are strongly heterogeneous effects for the Monetary Incentive, with the addi-
tional salience of accuracy increasing the likelihood that older people select
clickbait headlines. Figure 1 (top) plots this interaction as a third-order poly-
nomial, the least-complex model that matches our hypothesis. The slope is
steepest in the age ranges of 20 to 30 years old and 60 to 70 years old, while
there is little difference in the 30 to 60 year old range. Results are similar if we
bin the age variable.
4 We also allowed people to choose no article and skip this section. This decision aimed to
exclude people with no interest in politics from our experimental sample, as they would only
introduce noise in our results. 31 people decided to skip the section (and therefore the quiz).
13Table 4: Likelihood of choosing CB
(1) (2) (3) (4) (5)
∗∗
Intrinsic Inc 0.046 −0.053 −0.016 0.172 0.037
(0.034) (0.085) (0.068) (0.070) (0.147)
Monetary Inc 0.030 −0.190∗∗ −0.137∗∗ 0.190∗∗∗ −0.237∗
(0.034) (0.081) (0.067) (0.069) (0.135)
CB Score 0.040∗∗∗ 0.040∗∗∗ 0.041∗∗∗ 0.039∗∗∗ 0.041∗∗∗
(0.005) (0.005) (0.005) (0.005) (0.005)
Education −0.005 −0.006 −0.008 −0.035
(0.015) (0.016) (0.015) (0.042)
Age 0.004∗∗∗ 0.001 0.004∗∗∗ 0.004∗∗∗ 0.002
(0.001) (0.002) (0.001) (0.001) (0.002)
Dig Literacy −0.436∗∗∗ −0.439∗∗∗ −0.449∗∗∗
(0.126) (0.126) (0.128)
Intrinsic Inc*Age 0.003 0.001
(0.002) (0.002)
Monetary Inc*Age 0.006∗∗∗ 0.005∗∗
(0.002) (0.002)
Intrinsic Inc*Low Educ 0.197∗ 0.155
(0.101) (0.108)
Monetary Inc*Low Educ 0.364∗∗∗ 0.339∗∗∗
(0.081) (0.088)
Intrinsic Inc*Medium Educ 0.039 0.035
(0.083) (0.084)
Monetary Inc*Medium Educ 0.161∗ 0.177∗∗
(0.083) (0.084)
Intrinsic Inc*Medium Dig Lit −0.169∗∗ −0.128
(0.077) (0.084)
Monetary Inc*Medium Dig Lit −0.206∗∗∗ −0.127
(0.073) (0.083)
Intrinsic Inc*High Dig Lit −0.146∗ −0.089
(0.085) (0.099)
Monetary Inc*High Dig Lit −0.190∗∗ −0.059
(0.081) (0.101)
Num. obs. 1410 1410 1410 1410 1410
Log Likelihood −887.558 −883.547 −879.501 −883.532 −874.126
Deviance 1775.115 1767.093 1759.002 1767.063 1748.251
∗∗∗
p < 0.01, ∗∗ p < 0.05, ∗ p < 0.1.
Probit model on the Likelihood of choosing a CB articleeffects and standard
error in brackets
14Column 3 interacts the treatments with the subjects’ education, binned into
three levels (no high school diploma, high school diploma, some college or more).
Respondents with low or medium education were more likely to select clickbait
under the Monetary Incentive condition; those with low education were also
more likely to select clickbait under the Intrinsic Incentive condition. Figure 1
(middle) plots the estimated probabilities at each level of education.
Column 4 interacts the treatments with the subjects’ digital literacy, here
split at the 25th and 75th percentiles to produce three clusters. The effects are
consistent: respondents with medium or high levels of digital literacy were less
likely to select clickbait under either incentive. 1 (bottom) demonstrates that
there are people at the lowest end of the digital literacy spectrum who have
a markedly higher likelihood to select clickbait under the Monetary Incentive
condition.
Finally, Column 5 includes all three interaction terms. The interaction terms
between the Monetary Incentive and both age and education remain highly
significant, but the relationship with digital literacy disappears.
1516 Figure 1: Polynomial (of order 3) prediction of the probability of choosing clickbait from the Probit model. Interaction between treatment and Age (top), Digital Literacy (middle), and Education (bottom).
7    Conclusion
This paper takes seriously the role of perceived accuracy in media choice, inves-
tigating the source and the depth of the bond between mistrust for traditional
media and support for anti-establishment, populist politics.
    First, we find that the “clickbait style” associated with the anti-establishment
parties currently in government Italy is preferred by people who are older, less
educated and more likely to support the Italian populist government. This
provides face validity for our theory, and largely replicates results from the US.
    Our main result is achieved by manipulating the salience of accuracy in
respondents’ choice of media consumption. Some models of online media choice
suggest that people opt to consume low-credibility online media because of a
desire for congenial information; or because they aren’t taking the time to think
seriously about their choice; or because they’re being deceived because they lack
the digital literacy to evaluate source credibility online.
    However, we find that offering a monetary incentive for accuracy increases
the likelihood that certain respondents (older, less educated) will select a click-
bait headline. This result is not consistent with other models of media choice.
The partisan content of the choice task is held constant. Rather than rushing
through unreflectively, the monetary incentive causes responds to spend consid-
erably longer selecting an article. And digital literacy, in this case, appears to
be merely a proxy for age and education.
    Indeed, the only model that is consistent with our results is that the people
who prefer clickbait headlines do so because they think they are more accurate.
    These results suggest that the challenge facing the media and political es-
tablishments is more serious than some observers appreciate. The standard
journalistic style that is designed to signal high-credibility reporting has the
intended effect for the young and educated, but a sizable portion of the Italian
population—and the key constituency of the current governing coalition—makes
the opposite inference.
    This is a serious problem, one unlikely to be addressed by recent develop-
ments around attempts to signal article quality to readers. Indeed, publishing
fact-checking articles and emphasizing institutional credibility as the main dis-
tinction between good quality and bad quality information may paradoxically
serve to further alienate an already skeptical portion of the audience.

                                        17
References
Arceneaux, Kevin and Martin Johnson (2013). Changing minds or changing
channels?: Partisan news in an age of choice. University of Chicago Press.
Bordignon, Fabio and Luigi Ceccarini (2013). “Five stars and a cricket. Beppe
Grillo shakes Italian politics”. In: South European Society and Politics 18.4,
pp. 427–449.
Guess, Andrew (2016). “Media Choice and Moderation:Evidence from Online
Tracking Data”. In: Working Paper.
Guess, Andrew, Jonathan Nagler, and Joshua Tucker (2019). “Less than you
think: Prevalence and predictors of fake news dissemination on Facebook”.
In: Science advances 5.1, eaau4586.
Hargittai, Eszter (2001). “Second-level digital divide: mapping differences in
people’s online skills”. In: arXiv preprint cs/0109068.
— (2005). “Survey measures of web-oriented digital literacy”. In: Social science
computer review 23.3, pp. 371–379.
Hargittai, Eszter, Anne Marie Piper, and Meredith Ringel Morris (2018). “From
internet access to internet skills: digital inequality among older adults”. In:
Universal Access in the Information Society, pp. 1–10.
Messing, Solomon and Sean J Westwood (2012). “Selective exposure in the age of
social media: Endorsements trump partisan source affiliation when selecting
news online”. In: Communication Research, p. 0093650212466406.
Munger, Kevin (2019). “All the News That’s Fit to Click: The Economics of
Clickbait Media”. In: Political Communication, pp. 1–22.
Pennycook, Gordon and David G Rand (2019). “Lazy, not biased: Susceptibil-
ity to partisan fake news is better explained by lack of reasoning than by
motivated reasoning”. In: Cognition 188, pp. 39–50.
Prior, Markus (2007). Post-broadcast democracy: How media choice increases
inequality in political involvement and polarizes elections. Cambridge Uni-
versity Press.
Prior, Markus and Arthur Lupia (2008). “Money, time, and political knowl-
edge: Distinguishing quick recall and political learning skills”. In: American
Journal of Political Science 52.1, pp. 169–183.
Prior, Markus, Gaurav Sood, Kabir Khanna, et al. (2015). “You cannot be
serious: The impact of accuracy incentives on partisan bias in reports of eco-
nomic perceptions”. In: Quarterly Journal of Political Science 10.4, pp. 489–
518.
18Redmiles, Elissa M, Neha Chachra, and Brian Waismeyer (2018). “Examining
the Demand for Spam: Who Clicks?” In: Proceedings of the 2018 CHI Con-
ference on Human Factors in Computing Systems. ACM, p. 212.
Santoro, Giuliano (2012). Un Grillo qualunque: Il Movimento 5 Stelle e il pop-
ulismo digitale nella crisi dei partiti italiani. LIT EDIZIONI.
Settle, Jaime (2018). Frenemies: How Social Media Polarizes America. Cam-
bridge University Press.
Sood, Gaurav and Yphtach Lelkes (2018). “Don’t Expose Yourself: Discre-
tionary Exposure to Political Information”. In: Oxford Research Encyclo-
pedia of Politics.
19Table 5: Effort answering the quiz
Effort Answer
(1) (2)
Intrinsic Inc 0.013 0.032
(0.041) (0.035)
Monetary Inc 0.185∗∗∗ 0.126∗∗∗
(0.041) (0.035)
Effort Reading 0.482∗∗∗
(0.021)
Controls YES YES
Observations 1,410 1,383
R2 0.069 0.334
Adjusted R2 0.061 0.327
∗∗∗
p < 0.01, ∗∗ p < 0.05, ∗ p < 0.1.
OLS on the log of the time spent answering the quiz, as a proxy for effort.
Standard error in brackets
208 Appendix
Figure 2: Recruitment Instrument for Facebook Sample
8.1 Pre-treatment articles
8.1.1 Batch 1, ITA
• CB Pro Il PD è furioso! Ecco cosa non vogliono farti sapere sull’Air
Force Renzi.
• CB Against Basta chiacchiere! Tutte le menzogne sull’aereo di Stato
• Non-CB Pro Il costo dei voli di Stato aumentato durante gli ultimi 5
anni
• Non-CB Against Un aereo di servizio è necessario per i voli ufficiali e
fa risparmiare soldi
• Neutral Quanto costano i voli di Stato
218.1.2 Batch 1, ENG
• CB Pro The democrats are furious! Here’s what they do not want you
to know about the Air Force Renzi.
• CB Against Stop the fake-news! All the lies on the State Aircraft
• Non-CB Pro The cost of the State Aircraft rose during the last 5 years
• Non-CB Against A State Aircraft is useful and it actually saves us
money
• Neutral The cost of the State Aircraft
8.1.3 Batch 2, ITA
• CB Pro “Abbiamo paura ad uscire di casa”, ecco quello che la sinistra
non vuole farvi sapere
• CB Against La propaganda leghista vi sta mentendo! Ecco la verità
sulla sicurezza in Italia
• Non-CB Pro 2013-2017, in aumento la criminalità in tutta Italia
• Non-CB Against Nonostante un piccolo aumento, la criminalità in Italia
resta ai minimi storici
• Neutral Tutto quello che c’è da sapere sulla criminalità in Italia
8.1.4 Batch 2, ENG
• CB Pro “We’re afraid to get out”, here’s what the democrats do not want
you to know
• CB Against The League’s propaganda is lying to you! Here’s the truth
about safety in Italy
• Non-CB Pro 2013-2017, crime is on the rise throughout the country
• Non-CB Against Despite a small increase, crime is still at the historical
low
• Neutral Everything you need to know about crime in Italy
228.2 Treatment articles: Endogenous choice - Italian
8.2.1 Neutral
Le cifre sulla riforma delle spese della Camera
L’ufficio di presidenza della Camera ha approvato la delibera proposta dal
presidente Roberto Fico che prevede il ricalcolo dei vitalizi degli ex deputati. Il
ricalcolo porterà a una riduzione dei vitalizi tramite un meccanismo chiamato
“ricalcolo contributivo”. Significa che i vitalizi concessi in passato e il cui am-
montare era stato calcolato con il metodo retributivo saranno ricalcolati con il
metodo contributivo, che prevede che l’assegno pensionistico sia proporzionato
ai contributi effettivamente versati durante il mandato parlamentare. Il nuovo
sistema entrerà in vigore dal prossimo primo novembre e dovrebbe portare a 42
milioni di euro di risparmi all’anno.
A percepire il vitalizio sono oggi circa 2.600 ex parlamentari tra Camera e
Senato, per una cifra che nel 2017 ha raggiunto i 206 milioni di euro. Cala
l’assegno di tutti quelli che sono stati in Parlamento in passato e sono in età
da pensione. Ciononostante, il budget complessivo della Camera salirà di 18,8
milioni di euro, raggiungendo 969,2 milioni.
8.2.2 Clickbait Pro
I vecchi partiti sono furiosi! Guardate cosa è successo ai vitalizi!
Buon inizio per il Governo del Cambiamento! L’ufficio di presidenza della
Camera ha approvato la delibera proposta dal presidente Roberto Fico che
prevede il ricalcolo dei vitalizi degli ex deputati. Il ricalcolo porterà a una
riduzione dei vitalizi tramite un meccanismo chiamato “ricalcolo contributivo”.
Significa che i vitalizi concessi in passato e il cui ammontare era stato calco-
lato con il metodo retributivo saranno ricalcolati con il metodo contributivo,
che prevede che l’assegno pensionistico sia proporzionato ai contributi effetti-
vamente versati durante il mandato parlamentare. Il nuovo sistema entrerà in
vigore dal prossimo primo novembre e porterà ad addirittura 42 milioni di euro
di risparmi all’anno. Finalmente un po’ di pulizia tra i privilegi dei soliti noti.
A percepire il vitalizio sono oggi circa 2.600 ex parlamentari tra Camera
e Senato, per una cifra esorbitante che nel 2017 ha raggiunto i 206 milioni di
euro. Cala l’assegno di tutti quelli che sono stati in Parlamento in passato e
sono in età da pensione. Malgrado gli sforzi, il budget complessivo della Camera
23salirà di 18,8 milioni di euro, raggiungendo 969,2 milioni. In soli tre mesi, sono
cambiate più cose che negli ultimi 10 anni! Avanti tutta!
8.2.3 Non Clickbait Pro
Diminuisce la spesa pubblica grazie ai tagli alle istituzioni
L’ufficio di presidenza della Camera ha approvato la delibera proposta dal
presidente Roberto Fico che prevede il ricalcolo dei vitalizi degli ex deputati. Il
ricalcolo porterà a una riduzione dei vitalizi tramite un meccanismo chiamato
“ricalcolo contributivo”. Significa che i vitalizi concessi in passato e il cui am-
montare era stato calcolato con il metodo retributivo saranno ricalcolati con il
metodo contributivo, che prevede che l’assegno pensionistico sia proporzionato
ai contributi effettivamente versati durante il mandato parlamentare. Il nuovo
sistema entrerà in vigore dal prossimo primo novembre e porterà ad addirittura
42 milioni di euro di risparmi all’anno.
A percepire il vitalizio sono oggi circa 2.600 ex parlamentari tra Camera e
Senato, per una cifra esorbitante che nel 2017 ha raggiunto i 206 milioni di euro.
Cala l’assegno di tutti quelli che sono stati in Parlamento in passato e sono in
età da pensione. Malgrado gli sforzi, il budget complessivo della Camera salirà
di 18,8 milioni di euro, raggiungendo 969,2 milioni.
8.2.4 Clickbait Against
Non ditelo ai grillini! Nonostante le promesse, poco è cambiato nella spesa dello
Stato
Tanto rumore per nulla. Dopo anni a parlare di vitalizi, l’ufficio di presi-
denza della Camera ha approvato la delibera proposta dal presidente Roberto
Fico che prevede semplicemente il ricalcolo dei vitalizi degli ex deputati. Il
ricalcolo porterà a una riduzione dei vitalizi tramite un meccanismo chiamato
“ricalcolo contributivo”. Significa che i vitalizi concessi in passato e il cui am-
montare era stato calcolato con il metodo retributivo saranno ricalcolati con il
metodo contributivo, che prevede che l’assegno pensionistico sia proporzionato
ai contributi effettivamente versati durante il mandato parlamentare. Il nuovo
sistema entrerà in vigore dal prossimo primo novembre e porterà ad un ma-
gro risparmio di 42 milioni di euro all’anno. Una bazzecola rispetto alle spese
esorbitanti della Camera.
A percepire il vitalizio sono oggi circa 2.600 ex parlamentari tra Camera e
24Senato, per una cifra che nel 2017 di soli i 206 milioni di euro. Cala l’assegno di
tutti quelli che sono stati in Parlamento in passato e sono in età da pensione.
Come previsto, il budget complessivo della Camera salirà addirittura di 18,8
milioni di euro, raggiungendo 969,2 milioni. Come sempre, dopo tanti proclami,
nulla è cambiato.
8.2.5 Non Clickbait Against
L’impatto dei tagli alle spese della Camera si rivela quasi inesistente
L’ufficio di presidenza della Camera ha approvato la delibera proposta dal
presidente Roberto Fico che prevede semplicemente il ricalcolo dei vitalizi degli
ex deputati. Il ricalcolo porterà a una riduzione dei vitalizi tramite un mec-
canismo chiamato “ricalcolo contributivo”. Significa che i vitalizi concessi in
passato e il cui ammontare era stato calcolato con il metodo retributivo saranno
ricalcolati con il metodo contributivo, che prevede che l’assegno pensionistico
sia proporzionato ai contributi effettivamente versati durante il mandato par-
lamentare. Il nuovo sistema entrerà in vigore dal prossimo primo novembre e
porterà ad un magro risparmio di 42 milioni di euro all’anno.
A percepire il vitalizio sono oggi circa 2.600 ex parlamentari tra Camera e
Senato, per una cifra che nel 2017 di soli i 206 milioni di euro. Cala l’assegno di
tutti quelli che sono stati in Parlamento in passato e sono in età da pensione.
Come previsto, il budget complessivo della Camera salirà addirittura di 18,8
milioni di euro, raggiungendo 969,2 milioni.
8.3 Treatment articles: Endogenous choice - English
8.3.1 Neutral
The numbers of the spending cuts of the House
The House just approved the measure proposed by its Speaker Roberto Fico
to revise the retirement benefits of former MPs. This reform will reduce the
expenditure through the “contributive scheme”. This means that past bene-
fits whose amount had been calculated with the retributive method will not
be calculated with the contributive method, which implies that the benefit is
proportional to the retirement taxes actually paid by the MP. This new system
will be effective starting next November and it should bring to a saving of 42
million Euro.
25Now around 2600 former MPs of the House and Senate receive retirement
benefits, for an overall expenditure of 206 millions Euro per year. All those
who have been in the Parliament and are now about to retire will receive less.
Nevertheless, the overall budget of the House will increase of 18,8 millions,
reaching 969.2 millions.
8.3.2 Clickbait Pro
Old parties are furious! Here’s what happened to pensions!
Great start for the Government of Change! The House just approved the
measure proposed by its Speaker Roberto Fico to revise the retirement benefits
of former MPs. This reform will reduce the expenditure through the “contribu-
tive scheme”. This means that past benefits whose amount had been calculated
with the retributive method will not be calculated with the contributive method,
which implies that the benefit is proportional to the retirement taxes actually
paid by the MP. This new system will be effective starting next November and
it should bring to a saving of 42 million Euro. Finally, a cut to the privileges of
the élite.
Now around 2600 former MPs of the House and Senate receive retirement
benefits, for an overall record expenditure of 206 millions Euro per year. All
those who have been in the Parliament and are now about to retire will receive
less. Nevertheless, despite the efforts, the overall budget of the House will
increase of 18,8 millions, reaching 969.2 millions. In just 3 months, we changed
more things that (the other governments) in the last 10 years! Let’s keep going!
8.3.3 Non Clickbait Pro
The spending decreases thanks to the cuts on pensions
The House just approved the measure proposed by its Speaker Roberto Fico
to revise the retirement benefits of former MPs. This reform will reduce the
expenditure through the “contributive scheme”. This means that past bene-
fits whose amount had been calculated with the retributive method will not
be calculated with the contributive method, which implies that the benefit is
proportional to the retirement taxes actually paid by the MP. This new system
will be effective starting next November and it should bring to a saving of 42
million Euro.
Now around 2600 former MPs of the House and Senate receive retirement
26benefits, for an overall record expenditure of 206 millions Euro per year. All
those who have been in the Parliament and are now about to retire will receive
less. Nevertheless, despite the efforts, the overall budget of the House will
increase of 18,8 millions, reaching 969.2 millions.
8.3.4 Clickbait Against
Don’t tell Beppe Grillo! Despite the promises, nothing has changed in the House
spending
Much ado about nothing. After years talking about retirement benefits,
the House just approved the measure proposed by its Speaker Roberto Fico
to just revise slightly the retirement benefits of former MPs. This reform will
reduce the expenditure through the “contributive scheme”. This means that
past benefits whose amount had been calculated with the retributive method
will not be calculated with the contributive method, which implies that the
benefit is proportional to the retirement taxes actually paid by the MP. This
new system will be effective starting next November and it should bring to a
saving of just 42 million Euro. An insignificant amount with respect to the
overall expenditure.
Now around 2600 former MPs of the House and Senate receive retirement
benefits, for an overall expenditure of just 206 millions Euro per year. All
those who have been in the Parliament and are now about to retire will receive
less. Nevertheless, the overall budget of the House will increase of 18,8 millions,
reaching 969.2 millions. As usual, we had a lot of talking and nothing changed.
8.3.5 Non Clickbait Against
The impact of the new House cuts is almost inexistent
Speaker Roberto Fico to just revise slightly the retirement benefits of for-
mer MPs. This reform will reduce the expenditure through the “contributive
scheme”. This means that past benefits whose amount had been calculated with
the retributive method will not be calculated with the contributive method,
which implies that the benefit is proportional to the retirement taxes actually
paid by the MP. This new system will be effective starting next November and
it should bring to a saving of just 42 million Euro.
Now around 2600 former MPs of the House and Senate receive retirement
benefits, for an overall expenditure of just 206 millions Euro per year. All
27those who have been in the Parliament and are now about to retire will receive
less. Nevertheless, the overall budget of the House will increase of 18,8 millions,
reaching 969.2 millions.
28Table 6: Effort under different treatments
Effort reading Effort answering
(1) (2) (3) (4) (5) (6)
Intrinsic Inc −0.004 −0.007 0.005 −0.001
(0.012) (0.014) (0.016) (0.017)
Monetary Inc −0.005 0.012 0.017 0.032∗
(0.012) (0.013) (0.016) (0.017)
CB Score −0.006∗∗∗ −0.006∗∗∗ −0.004∗∗ −0.004∗∗
(0.002) (0.002) (0.002) (0.002)
Education 0.008 0.008 −0.005 −0.005
(0.005) (0.005) (0.007) (0.007)
Age 0.0003 0.0003 0.002∗∗∗ 0.002∗∗∗
(0.0004) (0.0004) (0.0005) (0.0005)
Sex −0.004 −0.004 0.010 0.010
(0.011) (0.011) (0.015) (0.015)
Internet 0.003 0.003 −0.019∗ −0.019∗
(0.008) (0.008) (0.011) (0.011)
Facebook −0.003 −0.003 −0.001 −0.001
(0.004) (0.004) (0.005) (0.005)
Twitter −0.004 −0.004 −0.003 −0.003
(0.003) (0.003) (0.004) (0.004)
LIke GVT 0.003 0.003 0.001 0.001
(0.003) (0.003) (0.004) (0.004)
Often Online −0.009∗∗ −0.009∗∗ −0.002 −0.002
(0.004) (0.004) (0.006) (0.006)
Often Offline −0.003 −0.003 −0.003 −0.003
(0.003) (0.003) (0.004) (0.004)
Dig Literacy 0.034 0.034 0.017 0.018
(0.044) (0.044) (0.059) (0.059)
Effort Chosen 0.154∗∗∗ 0.155∗∗∗ 0.147∗∗∗ 0.146∗∗∗
(0.007) (0.007) (0.009) (0.009)
Constant −0.270∗∗∗ −0.266∗∗∗ 0.318∗∗∗ 0.084 0.078 0.559∗∗∗
(0.072) (0.072) (0.010) (0.096) (0.096) (0.012)
Observations 1,412 1,412 1,537 1,412 1,412 1,537
R2 0.310 0.310 0.001 0.189 0.190 0.003
Adjusted R2 0.304 0.303 0.00002 0.182 0.182 0.002
Note: ∗ pTable 7: Effort under different treatments
Effort reading
(1) (2)
Pro News 0.012 0.021
(0.013) (0.021)
Pro Reader 0.021 0.029
(0.015) (0.019)
Pro News*Pro Reader −0.016
(0.026)
Constant −0.259∗∗ −0.262∗∗∗
(0.101) (0.101)
Controls YES YES
Observations 871 871
R2 0.270 0.270
Adjusted R2 0.259 0.258
∗ ∗∗ ∗∗∗
Note: pYou can also read