The Lipid and Glyceride Profiles of Infant Formula Differ by Manufacturer, Region and Date Sold - MDPI
←
→
Page content transcription
If your browser does not render page correctly, please read the page content below
nutrients
Article
The Lipid and Glyceride Profiles of Infant Formula
Differ by Manufacturer, Region and Date Sold
Samuel Furse *        and Albert Koulman *
 Core Metabolomics and Lipidomics Laboratory, Wellcome Trust-MRL Institute of Metabolic Science,
 University of Cambridge, Level 4 Addenbrooke’s Treatment Centre, Keith Day Road, Cambridge CB2 0QQ, UK
 * Correspondence: sf615@cam.ac.uk or samuel@samuelfurse.com (S.F.); ak675@medschl.cam.ac.uk (A.K.);
   Tel.: +0044-1223-769067 (S.F.); +0044-1223-764948 (A.K.)

 Received: 29 April 2019; Accepted: 16 May 2019; Published: 20 May 2019

 Abstract: We tested the hypothesis that the lipid composition of infant formula is consistent between
 manufacturers, countries and target demographic. We developed techniques to profile the lipid and
 glyceride fraction of milk and formula in a high throughput fashion. Formula from principal brands
 in the UK (2017–2019; bovine-, caprine-, soya-based), the Netherlands (2018; bovine-based) and South
 Africa (2018; bovine-based) were profiled along with fresh British animal and soya milk and skimmed
 milk powder. We found that the lipid and glyceride composition of infant formula differed by region,
 manufacturer and date of manufacture. The formulations within some brands, aimed at different
 target age ranges, differed considerably where others were similar across the range. Soya lecithin and
 milk lipids had characteristic phospholipid profiles. Particular sources of fat, such as coconut oil,
 were also easy to distinguish. Docosahexaenoic acid is typically found in triglycerides rather than
 phospholipids in formula. The variety by region, manufacturer, date of manufacture and sub-type
 for target demographics lead to an array of lipid profiles in formula. This makes it impossible to
 predict its molecular profile. Without detailed profile of the formula fed to infants, it is difficult to
 characterise the relationship between infant nutrition and their growth and development.

 Keywords: Lipidomics; infant nutrition; infant development; lipid metabolism

1. Introduction
     There is a mounting body of evidence that the dietary intake of infants has an important role in
shaping their lipid metabolism [1–3] at a molecular level [4–6]. Specifically, there is evidence that the
lipid profile in the circulation of formula-fed infants differs considerably to that of breastfed infants
by three months of age [6–8]. This is consistent with evidence that the milk consumed is associated
with the lipid profile in infants [9–12], children [13] and adults [14–16]; as well as with data from a
non-human primate that the metabolism of fats and cholesterol is associated with diet after birth [17,18].
     This evidence supports the theory of nutritional programming of infants. As self-reporting of
mothers across a number of studies indicates that the majority of infants born in the West receive
formula (either alone or with breastmilk) [19,20], an understanding of the composition of infant
formula is required for investigating the growth and nutritional programming of infants. Despite
the wide availability of formula and strict regulations, there is relatively little information beyond
the concentrations reported on the package, which only cover macro- and micro-nutrients. A small
number of clear and focused studies have profiled formula from particular regions [21–23] and even
used them in metabolic studies [24,25]. However, most of the studies that focus on the relationship
between nutrition and development may only record volume, brand name or type. It is currently
unclear whether we can compare infants being fed the same brand or same type, without detailed

Nutrients 2019, 11, 1122; doi:10.3390/nu11051122                             www.mdpi.com/journal/nutrients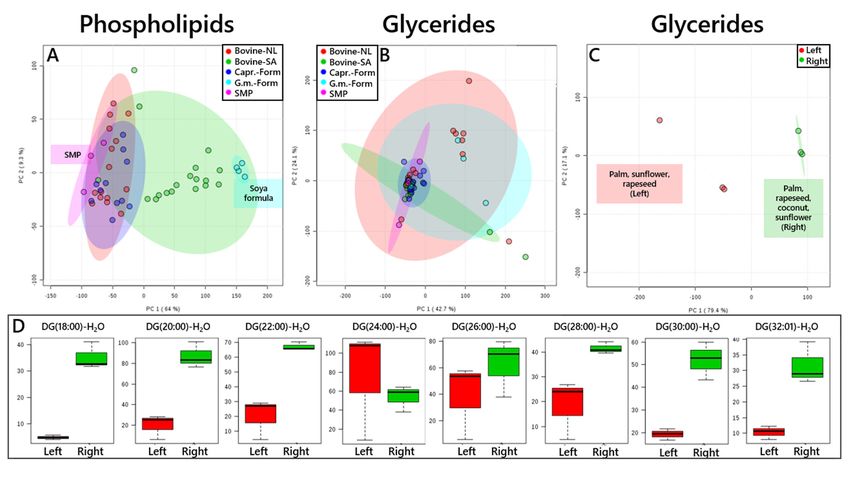
Nutrients 2019, 11, 1122                                                                          2 of 13

information on the molecular composition of the formula. This led us to the hypothesis that the lipid
composition of formula is consistent between manufacturers, countries or by target demographic.
     We therefore embarked upon a detailed survey of commercially available infant formulae in order
to uncover the variety between them. A novel high-throughput method for isolating the lipid fraction
and a novel three-part method for nanospray-based Direct Infusion Mass Spectrometry (DI-MS) were
developed to solve the particular problems of profiling milk in a high throughput manner. The data
generated provides evidence of our ability to study the effect of formula in birth cohort studies on
growth and development.

2. Materials and Methods
      Reagents—Solvents were purchased from Sigma-Aldrich Ltd. (Dorset, UK) of at least HPLC grade
and were not purified further. Lipid standards were purchased from Avanti Polar lipids (Alabaster, AL;
via Instruchemie, Delfzijl, NL) and used without purification. Consumables were purchased from
Sarstedt AG & Co. (Leicester, UK) or Wolf Labs (Wolverhampton, UK).
      Ethics—This study is intended as an investigation of the lipid and glyceride profile of infant
formulae that are commercially available, in order to inform studies of infant metabolism. It is not
intended as a critical examination of manufacturer’s methods, choice of ingredients, differences between
manufacturing sites etc, or to inform a policy-based comparison with human or other milk. To this end,
we have blinded the names of manufacturers, brands and target demographics of products referred to
in the main text. However, the identity of these is available in the Supplementary Information in order
to facilitate comparison between studies.
      Sample acquisition and preparation—Formula and fresh milks were purchased from British
Supermarkets (J Sainsbury plc, UK; Ocado Retail Ltd., UK) between November 2017 and January 2019.
Test samples of Dutch formula were purchased direct through Albert Heijn (NL) and Dirk van den
Broek (NL) in November 2017, a full sample set was purchased through Drogist.nl in Spring 2018.
South African formula was purchased through Dis-Chem.co.za and shipped to the UK under an import
licence (DEFRA, 2018). All formula was stored at −20 ◦ C. Samples were prepared by dispersing formula
(100 mg) into water (ddH2 O, 1 mL) and freeze-thawed once before extraction of the lipid fraction.
      New method: Extraction of the lipid fraction—We designed experimental procedures that facilitated
the profiling of both the phospholipid (PL) and glyceride (triglyceride and diglyceride, TG/DG)
fractions in a high throughput manner. This is challenging in milk samples as triglycerides typically
dominate (>98%) and have distinct physico-chemical properties to the minor phospholipid component.
We therefore developed an existing isolation method for high throughput (384w plate) profiling. The
original method was designed for the isolation of both anionic and zwitterionic phospholipids [26,27],
to reduce chemical damage during handling [28] and be suitable for isolation of a variety of uncharged
lipid species [27] and used here for the same reasons.
      Lipid extraction—The method used for extracting the lipid fraction was developed from larger-scale
methods [26,27] that were designed to better fit the current understanding of lipid chemistry [28]
and adapted for high throughput lipid surveys. The solution of formula (40 uL, prepared as above)
was injected into a well (96w plate, Esslab Plate+™ (Chromacol, USA), 2·4 mL/well, glass-coated)
followed by internal standards (150 µL, Mixture of Internal Standards in methanol (See Supplemental
File, Table S1), water (500 µL) and DMT (500 µL, Dichloromethane, methanol and triethylammonium
chloride, 3:1:0·005). The mixture was agitated (96 channel pipette) before being centrifuged (3·2× g,
2 min). A portion of the organic solution (20 µL) was transferred to a high throughput plate (384w,
glass-coated, Esslab Plate+™) before being dried (N2 (g) ). A second portion of the extract (80 µL) was
transferred to a shallow plate (96w, glass-coated) before being dried (N2 (g) ), washed (hexane, 2 ×
80 µL/well) and re-dissolved (DMT, 30 µL). The samples were transferred immediately to the high
throughput plate and dried (N2 (g) ). The dried films were re-dissolved (TBME, 30 µL/well) and diluted
with a stock mixture of alcohols and ammonium acetate (100 µL/well; propan-2-ol: methanol, 2:1;
CH3 COO.NH4 7·5 mM). The analytical plate was heat-sealed and run immediately.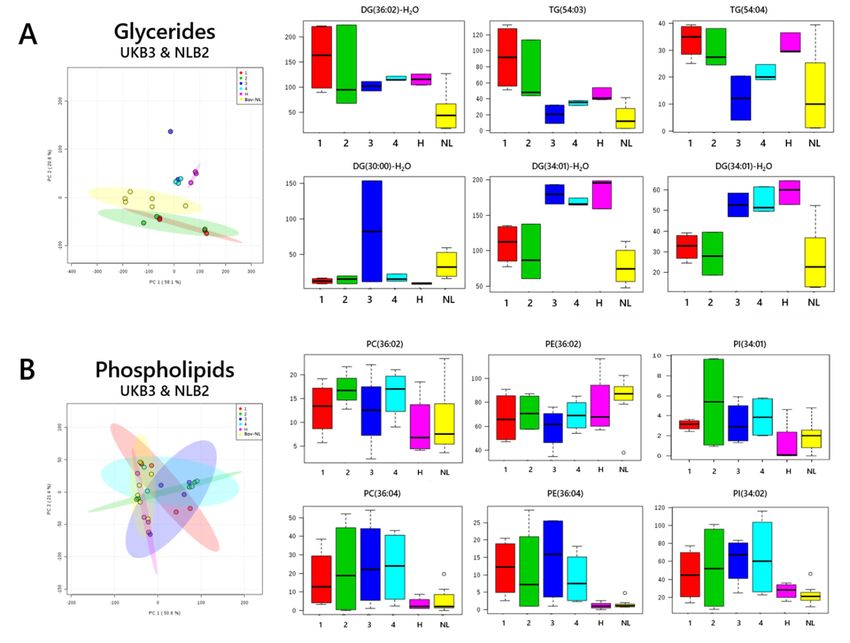
Nutrients 2019, 11, 1122                                                                                3 of 13

     Novel method: Three-part DI-MS for profiling glycerides, phospholipids and fatty acids separately—In order
to overcome the inherent difficulties of profiling the lipid/glyceride fraction of milk samples, we
developed DI-MS (used successfully a number of times on human dried blood spots [5–8], plasma [4,29]
and serum [30]) for milk. The abundance of glycerides (98% of signal intensity in positive mode,
Figure S1) led us to the hypothesis that they were suppressing the PLs. As triglycerides ionise much
less well in negative mode, we explored this mode for profiling phospholipids (Figure S2). This
produced evidence for an array of such species, including all major phospholipids. However, we noted
that the spectrum contained a considerable number of intensities for triglycerides. Washing the dried
lipid film briefly with hexane reduced the signal intensity of triglycerides, increased the number of m/z
signals consistent with phospholipids by around a factor of two and narrowed the variance within
phospholipids. Hexane was chosen as although fats readily dissolve in it, its low dielectric constant
makes it a poor solvent for lipids. The glyceride profile of the residue was the same as the whole
sample and thus this washing step does not appear to be selective between isoforms of triglyceride
(Figure S3). We tested for reported lipase activity [31–33] in fresh milk using this method. However,
the glyceride spectra were dominated by signals of diglycerides that had lost one equivalent of water
(DG-H2 O). These signals consist of both di- and triglycerides that have fragmented under ionisation
conditions [4], confounding measurement of the abundance of DGs.
     Data collection & handling—The DI-MS method used in this study was based on an existing
method [30] that measured in both positive and negative ion modes. We added a third section, in
which collision-induced dissociation was used in a second negative mode. This additional section
focuses on the fatty acid profile of the phospholipid fraction as triglycerides do not ionise well in
negative mode and most of them are washed away (hexane wash, Figure S4). Quality control (QC)
samples consisted of three formulae (soya-, caprine-, bovine-based, 1:1:1) dispersed in Jersey milk
(150 mg/mL) and freeze-thawed once before use.
     Positive mode processing used a deviations threshold of 10 ppm and a signal strength threshold of
2. Abundance/Signal intensity was plotted using 25, 50, 100% QC samples and a correlation threshold
of 0·75 was used for both whole and petrol-washed samples. Variables with 0% values across all
samples were removed before the intensities were signal-corrected. Finally, values more than 4 standard
deviations from the average for each variable were considered outliers and discarded. Negative mode
processing used a deviations threshold of 10 ppm. QC samples and a correlation threshold of 0·80 was
used for both whole and petrol-washed samples. Processing of the negative mode with CID: deviations
threshold of 12·5 ppm on a list of fatty acids of chain length 14 to 36 with up to six olefin bonds and/or
one hydroxyl group. All signals stronger than noise were carried forward.
     Statistical Tests—Univariate statistical tests were carried out using Microsoft Excel 2013 and
Principal Component Analyses (PCAs) carried out using Metaboanalyst 4.0 [34]. PCAs were used
to identify which samples grouped together in a data-driven manner (e.g., Figure 1). Investigation
of the secondary hypothesis that the phospholipid profile comprised soya and/or milk lipids (e.g.,
Figure 2) used skimmed milk powder and soya milk as comparison samples. Skimmed milk powder is
less perishable than fresh animal milk and varies little by season. It therefore represents cows’ milk
lipids reliably.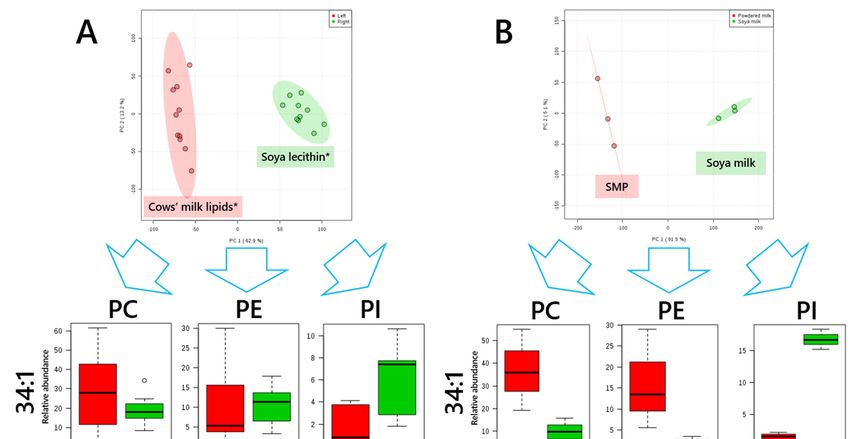
September 2018 and January 2019) and type (age of infant: 0-6 mo, 6-12 mo, 12-24 mo, 24-36 mo). A
full set of PCAs is shown in Figure S5.
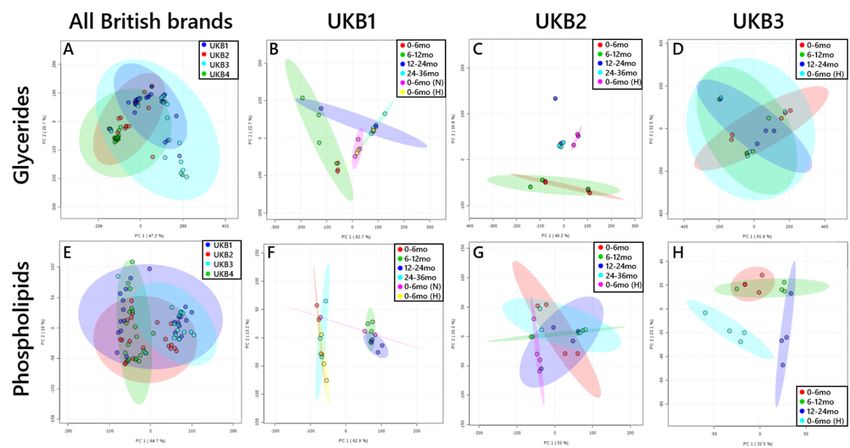
These results provided evidence for distinction between brands in glyceride profile (Figure 1A),
borne out by the evidence of subgrouping by type in the glyceride plots of UKB1 (Figure 1B) and
UKB2 (Figure 1C). UKB3 (Figure 1D) and UKB4 (not shown) did not show subgrouping. The
preparations
Nutrients we investigated comprise combinations of palm oil, sunflower oil, rapeseed oil, coconut 4 of 13
2019, 11, 1122
oil, soya oil, single cell oil, fish oil and oil from Mortierella alpina.
FigureFigure. 1. Principal component analyses (PCAs) of infant formulae sold in the UK (2017-2019). Panels
1. Principal component analyses (PCAs) of infant formulae sold in the UK (2017–2019). Panels
(A–D), triglycerides and diglycerides: (A), All brands; (B), British brand 1 (UKB1); British brand 2
(A–D), triglycerides and diglycerides: (A), All brands; (B), British brand 1 (UKB1); British brand 2
(UKB2); British brand (UKB3). Panels E-H, phospholipids: (E), All brands; (F), British brand 1 (UKB1);
(UKB2); British brand (UKB3). Panels E-H, phospholipids: (E), All brands; (F), British brand 1 (UKB1);
(G), British brand 2 (UKB2); (H), British brand (UKB3). R2 values for each component are shown in
(G), British brandon2each(UKB2); (H), BritishN,brand 2
parentheses axis. H, ‘hungry’; ‘night’.(UKB3). R values for each component are shown in
parentheses
Nutrients 2019,on
11,each
x FORaxis.
PEER H, ‘hungry’; N, ‘night’.
REVIEW 5 of 13
There was also evidence for subgrouping by phospholipid composition, with two denser areas
in the overall plot (Figure 1E). This distinction is also evident within brands, e.g. UKB1 (Figure 1F)
and UKB3 (Figure 1H), suggesting that the composition of products differs between subtypes (target
demographic age-range of infant) and date of manufacture. The ingredients listed on the packaging
suggested that this distinction may be due to the presence of soya lecithin. PCAs were used to identify
the variables that were the most important for distinguishing the two groups in one brand of formula
(UKB1, Figure 2A) and which variables best distinguished the lipid composition of skimmed milk
powder against soya milk, Figure 2B. Skimmed milk powder and soya milk preparations were used
for this comparison as the former contains only milk lipids, where the latter contains no bovine
material. The (unsupervised) multivariate analysis (MVA) showed that the same variables were the
most important in distinguishing both the different groups of formulae and also cows’ and soya milk
(Figure 2B). We used this approach to characterise formula from other regions and from a non-bovine
source.
2. Principal
FigureFigure Component
2. Principal ComponentAnalyses
Analyses and importantloading
and important loading variables
variables of phospholipid
of the the phospholipid
composition
composition of formula
of formula UKB1UKB1 andreference
and reference materials.
materials. Panel
Panel(A),(A),
British brand
British 1 (UKB1)
brand with with
1 (UKB1)
subgroups that represent the hypothesised (*) dominant lipid source hypothesised
subgroups that represent the hypothesised (*) dominant lipid source hypothesised marked (Red, cows’ marked (Red,
cows’ milk lipids; Green, soya lecithin). (B), Plot of lipids from skimmed milk powder (SMP) and soya
milk lipids; Green, soya lecithin). (B), Plot of lipids from skimmed milk powder (SMP) and soya milk
milk with loadings indicating which variables are the most important for distinguishing the two
with loadings indicating which variables are the most important for distinguishing the two 2sample
sample types. PC, phosphatidylcholine; PE, phosphatidylethanolamine; PI, phosphatidylinositol. R
types. values
PC, phosphatidylcholine; 2
for each component are PE, phosphatidylethanolamine;
shown in parentheses on each axis. PI, phosphatidylinositol. R values
for each component are shown in parentheses on each axis.
An unsupervised MVA of the lipid profile of Dutch and South African infant formula based on
bovine material and British formula based on caprine material, along with references of skimmed
cows’ milk powder and soya-based formula, is shown in Figure 3A. This indicated that the lipid
profile of British caprine-based formula differed little from the lipid profile of (cows’) skimmed milk
powder, or Dutch infant formula based on cow’s milk. Soya-based formula was appreciably different
from skimmed milk powder, indicated by it clustering in PC1, where skimmed milk powder was
Nutrients 2019, 11, 1122                                                                          5 of 13

3. Results
      We began by investigating the variety within the considerable array of infant formula available in
the UK. We therefore profiled both the phospholipid and glyceride fractions of infant formulae sold in
British supermarkets, 2017-19.
      The majority of products available were preparations made from bovine material (typically
skimmed cows’ milk), across both ready-made liquid preparations and the larger packages (900 g)
used by parents every day. As the latter are expected to provide the bulk of formula-fed infants’
intake, these were investigated in the present study. The lipid signals acquired through positive
mode (glycerides, untreated), negative mode (phospholipids, washed with hexane) and fatty acid
profile were compared using an unsupervised multi-variate test (Principal Component Analysis, PCA).
Samples were compared by brand (British brands 1-4, UKB1-4), date sold (November 2017, June 2018,
September 2018 and January 2019) and type (age of infant: 0–6 mo, 6–12 mo, 12–24 mo, 24–36 mo). A
full set of PCAs is shown in Figure S5.
      These results provided evidence for distinction between brands in glyceride profile (Figure 1A),
borne out by the evidence of subgrouping by type in the glyceride plots of UKB1 (Figure 1B) and UKB2
(Figure 1C). UKB3 (Figure 1D) and UKB4 (not shown) did not show subgrouping. The preparations
we investigated comprise combinations of palm oil, sunflower oil, rapeseed oil, coconut oil, soya oil,
single cell oil, fish oil and oil from Mortierella alpina.
      There was also evidence for subgrouping by phospholipid composition, with two denser areas
in the overall plot (Figure 1E). This distinction is also evident within brands, e.g., UKB1 (Figure 1F)
and UKB3 (Figure 1H), suggesting that the composition of products differs between subtypes (target
demographic age-range of infant) and date of manufacture. The ingredients listed on the packaging
suggested that this distinction may be due to the presence of soya lecithin. PCAs were used to identify
the variables that were the most important for distinguishing the two groups in one brand of formula
(UKB1, Figure 2A) and which variables best distinguished the lipid composition of skimmed milk
powder against soya milk, Figure 2B. Skimmed milk powder and soya milk preparations were used
for this comparison as the former contains only milk lipids, where the latter contains no bovine
material. The (unsupervised) multivariate analysis (MVA) showed that the same variables were the
most important in distinguishing both the different groups of formulae and also cows’ and soya
milk (Figure 2B). We used this approach to characterise formula from other regions and from a
non-bovine source.
      An unsupervised MVA of the lipid profile of Dutch and South African infant formula based on
bovine material and British formula based on caprine material, along with references of skimmed cows’
milk powder and soya-based formula, is shown in Figure 3A. This indicated that the lipid profile of
British caprine-based formula differed little from the lipid profile of (cows’) skimmed milk powder,
or Dutch infant formula based on cow’s milk. Soya-based formula was appreciably different from
skimmed milk powder, indicated by it clustering in PC1, where skimmed milk powder was centred
on the opposite side in PC1 (Figure 3A). South African infant formula was scattered between these
two points, with around two thirds of these formulae closer to the soya-based formula than skimmed
milk powder.
Nutrients 2019, 11, 1122 6 of 13
Nutrients 2019, 11, x FOR PEER REVIEW 6 of 13
Figure 3. PCAs of bovine-based infant formula sold in South Africa and the Netherlands, caprine-
Figure 3. PCAs of bovine-based infant formula sold in South Africa and the Netherlands, caprine-
and soya-based infant formulae sold in the UK and skimmed milk powder sold in the UK. Panel (A),
and soya-based infant formulae sold in the UK and skimmed milk powder sold in the UK. Panel (A),
phospholipids. Panel (B), triglycerides and diglycerides. Panel (C), Triglycerides and diglycerides for
phospholipids. Panel (B), triglycerides and diglycerides. Panel (C), Triglycerides and diglycerides for
Dutch brand 2 (NLB2), with the three most abundant fatty ingredients marked in two subgroups. Panel
Dutch brand 2 (NLB2), with the three most abundant fatty ingredients marked in two subgroups.
(D), important loading variables for NLB2 that are consistent with independent profiling of coconut
Panel (D), important loading variables for NLB2 that are consistent with independent profiling of
triglycerides. R2 values for each component are shown in parentheses on each axis. Capr., caprine;
coconut triglycerides. R2 values for each component are shown in parentheses on each axis. Capr.,
Form, formula; G. m., Glycine max; NL, Netherlands; SA, South Africa; SMP, skimmed milk powder.
caprine; Form, formula; G. m., Glycine max; NL, Netherlands; SA, South Africa; SMP, skimmed milk
powder.
A PCA plot of the glycerides in the same samples (collected in positive ion mode) indicated
that the Dutch formula falls into two subgroups (Figure 3C). The ingredients listed on the packaging
A PCA
suggested plot
that theofmixture
the glycerides in the same
of oils differed in thesamples
composition(collected in positive
of formula aimedion at mode) indicated
the younger (0–6 that
mo,
the Dutch formula falls into two subgroups (Figure 3C). The ingredients
6–10 mo and 10–12 mo, viz. 1, 2 and 3) and older (12–18 mo, 18–24 mo and 24–36 mo, viz. 4, 5 and listed on the packaging
suggested
6) that the3C).
infants (Figure mixture of oils differed
The ingredients lists in
of the
the composition
formulae aimed of formula aimed
at younger at thequotes
infants younger palm,(0-
6mo, 6-10mo
rapeseed, and 10-12mo,
coconut and sunflowerviz. 1, oils.
2 andThe 3) and older (12-18mo,
formulae 18-24mo
for older infants and 24-36mo,
comprise viz. 4, 5 and
palm, sunflower and 6)
infants (Figure 3C). The ingredients lists of the formulae aimed at
rapeseed oils. This indicates that formulations for younger infants are comprised coconut oil andyounger infants quotes palm,
rapeseed,
less coconut
sunflower and sunflower
oil than rapeseed oil. oils. The
The variable
formulaeloadings
for olderthatinfants
are comprise
associatedpalm, withsunflower
the resultsand of
rapeseed oils. This indicates that formulations for younger infants are
the unsupervised MVA (Figure 3D) show that the formulae for younger and older infants form two comprised coconut oil and less
sunflower oil
subgroups, than
albeit rapeseed
with varietyoil. The groups
within variable(mainly
loadings that are
in PC2). associated
These results arewith the results
consistent of this
with the
unsupervised MVA (Figure 3D) show that the formulae for younger and
and data already published on the fatty acid profile of rapeseed, sunflower and coconut oils [35,36]. older infants form two
subgroups,
These studiesalbeit
showedwiththatvariety
overwithin
70% ofgroups
the fatty (mainly
acids in PC2). These
in coconut results are14
oil comprised consistent
carbons with this
or fewer,
and data already published on the fatty acid profile of rapeseed, sunflower
where 80% of the fatty acids in sunflower and rapeseed oil comprised 18 carbons or more. The latter and coconut oils [35,36].
These
two studies
oils showed
differed in thatthat over 70%
sunflower oil of the fattyabout
contained acids twice
in coconut
as many oil comprised
unsaturated 14bonds
carbons or fewer,
as rapeseed
where
oil. This80% of the fatty
suggested thatacids in sunflower
the groups and rapeseed
of formulations in NLB2oil comprised 18 carbons
products differ by both orthe
more. Theof
length latter
the
two oils differed in that sunflower oil contained about twice as many unsaturated
carbon chains of the fatty acid residues and the profile of mono- and di-unsaturated fatty acid residues. bonds as rapeseed
oil. This
The suggested
variety of thatlipidtheandgroups of formulations
glyceride profiles found in NLB2 products
in British differ
formula ledbyus both the length
to test whether of the
the
carbon chains of the fatty acid residues and the profile of mono- and
same formulations were used by one manufacturer across two regions of Western Europe. We useddi-unsaturated fatty acid residues.
The variety
PCAs of lipidtwo
to compare andbrands
glyceride profilesbyfound
produced in British
the same formula led
manufacturer, oneusoftowhich
test whether
was sold theinsame
the
formulations were used by one manufacturer across two regions of Western
UK and the other in the Netherlands. The glyceride fractions of UKB1 grouped clearly (Figure 1C), Europe. We used PCAs
to compare
with two brands
some evidence producedinbythe
of grouping thelipid
same manufacturer,
fraction one of which
as well (Figure was soldthe
1G). However, in the UK and
differences
the other in the Netherlands. The glyceride fractions of UKB1 grouped
in profile between the subgroups that describe UKB1 subtypes were larger than those between clearly (Figure 1C), with some
the
evidence
two of grouping
subgroups of NLB2 in (Figure
the lipid4).fraction
It wasas well (Figure
obvious from the1G).ingredients
However, liststhe differences
precisely how in profile
those
between
results the subgroups
might relate to thethat describe
pattern observed.UKB1The subtypes were
difference in larger than those
the subgroups between
of UKB1 0–6 the
mo andtwo
subgroups of NLB2 (Figure 4). It was obvious from the ingredients lists precisely how those results
might relate to the pattern observed. The difference in the subgroups of UKB1 0-6mo and 6-12mo
differed by date of manufacture, suggesting that the formulation could have been changed withinNutrients 2019, 11, 1122 7 of 13
Nutrients 2019, 11, x FOR PEER REVIEW 7 of 13
6–12 mo differed by date of manufacture, suggesting that the formulation could have been changed
within theof
the order order of ingredients
ingredients listed. listed. The increase
The increase in abundance
in abundance of TG(50:02)
of TG(50:02) in UKB1
in UKB1 formulations
formulations (Fig.
(Figure 4A) without
4A) without a concomitant
a concomitant increaseincrease in the abundance
in the abundance of 2DG-H
of DG-H 2 O(32:01),
O(32:01), suggests
suggests that is
that there there is
more
more FA(18:02) in subtypes 24 mo+ and 0–6 mo (Hungry). This is consistent with a greater
FA(18:02) in subtypes 24 mo+ and 0-6 mo (Hungry). This is consistent with a greater proportion of proportion
of linoleic
linoleic acid
acid andand thus
thus sunflower
sunflower oiloil over
over rapeseed
rapeseed oil.oil.
Figure 4.
Figure PCAswith
4. PCAs withimportant
importantloading
loadingvariables
variablesforfor Dutch
Dutch and
and British
British brands
brands that
that areare produced
produced by
by the same manufacturer. Panel (A), triglycerides; (B), phospholipids. DG, diglycerides;
the same manufacturer. Panel (A), triglycerides; (B), phospholipids. DG, diglycerides; PC, PC,
phosphatidylcholine; PE, phosphatidylethanolamine; PI, phosphatidylinositol; TG, triglyceride. 1,
phosphatidylcholine; PE, phosphatidylethanolamine; PI, phosphatidylinositol; TG, triglyceride. 1, 0-
0–6 mo; 2, 6–12 mo; 3, 12–24 mo; 24 mo+; H, 0–6 mo (hungry); NL, Dutch formula.
6mo; 2, 6-12mo; 3, 12-24mo; 24mo+; H, 0-6mo (hungry); NL, Dutch formula.
4. Discussion
4. Discussion
Most infants in the UK will be exposed to formula in early life [19,20]. For many infants, it will be
theirMost
maininfants
source in of the UK willAtbethe
nutrition. exposed
moment, to formula in early
it is unclear if thelife [19,20].
lipid profileForofmany infants,has
the formula it will
an
be their main source of nutrition. At the moment, it is unclear if the lipid
impact on the infant’s growth and development. Our ability to characterise the relationship between profile of the formula has
an
the impact on the infant’s
lipid composition growth
of formula andand development.
infant growth andOur ability to relies
development characterise
entirely the relationship
on the evidence
we have about the composition of formula. In most research, it is assumed that formulae are theon
between the lipid composition of formula and infant growth and development relies entirely the
same
evidence
or similar weandhave
thereabout
is verythe composition
little appreciation ofof
formula. In mostthat
the possibility research,
the same it brand
is assumed thatofformulae
and type formula
are the same or similar and there is very little appreciation of the possibility
can change abruptly. It is also widely assumed that results of research on the effect of the local that the same brand and
formula
type
carriedof out
formula can change
in a particular abruptly.
region It is also
or country willwidely assumed that
be transferrable results
to other of research on the effect
places.
of theInlocal formula carried out in a particular region or country will be
this study, we used direct infusion mass spectrometry to survey the lipids and glycerides transferrable to other places.
in an
In this study, we used direct infusion mass spectrometry
array of British infant formula, which were sourced over a period of 15 months, as wellto survey the lipids and glycerides
as formula in
an array
based onof British
cows’ infant
milk soldformula, which wereand
in the Netherlands sourced
Southover a period
Africa and fresh of 15animal
months, as well
milk. We as formula
developed
based on cows’ milk sold in the Netherlands and South Africa and fresh
new methods for extracting the lipid fraction from samples, which facilitated the profiling of both animal milk. We developed
new methods for
the glycerides andextracting
phospholipidsthe lipidandfraction frominsamples,
fatty acids the latter.which facilitated the
The triglyceride profiling
profiles are of both the
difficult to
glycerides and phospholipids and fatty acids in the latter. The triglyceride
predict from the list of ingredients, because the formula tested comprises as many as seven sources of profiles are difficult to
predict from the list of ingredients, because the formula tested comprises as many as seven sources
of fat in unknown amounts. All formulae that were profiled comprised up to seven of eight sources
of triglycerides (palm oil, rapeseed oil, sunflower oil, coconut oil, fish oil, soya oil, single cell oil, oilNutrients 2019, 11, 1122 8 of 13
fat in unknown amounts. All formulae that were profiled comprised up to seven of eight sources of
triglycerides (palm oil, rapeseed oil, sunflower oil, coconut oil, fish oil, soya oil, single cell oil, oil from
Mortierella alpina). Although some of these fats possess a distinct fatty acid profile [35], profiles of the
fatty acid composition are not commonly available, may vary between regions and growing seasons or
comprise a variety of sources (e.g., single cell oil). The phospholipid fraction of formula is typically
constructed of material from milk and/or Glycine max (soya), which have contrasting molecular profiles.
Because there is a wide range of formulae available and the importance of having a comprehensive
overview of the molecular profile increases with the uptake of formula, we needed to develop a
high-throughput approach.
The data collected in the present study rely on the methods used to both extract the analytes of
interest and survey the mixture of them. The new preparative and analytical methods developed
for this study are sympathetic to the experimental challenges that a large set of samples of milk and
formula present. For example, there is at least 50 times as much fat as phospholipid in milk. This is
an experimental barrier for detailed molecular profiling as the samples comprise species that differ
in abundance by more than three orders of magnitude. This difficulty, as well as an interest in the
lipid composition of milk, has led to studies focused on the lipid fraction in milk without profiling the
glycerides [37,38]. However, we found that using positive mode for the glyceride fraction and negative
mode for lipids alleviates many of the problems associated with the suppression of phospholipids
by the much more abundant di- and triglycerides. Resolution was improved further by washing
phospholipid samples with petroleum ether as this removes the bulk of glycerides. The latter succeeded
in increasing the number of phospholipid isoforms measured in negative mode from 153 to 427. The
abundance of glycerides means that only a handful were detected in positive mode.
The use of a different mode for profiling phospholipids invites the question of whether or not
this is reliable. Despite the possible differences in ionisation efficiency between different lipid head
groups in the different modes, the abundance of phospholipids in fresh milk measured using negative
mode DI-MS in this study are similar to studies using NMR, an orthogonal technique. 31 P NMR has
been used to profile the relative abundance of phospholipids in cows’ and Ewes’ milk [39], and in
formula [38]. Thus, the values reported agree with the abundance of these lipids as measured in
negative mode in this study.
However, despite the utility afforded by the present methods, it is not yet known whether other
compounds present in milk, that fall below the limit of detection or for which there are not yet standards
available, have associated metabolic effects. Our results show that the molecular profile of formula
typically deviates significantly from fresh milk, both in terms of glycerides and lipids. However, a
recent study of infant formula sold in Spain and human milk from Galician women suggests that
in Galicia at least, the overall fatty acid profile of the two is generally similar except for essential
poly-unsaturated fatty acids [21]. A combination of the results from that study and the present one
therefore suggest that formula may possess different configurations of lipids and fats to human milk,
rather than comprising different fatty acids. The essential poly-unsaturated fatty acid DHA was only
detected in a small fraction of phospholipid isolates from formula in the present study, suggesting that
the DHA is invested in triglycerides in infant formula.
It is not clear at present what effect a different presentation of a similar profile of fatty acids in
human milk and formula has on infant development and whether it applies universally. There is
evidence for different growth trajectories in breast- and formula- fed infants [40,41], for a different lipid
profile in the circulation of breast- and formula fed infants [5,6] and for a relationship between the
lipid profile of the circulation of infants and the lipid composition of the human milk they are fed [4].
At present, it is not known precisely how much formula and human milk differ in other respects that
influence growth, such as calorific value, mineral composition and protein composition. This is partly
due to the experimental barriers of determining the variety of dietary intake across the globe but also
the relationship between the mother’s diet and lifestyle and the composition of her milk.Nutrients 2019, 11, 1122 9 of 13
The evidence that formulae have contrasting lipid profiles over time and across brands etc.
naturally raises the question of how this affects infants. Large-scale metabolic or random controlled
trial studies that detail the lipid composition of both formula and the infants that receive it have yet
to be reported. However, there are studies of the lipid profile in circulo of formula-fed infants. This
growing body of work suggests that the profile of lipids in the circulation of formula-fed infants at
three months may be just as rich as for age-matched breastfed infants. There is even some evidence
that formula-fed infants fall into subgroups, unlike breastfed ones [5,6]. The same studies suggest
that the lipid profile of formula-fed infants is less varied at 12 months than that of breastfed ones [6].
Further study may indicate what association, if any, this has with the reported lower risk of obesity in
breastfed infants [42]. This invites further detailed studies of nutritional programming.
There is a growing body of evidence that the mother’s diet and lifestyle programmes her infants’
metabolic activity for its lifetime [43–47]. Research in this field has recently broadened to show that the
father’s diet can also be influential [48,49]. Although it is not yet clear that the feeding post partum has
the same magnitude of effects, it is appealing to speculate that different intakes of lipids and fats post
partum may result in systems programmed differently and thus that behave differently. This may have
influenced the development of formulations and led to them more closely resembling the fatty acid
profile of breast milk. This may also have contributed to recent changes in the composition of infant
formula. However, further work is required to elucidate what effect this has and how best to regulate
or inform it.
For example, the British formula we profiled across the time period sampled (November
2017-January 2019) shows a trend of greater use of coconut oil in formula, despite it being considerably
more expensive than the most abundant and least expensive fat used, palm oil (coconut oil was
60–250% more expensive than palm oil in the period of 2014–2018 (www.indexmundi.com for prices in
Sterling in March 2019). It was already being used in a number of formulae targeted at younger infants
(0–6 mo) but during this period it has also appeared in formulae aimed at toddlers. This ingredient is a
rich source of triglycerides that comprise fatty acids with chains of 12 or 14 carbons. These closely
resemble the triglycerides produced de novo in humans.
However, we also note that formula has evolved differently to fresh milk. Formula has been
developed to the point of being a powder that readily forms an oil-in-water emulsion in lukewarm or
cold water instantaneously, without using agitation equipment. Practical considerations have also led
to it being less perishable than fresh milk. The formula we surveyed typically had a use by date of one
month from opening and a date of manufacture as much as three months before it was sold. By contrast,
cows’ milk is collected twice daily from the teat, stored for up to 48 h before transport to processing
centres where it is pasteurised, homogenised and may be skimmed before being sold. Milk therefore
typically reaches the supermarket shelf 3–6 days after collection. It has a use by date of around a week
from the date of sale and is marked ‘consume within three days of opening’. Furthermore, evidence
that fresh milk comprises active lipases [31–33] suggests that it will also change during storage in a
way that a dry powder similar to those investigated in this study will not. Further work is required to
determine the fragility of formula, in particular, the evidence for a considerable number of oxidised
triglycerides (~4%). The metabolic effect(s) of species such as oxidised triglycerides have not yet been
characterised in infants. There is reasonable evidence to warrant the assumption that these compounds
can have possible down-stream biological activity [50,51], for example, though agonism of PPAR
receptors by oxidised fatty acids [52].
The suggestion of possible down-stream effects of the components of infant formula, and indeed
human milk, naturally raise the question of whether such components should be present in synthetic
preparations, and if so, how much. The present study is unable to answer this question formally as it
does not comprise metabolic studies. However, further work might include these, perhaps in an animal
model, in order to test the relationship between individual molecular components and down-stream
cardio-metabolic health.Nutrients 2019, 11, 1122 10 of 13
Lastly, we suggest that the variety of triglyceride and lipid profiles implies that the oil-in-water
emulsion structure that formula presumably adopts is flexible to shifts in composition. This suggests
that it may be possible to reflect further research about the role of individual lipid or triglyceride
components in metabolic health in the composition of formula.
5. Conclusions
This study shows that infant formula not only differs by region, manufacturer, source, date of
manufacture and target demographic, but moreover that these differences are impossible to predict
from the information on the package. A variety of influences shape the lipid and glyceride profile
observed, some of which have a dramatic effect on the composition measured. The most pronounced
example of this is the use of lecithin from Glycine max as an emulsifier.
Our results show that it will be impossible to objectively correlate the effect of lipids and fats in
formula with the infant’s growth and development without measuring the actual composition. There
is no evidence that results obtained with a particular type of formula of a certain brand in one country
can be translated to any other formula or any other country. Detailed metabolic studies, that include
profiling of the formula used, are still required to determine how formula-feeding affects infants and
their development.
Supplementary Materials: The following are available online at http://www.mdpi.com/2072-6643/11/5/1122/s1,
Figure S1: Profile of the head groups of fresh milk collected in positive mode of Direct Infusion-MS. Panel A,
all head groups; B, most abundant types, Figure S2: The glyceride profile of cows’ milk (Bov-) and soya milk,
collected in the positive mode of Direct Infusion MS. Whole, unwashed; PW, washed with hexane, Figure S3:
Profile of the head groups of fresh milk collected in negative mode of Direct Infusion-MS. Left, whole sample;
Right, hexane-washed samples (see methods), Figure S4: Profile of fatty acids collected in negative mode of Direct
Infusion-MS with collision-induced dissociation of samples washed with hexane. Left, more abundant species;
Right, less abundant species, Figure S5, PCAs of the British formula (UKB1-4) representing glyceride (left column),
lipid (middle column) and fatty acid (right column) profiles. Samples are grouped according to Brand (top row),
Target demographic (middle row) and Date sold (bottom row), Spreadsheets 1: (unblinded list of infant formulae
and manufacturers), Spreadsheets 2: (full signals list), Table S1, Internal lipid, fatty acid, sterol, and triglyceride
standards used in the present study.
Author Contributions: Conceptualization, S.F. and A.K.; methods, S.F.; formal analysis, S.F.; investigation, S.F.;
resources, A.K.; data curation, S.F.; writing—original draft preparation, S.F.; writing—review and editing, S.F. and
A.K.; project administration, A.K.; funding acquisition, A.K.
Funding: Financial support came from the BBSRC (BB/M027252/1) and NIHR Biomedical Research Centre
Cambridge. This research is supported by funding from the National Institute for Health Research Cambridge
Biomedical Research Centre.
Acknowledgments: The authors would like to thank A. Prioreschi, B. J. Jenkins and S. Cohen for helpful discussions.
Conflicts of Interest: The authors declare no conflict of interest.
References
1. Uauy, R.; Castillo, C. Lipid requirements of infants: Implications for nutrient composition of fortified
complementary foods. J. Nutr. 2003, 133, 2962–2972. [CrossRef] [PubMed]
2. Ravelli, A.C.J.; van der Meulen, J.H.P.; Osmond, C.; Barker, D.J.P.; Bleker, O.P. Infant feeding and adult
glucose tolerance, lipid profile, blood pressure, and obesity. Arch. Dis. Child. 2000, 82, 248–252. [CrossRef]
[PubMed]
3. Hardy, S.C.; Kleinman, R.E. Fat and cholesterol in the diet of infants and young children: Implications for
growth, development, and long-term health. J. Pediatr. 1994, 125, S69–S77. [CrossRef]
4. Furse, S.; Billing, G.; Snowden, S.G.; Smith, J.; Goldberg, G.; Koulman, A. Evidence that maternal lipids
influence their infant’s lipid profile through breast milk. Metabolomics 2019. under review.
5. Furse, S.; Snowden, S.G.; Laurentya, O.; Prentice, P.; Ong, K.; Hughes, I.A.; Acerini, C.L.; Dunger, D.B.;
Koulman, A. Evidence that feeding post partum and exposures in utero modulate shape lipid metabolism in
infancy. Metabolomics. 2019, under review.
6. Prentice, P.; Koulman, A.; Matthews, L.; Acerini, C.L.; Ong, K.K.; Dunger, D.B. Lipidomic analyses, breast-
and formula-feeding and growth in infants. J. Pediatr. 2015, 166, 276–281. [CrossRef]Nutrients 2019, 11, 1122 11 of 13
7. Acharjee, A.; Prentice, P.; Acerini, C.; Smith, J.; Hughes, I.A.; Ong, K.; Griffin, J.L.; Dunger, D.; Koulman, A.
The translation of lipid profiles to nutritional biomarkers in the study of infant metabolism. Metabolomics
2017, 13, 25. [CrossRef]
8. Koulman, A.; Prentice, P.; Wong, M.C.Y.; Matthews, L.; Bond, N.J.; Eiden, M.; Griffin, J.L.; Dunger, D.B. The
development and validation of a fast and robust dried blood spot based lipid profiling method to study
infant metabolism. Metabolomics 2014, 10, 1018–1025. [CrossRef]
9. Ghebremeskel, K.; Leighfield, M.; Leaf, A.; Costeloe, K.; Crawford, M. Fatty acid composition of plasma and
red cell phospholipids of preterm babies fed on breast milk and formulae. Eur. J. Pediatr. 1995, 154, 46–52.
[CrossRef]
10. Sabel, K.G.; Lundqvist-Persson, C.; Bona, E.; Petzold, M.; Strandvik, B. Fatty acid patterns early after
premature birth, simultaneously analysed in mothers’ food, breast milk and serum phospholipids of mothers
and infants. Lipids Health Dis. 2009, 8, 20. [CrossRef]
11. VanderJagt, D.J.; Arndt, C.D.; Okolo, S.N.; Huang, Y.S.; Chuang, L.T.; Glew, R.H. Fatty acid composition of
the milk lipids of fulani women and the serum phospholipids of their exclusively breast-fed infants. Early
Hum. Dev. 2000, 60, 73–87. [CrossRef]
12. Harit, D.; Faridi, M.M.A.; Aggarwal, A.; Sharma, S.B. Lipid profile of term infants on exclusive breastfeeding
and mixed feeding: A comparative study. Eur. J. Clin. Nutr. 2007, 62, 203–209. [CrossRef] [PubMed]
13. Ortega, R.M.; Requejo, A.M.; Navia, B.; Quintas, M.E.; Andrés, P.; López-Sobaler, M.; Perea, J.M. The
consumption of milk products in a group of pre-school children: Influence on serum lipid profile. Nutr. Res.
2000, 20, 779–790. [CrossRef]
14. Steinmetz, K.A.; Childs, M.T.; Stimson, C.; Kushi, L.H.; McGovern, P.G.; Potter, J.D.; Yamanaka, W.K. Effect
of consumption of whole milk and skim milk on blood lipid profiles in healthy men. Am. J. Clin. Nutr. 1994,
59, 612–618. [CrossRef]
15. Nagaya, T.; Yoshida, H.; Hayashi, T.; Takahashi, H.; Kawai, M.; Matsuda, Y. Serum lipid profile in relation to
milk consumption in a japanese population. J. Am. Coll. Nutr. 1996, 15, 625–629. [CrossRef]
16. Tricon, S.; Burdge, G.C.; Jones, E.L.; Russell, J.J.; El-Khazen, S.; Moretti, E.; Hall, W.L.; Gerry, A.B.; Leake, D.S.;
Grimble, R.F.; et al. Effects of dairy products naturally enriched with cis-9,trans-11 conjugated linoleic acid
on the blood lipid profile in healthy middle-aged men. Am. J. Clin. Nutr. 2006, 83, 744–753. [CrossRef]
17. Mott, G.E.; Jackson, E.M.; DeLallo, L.; Lewis, D.S.; McMahan, C.A. Differences in cholesterol metabolism in
juvenile baboons are programmed by breast- versus formula-feeding. J. Lipid Res. 1995, 36, 299–307.
18. Mott, G.E.; Jackson, E.M.; Klein, M.L.; Shan, H.; Pang, J.; Wilson, W.K.; McMahan, C.A. Programming of
initial steps in bile acid synthesis by breast-feeding vs. Formula-feeding in the baboon. Lipids 2003, 38,
1213–1220. [CrossRef]
19. Victora, C.G.; Bahl, R.; Barros, A.J.D.; França, G.V.A.; Horton, S.; Krasevec, J.; Murch, S.; Sankar, M.J.;
Walker, N.; Rollins, N.C. Breastfeeding in the 21st century: Epidemiology, mechanisms, and lifelong effect.
Lancet 2016, 387, 475–490. [CrossRef]
20. Rollins, N.C.; Bhandari, N.; Hajeebhoy, N.; Horton, S.; Lutter, C.K.; Martines, J.C.; Piwoz, E.G.; Richter, L.M.;
Victora, C.G. Why invest, and what it will take to improve breastfeeding practices? Lancet 2016, 387, 491–504.
[CrossRef]
21. Barreiro, R.; Regal, P.; López-Racamonde, O.; Cepeda, A.; Fente, C.A. Comparison of the fatty acid profile of
spanish infant formulas and galician women breast milk. J. Physiol. Biochem. 2018, 74, 127–138. [CrossRef]
22. Mendonça, M.A.; Araújo, W.M.C.; Borgo, L.A.; Alencar, E.D.R. Lipid profile of different infant formulas for
infants. PLoS ONE 2017, 12, e0177812. [CrossRef] [PubMed]
23. Oleynik, A.S.; Eliseeva, T.A.; Vanderhoek, J. Comparative lipid profiles of milk bank breast milk and infant
formulas. Open Nutr. J. 2013, 7, 26–31. [CrossRef]
24. Gianni, M.L.; Roggero, P.; Baudry, C.; Fressange-Mazda, C.; Galli, C.; Agostoni, C.; le Ruyet, P.; Mosca, F. An
infant formula containing dairy lipids increased red blood cell membrane omega 3 fatty acids in 4 month-old
healthy newborns: A randomized controlled trial. BMC Pediatr. 2018, 18, 53. [CrossRef]
25. Uhl, O.; Fleddermann, M.; Hellmuth, C.; Demmelmair, H.; Koletzko, B. Phospholipid species in newborn
and 4 month old infants after consumption of different formulas or breast milk. PLoS ONE 2016, 11, e0162040.
[CrossRef]Nutrients 2019, 11, 1122 12 of 13
26. Furse, S.; Jakubec, M.; Rise, F.; Williams, H.E.; Rees, C.E.D.; Halskau, O. Evidence that listeria innocua
modulates its membrane’s stored curvature elastic stress, but not fluidity, through the cell cycle. Sci. Rep.
2017, 7, 8012. [CrossRef]
27. Vítová, M.; Lanta, V.; Rise, F.; Jakubec, M.; Halskau, Ø.; Furse, S. The phospholipid profile of desmodesmus
quadricauda is a function of its cell cycle. Unpublished work. 2019.
28. Furse, S.; Egmond, M.R.; Killian, J.A. Isolation of lipids from biological samples. Mol. Membr. Biol. 2015, 32,
55–64. [CrossRef] [PubMed]
29. Furse, S.; Eriksen, K.G.; Moore, S.E.; Koulman, A. Identification of candidate molecular biomarkers for
growth faltering in infants at 12w. Unpublished work. 2018.
30. Harshfield, E.L.; Koulman, A.; Ziemek, D.; Marney, L.; Fauman, E.B.; Paul, D.S.; Stacey, D.; Rasheed, A.;
Lee, J.J.; Shah, N.; et al. An unbiased lipid phenotyping approach to study the genetic determinants of lipids
and their association with coronary heart disease risk factors. J. Proteome Res. 2019, 18. [CrossRef]
31. Deeth, H.C. Lipoprotein lipase and lipolysis in milk. Int. Dairy J. 2006, 16, 555–562. [CrossRef]
32. Neville, M.C.; Waxman, L.J.; Jensen, D.; Eckel, R.H. Lipoprotein lipase in human milk: Compartmentalization
and effect of fasting, insulin, and glucose. J. Lipid Res. 1991, 32, 251–257.
33. Bengtsson-Olivecrona, G.; Olivecrona, T. [32] phospholipase activity of milk lipoprotein lipase. In Methods in
Enzymology; Academic Press: London, UK, 1991; Volume 197, pp. 345–356.
34. Chong, J.; Soufan, O.; Li, C.; Caraus, I.; Li, S.; Bourque, G.; Wishart, D.S.; Xia, J. Metaboanalyst 4.0: Towards
more transparent and integrative metabolomics analysis. Nucleic Acids Res. 2018, 46, W486–W494. [CrossRef]
[PubMed]
35. Orsavova, J.; Misurcova, L.; Vavra Ambrozova, J.; Vicha, R.; Mlcek, J. Fatty acids composition of vegetable
oils and its contribution to dietary energy intake and dependence of cardiovascular mortality on dietary
intake of fatty acids. Int. J. Mol. Sci. 2015, 16, 12871–12890. [CrossRef]
36. Furse, S.; Liddell, S.; Ortori, C.A.; Williams, H.; Neylon, D.C.; Scott, D.J.; Barrett, D.A.; Gray, D.A. The
lipidome and proteome of oil bodies from helianthus annuus (common sunflower). J. Chem. Biol. 2013, 6,
63–76. [CrossRef]
37. Blaas, N.; Schüürmann, C.; Bartke, N.; Stahl, B.; Humpf, H.U. Structural profiling and quantification of
sphingomyelin in human breast milk by hplc-ms/ms. J. Agric. Food Chem. 2011, 59, 6018–6024. [CrossRef]
38. Fong, B.; Ma, L.; Norris, C. Analysis of phospholipids in infant formulas using high performance liquid
chromatography–tandem mass spectrometry. J. Agric. Food Chem. 2013, 61, 858–865. [CrossRef]
39. Murgia, S.; Mele, S.; Monduzzi, M. Quantitative characterization of phospholipids in milk fat via p-31 nmr
using a monophasic solvent mixture. Lipids 2003, 38, 585–591. [CrossRef]
40. Gale, C.; Parkinson, J.R.; Logan, K.M.; Hyde, M.J.; Santhakumaran, S.; Modi, N. Effect of breastfeeding
compared with formula feeding on infant body composition: A systematic review and meta-analysis. Am. J.
Clin. Nutr. 2012, 95, 656–669. [CrossRef] [PubMed]
41. Huang, P.; Zhou, J.; Yin, Y.; Jing, W.; Luo, B.; Wang, J. Effects of breast-feeding compared with formula-feeding
on preterm infant body composition: A systematic review and meta-analysis. Br. J. Nutr. 2016, 116, 132–141.
[CrossRef]
42. Bernardo, H.; Cesar, V. Long-Term Effects of Breastfeeding: A Systematic Review; WHO: Geneva, Switzerland, 2013.
43. Blackmore, H.L.; Niu, Y.; Fernandez-Twinn, D.S.; Tarry-Adkins, J.L.; Giussani, D.A.; Ozanne, S.E. Maternal
diet-induced obesity programs cardiovascular dysfunction in adult male mouse offspring independent of
current body weight. Endocrinology 2014, 155, 3970–3980. [CrossRef] [PubMed]
44. Loche, E.; Blackmore, H.L.; Carpenter, A.A.; Beeson, J.H.; Pinnock, A.; Ashmore, T.J.; Aiken, C.E.; de
Almeida-Faria, J.; Schoonejans, J.M.; Giussani, D.A.; et al. Maternal diet-induced obesity programmes
cardiac dysfunction in male mice independently of post-weaning diet. Cardiovasc. Res. 2018, 114, 1372–1384.
[CrossRef] [PubMed]
45. Fernandez-Twinn, D.S.; Gascoin, G.; Musial, B.; Carr, S.; Duque-Guimaraes, D.; Blackmore, H.L.; Alfaradhi, M.Z.;
Loche, E.; Sferruzzi-Perri, A.N.; Fowden, A.L.; et al. Exercise rescues obese mothers’ insulin sensitivity, placental
hypoxia and male offspring insulin sensitivity. Sci. Rep. 2017, 7, 44650. [CrossRef]
46. Samuelsson, A.M.; Matthews, P.A.; Argenton, M.; Christie, M.R.; McConnell, J.M.; Jansen, E.H.J.M.;
Piersma, A.H.; Ozanne, S.E.; Fernandez-Twinn, D.; Remacle, C.; et al. Diet-induced obesity in female
mice leads to offspring hyperphagia, adiposity, hypertension, and insulin resistance. Hypertension 2008, 51,
383–392. [CrossRef]Nutrients 2019, 11, 1122 13 of 13
47. Shelley, P.; Martin-Gronert, M.S.; Rowlerson, A.; Poston, L.; Heales, S.J.R.; Hargreaves, I.P.; McConnell, J.M.;
Ozanne, S.E.; Fernandez-Twinn, D.S. Altered skeletal muscle insulin signaling and mitochondrial complex
ii-iii linked activity in adult offspring of obese mice. Am. J. Physiol. Regul. Integr. Comp. Physiol. 2009, 297,
R675–R681. [CrossRef]
48. Watkins, A.J.; Dias, I.; Tsuro, H.; Allen, D.; Emes, R.D.; Moreton, J.; Wilson, R.; Ingram, R.J.M.; Sinclair, K.D.
Paternal diet programs offspring health through sperm- and seminal plasma-specific pathways in mice.
Proc. Natl. Acad. Sci. USA 2018, 115, 10064–10069. [CrossRef]
49. Watkins, A.J.; Sirovica, S.; Stokes, B.; Isaacs, M.; Addison, O.; Martin, R.A. Paternal low protein diet programs
preimplantation embryo gene expression, fetal growth and skeletal development in mice. Biochim. Biophys.
Acta Mol. Basis Dis. 2017, 1863, 1371–1381. [CrossRef]
50. Garelnabi, M.; Ainsworth, G.; Mahini, H.; Jamil, N.; Ochin, C. Dietary oxidized linoleic acid modulates
plasma lipids beyond triglycerides metabolism. J. Lipids 2017, 2017, 1645828. [CrossRef]
51. Nagy, L.; Tontonoz, P.; Alvarez, J.G.A.; Chen, H.; Evans, R.M. Oxidized ldl regulates macrophage gene
expression through ligand activation of pparγ. Cell 1998, 93, 229–240. [CrossRef]
52. Itoh, T.; Yamamoto, K. Peroxisome proliferator activated receptor γ and oxidized docosahexaenoic acids as
new class of ligand. Naunyn Schmiedeberg’s Arch. Pharmacol. 2008, 377, 541–547. [CrossRef]
© 2019 by the authors. Licensee MDPI, Basel, Switzerland. This article is an open access
article distributed under the terms and conditions of the Creative Commons Attribution
(CC BY) license (http://creativecommons.org/licenses/by/4.0/).You can also read