Does Car-Sharing Reduce Car Ownership? Empirical Evidence from Germany - MDPI

Page created by Veronica Lane
 
CONTINUE READING
Does Car-Sharing Reduce Car Ownership? Empirical Evidence from Germany - MDPI
sustainability

Article
Does Car-Sharing Reduce Car Ownership? Empirical Evidence
from Germany
Aaron Kolleck

                                          Weizenbaum-Institut, Technische Universität Berlin, 10623 Berlin, Germany; akolleck@inet.tu-berlin.de

                                          Abstract: The sharing economy is making its way into our everyday lives. One of its business models,
                                          car-sharing, has become highly popular. Can it help us increase our sustainability? Besides emissions
                                          and vehicle miles traveled, one key aspect in the assessment regards the effect of car-sharing on
                                          car ownership. Previous studies investigating this effect have relied almost exclusively on surveys
                                          and come to very heterogeneous results, partly suggesting spectacular substitution rates between
                                          shared and private cars. This study empirically explores the impact of car-sharing on noncorporate
                                          car ownership and car markets in 35 large German cities. The analysis draws on publicly available
                                          data for the years 2012, 2013, 2015, and 2017, including, among others, the number of shared cars
                                          per operating mode (free-floating and station-based) and the number of cars owned and registered
                                          by private individuals (i.e., excluding company cars). We find that one additional station-based car
                                          is associated with a reduction of about nine private cars. We do not find a statistically significant
                                          relation between car ownership and free-floating car-sharing. Neither type of car-sharing appears
                                          to impact the markets for used and new cars significantly. Given the measurable impacts on car
                                          ownership levels, this result is surprising and invites future research to study car-sharing’s impact
                                          on the dynamics of car markets.


Citation: Kolleck, A. Does
                                          Keywords: car-sharing; sharing economy; economic impact; car ownership; first difference
Car-Sharing Reduce Car Ownership?
Empirical Evidence from Germany.
Sustainability 2021, 13, 7384. https://
doi.org/10.3390/su13137384                1. Introduction
                                                The sharing economy is considered a trend that fundamentally disrupts consumer
Academic Editors: Margareta Friman,       habits, the organization of value chains, and economic activities. Through sharing instead
Lars Olsson and Hugo Guyader              of owning, the sharing economy promises temporary and flexible access to often expensive
                                          resources. Car-sharing has been available as a mobility service in many cities worldwide
Received: 31 May 2021
                                          for quite some time [1]. Some of its users see it as an alternative to owning a car [2]. From
Accepted: 28 June 2021
                                          a societal perspective, shared use of cars can reduce the number of vehicles required to
Published: 1 July 2021
                                          serve mobility demand. This can reduce (external) costs associated with production and
                                          relieve notoriously scarce parking capacities. In order to assess these benefits, the decisive
Publisher’s Note: MDPI stays neutral
                                          question is whether car-sharing represents a substitute for private car ownership.
with regard to jurisdictional claims in
                                                Many survey-based studies show that car-sharing can substantially reduce car owner-
published maps and institutional affil-
                                          ship among members [3–7]. However, as car-sharing has long been a niche phenomenon,
iations.
                                          the environmental and economic implications have been marginal. Furthermore, findings
                                          among early adopters might not always be generalizable to mass markets, and surveys
                                          can be prone to different biases. Now, in some parts of the world, including Germany,
                                          car-sharing has experienced considerable growth. With more than 2.5 million, the num-
Copyright: © 2021 by the author.
                                          ber of registered users in Germany has increased more than 15-fold in the past ten years
Licensee MDPI, Basel, Switzerland.
                                          (multiple registrations possible), and the number of shared cars has increased more than
This article is an open access article
                                          five-fold (see Section 2.2). Therefore, potential effects must be measured not only in surveys
distributed under the terms and
                                          but also empirically. This work revisits the body of interview-based studies and, for the
conditions of the Creative Commons
                                          first time, tests the estimated substitution rates from these studies empirically. Instead of
Attribution (CC BY) license (https://
creativecommons.org/licenses/by/
                                          using self-reports of the users, we assess the impact by observing city-level changes in
4.0/).
                                          car-sharing, linking these to ownership rates and registrations of used and new cars. With

Sustainability 2021, 13, 7384. https://doi.org/10.3390/su13137384                                      https://www.mdpi.com/journal/sustainability
Sustainability 2021, 13, 7384                                                                                           2 of 17

                                this approach, we focus on the gap between survey-based car-sharing studies and studies
                                empirically researching the impact of the sharing economy on incumbent industries [8].
                                      Using panel data from Germany and a first-difference estimator, we investigate the
                                relation between car ownership, car registrations, and car-sharing for 35 large German
                                cities. The analysis draws on publicly available data for 2012, 2013, 2015, and 2017 and
                                includes the number of shared cars per operating mode and different controls. This study
                                focuses on shared cars that are either operated in a free-floating or station-based mode,
                                which covers the vast majority of shared cars in Germany.
                                      We confirm previous findings to the extent that station-based car-sharing correlates
                                with a reduction in private car ownership (i.e., the stock of noncorporate cars). The effect
                                roughly corresponds to a replacement of nine private cars by one station-based shared car.
                                In contrast, we do not find a significant relation between car ownership and free-floating
                                car-sharing. Furthermore, neither type of car-sharing appears to have a significant and
                                reliable impact on the markets for used and new cars (i.e., the flow of privately purchased
                                cars). Given the measurable impacts on car ownership levels, this result is surprising and
                                invites future research to study car-sharing’s impact on the dynamics of car markets.
                                      This paper is organized as follows. In Section 2, we introduce related research streams
                                and the development of car-sharing in Germany. Section 3 then introduces the materials and
                                method. Section 4 presents the results. We discuss and conclude our findings, implications,
                                limitations, and potential future research in Section 5.

                                2. Literature
                                     This paper intends to integrate two literature streams: the impact of car-sharing and
                                substitutions between traditional markets and sharing platforms. The latter shares a similar
                                methodological approach and will be discussed in the following subsection. In the second
                                subsection, we will first give a short overview of car-sharing in Germany. Third, we give
                                an overview of the mainly survey-based research on station-based car-sharing. Ultimately,
                                in the fourth subsection, focusing on their impacts, we highlight differences between
                                station-based and free-floating car-sharing.

                                2.1. The Sharing Economy and Its Impacts
                                     Airbnb is probably the most prominent example of the sharing economy and has
                                served as a “Guinea pig” for several empirical impact studies [9]. As such, Zervas et al. [8]
                                provided one of the first empirical studies to quantify the impact of the Sharing Economy
                                on an incumbent industry. Using a fixed-effects model, they find that a 1% increase in
                                Airbnb listings is related to a 0.05% decrease in quarterly hotel revenues in Texas, U.S. This
                                substitutive relation is most substantial among low-end hotels (economy, budget), while
                                higher-priced hotels are almost unaffected.
                                     In a methodologically comparable manner, Barron et al. [10] provide strong empirical
                                evidence that Airbnb increases house prices and rents. They conclude that Airbnb listings
                                cause replacements of long-term rentals with short-term accommodation. Methodologically,
                                Barron et al. use a fixed-effects model with an instrument variable. The collected data
                                from 2012 to 2016 includes monthly zip code-level data on Airbnb listings, house prices
                                and rents, and several controls. Other literature on shared housing quantifies the relation
                                between shared lodging and crime [11] and between Airbnb offerings and hotel pricing in
                                Italy [12].
                                     Airbnb is not the only example of the sharing economy whose impact has been
                                studied empirically. Some studies examine ride-hailing services, such as Uber’s effect on
                                the number of business start-ups [13] and its effect on traffic congestion [14]. These studies
                                typically interpret the entry of Uber into a city as a form of treatment and combine this
                                information with publicly available data, for example, by scraping information on the
                                number of funding campaigns or traffic congestion.
Sustainability 2021, 13, x FOR PEER REVIEW                                                                                                              3 of 17

Sustainability 2021, 13, 7384                                                                                     3 ofthe
                                  information with publicly available data, for example, by scraping information on    17
                                  number of funding campaigns or traffic congestion.

                                  2.2. Car-Sharing in Germany
                                  2.2. Car-Sharing in Germany
                                         There are
                                        There      are two
                                                        two major
                                                              major operating
                                                                      operating modes
                                                                                    modes for  for car-sharing
                                                                                                    car-sharing in   in Germany:
                                                                                                                          Germany: free-floating
                                                                                                                                         free-floating and and
                                  station-based.        Free-floating    cars  can  be  found      and   parked      in  a
                                  station-based. Free-floating cars can be found and parked in a predefined business area,  predefined       business     area,
                                  usually city
                                  usually    city centers.
                                                    centers. Members
                                                               Memberstypically
                                                                             typicallylocate
                                                                                          locateand andrent
                                                                                                          rentcars
                                                                                                                 carsvia
                                                                                                                       viasmartphone.
                                                                                                                             smartphone.      InIncontrast
                                                                                                                                                     contrast to
                                  station-based        car-sharing,    they   usually   pay     a  moderate      registration
                                  to station-based car-sharing, they usually pay a moderate registration fee and per trip          fee   and   per   trip  fees
                                  (distance
                                  fees          or time)
                                        (distance           but no
                                                       or time)   butannual
                                                                       no annualfee. Large-scale
                                                                                     fee. Large-scale  free-floating
                                                                                                             free-floating car-sharing
                                                                                                                                 car-sharingstarted    in Ger-
                                                                                                                                                   started   in
                                  many in the
                                  Germany            yearyear
                                                in the     20112011
                                                                 [15].[15].
                                         Station-based car-sharing
                                        Station-based        car-sharing started
                                                                             started much
                                                                                       much earlier,
                                                                                                 earlier, the
                                                                                                           the first
                                                                                                                first offers     launched in
                                                                                                                       offers launched             the 1980s.
                                                                                                                                               in the    1980s.
                                  Similar    to   car  rental  services,   cars  must    be    picked    up   and    brought
                                  Similar to car rental services, cars must be picked up and brought back to a station. The       back    to a  station.    The
                                  differences      between     station-based     car-sharing       and   car  rental    lie
                                  differences between station-based car-sharing and car rental lie in the number of stationsin  the   number      of  stations
                                  and the
                                  and   the rental
                                             rentalprocess.
                                                        process.Car-sharing
                                                                   Car-sharingstations
                                                                                   stations  are   usually
                                                                                                 are  usuallynotnotstaffed
                                                                                                                       staffedandandconsist   of one
                                                                                                                                         consist        or two
                                                                                                                                                    of one   or
                                  parking
                                  two         spaces.
                                        parking          Customers
                                                     spaces.   Customersusually   book, book,
                                                                               usually     pay, and pay,open
                                                                                                          and cars
                                                                                                                 openvia     a smartphone
                                                                                                                          cars  via a smartphone app, some-
                                                                                                                                                          app,
                                  times combined
                                  sometimes       combinedwith with
                                                                a customer     or key
                                                                      a customer      orcard.    SinceSince
                                                                                          key card.      most most
                                                                                                                 station-based       firmsfirms
                                                                                                                         station-based       charge     a basic
                                                                                                                                                     charge    a
                                  fee, the
                                  basic     share
                                          fee,        of inactive
                                               the share            users is
                                                             of inactive      probably
                                                                           users            lower lower
                                                                                   is probably       than among       free-floating
                                                                                                             than among                  operators.
                                                                                                                                free-floating      operators.
                                         While station-based car-sharing was predominant for a long                      long time,
                                                                                                                                 time, free-floating
                                                                                                                                         free-floating has  has
                                  recently outnumbered station-based car-sharing                        regarding      cars
                                                                                      car-sharing regarding cars and users     and    users   in   Germany.
                                  Figure 1 illustrates
                                               illustrates this
                                                              this trend.
                                                                    trend. As Asofof2021,
                                                                                       2021,free-floating
                                                                                                free-floatingcar-sharing
                                                                                                                   car-sharingsums   sums  upup to to
                                                                                                                                                    a total
                                                                                                                                                       a totalof
                                  roughly
                                  of  roughly 14,000
                                                   14,000cars, which
                                                            cars,  whichare are
                                                                              available
                                                                                  availablein 15,in mainly
                                                                                                     15, mainlylargelarge
                                                                                                                       cities,cities,
                                                                                                                                 operated      by five
                                                                                                                                        operated      bycom-
                                                                                                                                                           five
                                  panies [16]. [16].
                                  companies         In contrast,   station-based
                                                           In contrast,               car-sharing
                                                                           station-based               is moreisdecentralized
                                                                                                car-sharing          more decentralized than free-floating
                                                                                                                                                   than free-
                                  car-sharing.
                                  floating          There are
                                             car-sharing.        overare
                                                              There     200over
                                                                             providers     at moreatthan
                                                                                 200 providers          more 6000
                                                                                                                thanlocations      in 855 in
                                                                                                                       6000 locations        German
                                                                                                                                               855 Germancities,
                                  operating
                                  cities,       12,00012,000
                                           operating      cars [16].
                                                                  carsFor  comparison,
                                                                        [16].  For comparison,the 82.8themillion    inhabitants
                                                                                                            82.8 million             of Germany
                                                                                                                              inhabitants              owned
                                                                                                                                               of Germany
                                  owned     40.5 million
                                  40.5 million               noncorporate
                                                    noncorporate                cars (excluding
                                                                      cars (excluding        motor motor
                                                                                                      homes),   homes),
                                                                                                                   of which of which      8.5 million
                                                                                                                                 8.5 million              were
                                                                                                                                                 were regis-
                                  registered     in district-free
                                  tered in district-free            cities
                                                                cities  in in  2017.
                                                                            2017.      Combined
                                                                                   Combined            businessmodels
                                                                                                    business        modelsand  and private
                                                                                                                                      private car-sharing
                                                                                                                                                 car-sharing
                                  (peer-to-peer)
                                  (peer-to-peer) playedplayed aa marginal
                                                                   marginal role
                                                                               role in
                                                                                     in the
                                                                                         the observed
                                                                                               observed years,
                                                                                                            years, so so wewe counted
                                                                                                                               counted combined
                                                                                                                                            combined cars  cars
                                  as free-floating
                                      free-floating and  and left
                                                              left privately
                                                                   privately shared
                                                                                shared carscars out.
                                                                                                  out.

      Figure 1.
      Figure  1. Development
                 Development of
                             of shared
                                shared cars
                                       cars and
                                            and members
                                                members in
                                                        in Germany
                                                           Germany by
                                                                   by year
                                                                      year and
                                                                           and mode
                                                                               mode (data
                                                                                    (data from
                                                                                          from Bundesverband
                                                                                               Bundesverband CarSharing
                                                                                                             CarSharing
      e.V.[17]).
      e.V. [17]).

                                  2.3. Station-Based Car-Sharing
                                                                  car-sharing and its (possible)
                                        Research on the use of car-sharing                (possible) effects
                                                                                                       effects on
                                                                                                               on private
                                                                                                                   private car
                                                                                                                            car ownership
                                                                                                                                 ownership
                                         old as
                                  is as old   as car-sharing
                                                 car-sharing itself
                                                              itself (see,
                                                                      (see, e.g.,
                                                                            e.g., [18],
                                                                                  [18], p.186
                                                                                        p.186 ff.).
                                                                                               ff.). With the
                                                                                                            the rise
                                                                                                                 rise of
                                                                                                                      of the
                                                                                                                          the internet
                                                                                                                               internet and
                                                                                                                                        and
                                  mobile access
                                  mobile   access options
                                                   options in the first decade of the millennium, both station-based
                                                                                                               station-based car-sharing
                                                                                                                                car-sharing
                                       its research
                                  and its   researchbecame
                                                      becameincreasingly
                                                               increasinglypopular.
                                                                               popular.AAlittle
                                                                                            little  less
                                                                                                 less     than
                                                                                                       than    a decade
                                                                                                             a decade      ago,
                                                                                                                        ago,  thethe launch
                                                                                                                                  launch  of
                                  of free-floating
                                  free-floating      options
                                                  options     sparked
                                                          sparked         further
                                                                     further        interest,
                                                                              interest,       particularly
                                                                                         particularly         regarding
                                                                                                         regarding          differences
                                                                                                                     differences         be-
                                                                                                                                   between
                                  free-floating and station-based car-sharing. Almost all studies use customer surveys, asking
                                  participants about their habits and their willingness to (not) own a private car given a
                                  car-sharing option [6]. Nevertheless, in measuring, incentivizing, and isolating the actual
                                  effects (e.g., using a control group), both the studies and their results differ considerably.
Sustainability 2021, 13, 7384                                                                                            4 of 17

                                      Among the earliest and most prominent studies are those by Cervero et al. [3,19,20].
                                The three consecutive and survey-based studies analyze different effects of introducing a
                                station-based car-sharing service in the San Francisco Bay Area. Using non-members as
                                counterfactuals, the authors find that car-sharing reduces one or more cars in more than
                                20% of households [3]. Furthermore, 4.8% of participants claim they would have increased
                                the number of cars without car-sharing. Overall, the authors estimate 28 fewer cars per
                                100 members two years after introducing car-sharing, which corresponds to seven to ten
                                private cars replaced by one shared car (calculated from the reported numbers of shared
                                cars and members). Nonetheless, four years after introducing car-sharing, as part of the
                                third study, Cervero et al. found that the replacement rate had dropped: with a constant
                                user-to-shared-car ratio, one shared car replaces roughly five private cars. The authors
                                concluded that most of the reduction in private cars occurs one to two years after the
                                launch of a car-sharing service [20].
                                      Similar studies followed, for example, a study that examines a station-based car-
                                sharing service in Philadelphia, Pennsylvania, U.S., finding a replacement rate of one to
                                23 [4]. This unusually high result is perhaps rooted in the lack of a control group and a
                                very optimistic set of early adopters. With a large-scale survey of roughly 6000 members of
                                different station-based car-sharing services in North America, Martin et al. found that the
                                average number of cars per member-household drops from 0.47 to 0.24 [2]. The authors
                                estimate that one shared car replaces between nine and thirteen private cars.
                                      The specific context where car-sharing is offered might play a central role. Within
                                a station-based car-sharing scheme, addressing university members in Ithaca, NY, U.S.,
                                Stasko et al. estimate a reduction rate of 0.19 cars per member [21]. This reduction
                                corresponds to a replacement rate of one to 15 [21]. However, the authors note that
                                frequent users are more likely to participate in the survey, which may confirm concerns that
                                surveys are not representative of the population of car-sharing users. Other context-specific
                                factors are the availability of public transport and parking spaces, the types of shared cars,
                                and the cultural context. Two studies analyze station-based car-sharing in Seoul, South
                                Korea, and find that good public transport and parking space problems are critical to
                                motivating people to abandon cars [22,23]. The authors estimate that one station-based
                                car replaces three to five private cars, for the latter assuming a member-to-car ratio of 40:1,
                                which is the median ratio of all reviewed studies that report members and vehicles. Most
                                studies concern the early phase of sharing services, rendering the ratio low compared to
                                more current figures (see Figure 1). However, the share of active subscribers is unknown,
                                and survey participants are disproportionately active. Therefore, we consider a ratio of 40:1
                                as a conservative but reasonable benchmark [22,23]. Another study from China suggests
                                that the potential savings in the number of cars can be even greater in developing countries,
                                as most households do not yet own a car [24].
                                      Many European studies on station-based car-sharing are not published in academic
                                journals but as final reports for various commissioned studies (see, e.g., [25,26]). One
                                exception investigates station-based, round-trip, and peer-to-peer car-sharing in the Nether-
                                lands [27]. While focusing on economic impacts, the study reports a total reduction in car
                                ownership of 0.4 cars per member [27], corresponding to a replacement rate of one to 16
                                (assuming a user-to-car ratio of 40:1).
                                      Only a few studies use data sources other than surveys. One exception combines
                                Canadian census data, household surveys that feature travel data (“origin-destination”),
                                and data from a car-sharing service in Montreal [28]. The authors do not report substitution
                                rates but find that the number of private cars shrinks significantly in areas with high
                                availability of station-based shared cars [28]. Another non-survey-based study relies on
                                answers from the California Household Travel Survey, finding that users of car-sharing own
                                on average 0.27 fewer cars [29]. Attributing this difference to car-sharing and assuming
                                that one shared car serves 40 members, one shared car is equivalent to eleven private cars.
Sustainability 2021, 13, 7384                                                                                              5 of 17

                                    In summary, all reviewed studies find a pronounced impact, ranging between three
                                and 23 replaced cars per station-based shared car. The average of the eight studies above,
                                in which substitution rates can be found or calculated, is 1:11.7 (median 1:11).

                                2.4. Differences between Station-Based and Free-Floating Car-Sharing
                                      Ulm, Germany, was one of the first cities that witnessed the launch of a free-floating car-
                                sharing scheme. Following this development, Firnkorn and Müller analyzed the ecological
                                impact of the new free-floating car scheme in two subsequent studies [30,31]. The first study
                                relies on a cross-section survey, asking pedestrians about their willingness to abandon car
                                ownership. Correcting the answers with a flat rate, the authors estimated that roughly
                                2300 cars would be replaced on a five-year horizon, corresponding to a replacement rate of
                                one to 19. In the second study, one and a half years after introducing the car-sharing service,
                                the authors measured the actual reductions. Further, they asked members for a Likert scale
                                assessment of how causal car sharing was to any reduction. By only accounting for narrow
                                causality (high Likert values), the authors estimate a comparably low replacement rate
                                (1:2–4). With a broader interpretation of causality, they appraise the rate between five and
                                ten but acknowledge the estimate’s sensitivity against the share of inactive members.
                                      A commissioned study accompanied the introduction of car2go, a free-floating car-
                                sharing service, in Frankfurt, Stuttgart, and Cologne, Germany [25]. Based on panel
                                interviews and controlling (among others) for demographic factors and difficulties with
                                the individual parking situation, they find that one car2go car substitutes between 0.3 and
                                0.8 private cars. Therefore, including the registrations of the shared cars, the number of
                                cars on the streets would increase.
                                      Besides asking for actual behavior, for example, plans to scrap a car, some studies
                                apply discrete choice experiments, encountering participants with different travel modes
                                for a hypothetical trip. Such an experiment was conducted to estimate market potentials
                                and impacts of both car-sharing modes in London, UK. Most private cars are abandoned
                                due to station-based car-sharing (3.5%), while free-floating effects are relatively marginal
                                (0.5%) [5]. Another example comes from South Korea: while mainly focusing on the
                                environmental effects and choice patterns given different vehicle configurations, Jung and
                                Koo report that 16% of car-sharing users would abandon an existing car or forgo a planned
                                car purchase [32]. They find that one-way and delivery services increase the likelihood
                                of using car-sharing, thereby exacerbating car-sharing’s overall negative environmental
                                impact [32].
                                      Le Vine and Polak find that 37% of users (are willing to) displace a car or did not
                                purchase a car due to a newly launched free-floating service in London [33]. With 40 mem-
                                bers per car, this reduction corresponds to a replacement rate of one to 15. The individual
                                probability of reducing car ownership due to car-sharing decreases with higher income
                                and higher education. A different study from Vancouver, Canada, mainly focuses on
                                differences between free-floating and station-based car-sharing users. The number of
                                cars per household decreases more among users of station-based car-sharing than among
                                free-floating users [7]. However, the estimated replacement rate of free-floating car-sharing
                                (1:6) is higher than for station-based car-sharing (1:5) [7]. This difference is due to relatively
                                more free-floating users serviced by relatively fewer cars.
                                      Among the most comprehensive studies are those by Becker et al. [6,34], investigating
                                car-sharing in Basel, Switzerland. The authors include an untreated control group (non-
                                users of car-sharing), use a panel design (only [6]), travel diaries (only [6]), and incentivize
                                survey participation (only [6]). In their first study, Becker et al. find that more users of
                                station-based car-sharing (19%) than users of free-floating car-sharing (8%) would buy a
                                car if the service did not exist [34]. Assuming that 40 members share one car, this would
                                correspond to a replacement rate of roughly 1:7.6 and 1:3.2, respectively. The second study
                                follows a panel design. That is, Becker et al. measure actual ownership changes within
                                one year after the launch of a free-floating service. The reported total reduction of 6%
Sustainability 2021, 13, 7384                                                                                             6 of 17

                                corresponds to a replacement rate between 1:0.7 (according to reported members and cars)
                                and 1:2.4 (assuming a member-to-car ratio of 40:1).
                                     Empirical studies examining free-floating car-sharing or differences between the
                                operating modes are scarce. Still, one study analyses the introduction of free-floating car-
                                sharing in eight large German cities, estimating that one shared free-floating car reduces
                                annual new car sales by 2 to 4.5 times [35]. Car ownership, used car sales (title transfers),
                                and station-based car-sharing are not investigated.
                                     Summing up, the literature on the impact of free-floating car-sharing is ambiguous.
                                Studies that rely on stated preferences, a single cross-section survey, and no control tend
                                to estimate double-digit substitution rates. More sophisticated, panel-based studies that
                                measure actual reductions estimate lower replacement rates, some close to zero.
                                     This paper differs from the studies noted above primarily in that it does not rely
                                on surveys. Surveys are an uncomplicated tool to explore new phenomena, but they
                                might lack generalizability. The reasons are self-selection of respondents, motives and
                                incentivization for answering, low response rates, subjectivity, and (frequently) missing
                                treatment- and outside-effect controls. Controls help to correct third-party- and rebound
                                effects, that is, effects on non-users, such as reduced parking space problems or lower
                                car prices. Furthermore, the decision to participate in car-sharing is not random; thus,
                                car-sharing might, in particular, “treat” people who want to abandon one or more cars
                                regardless. In these cases, car-sharing would be a signal and not a cause for (planned)
                                car ownership reductions [27]. Finally, a non-randomness in the participant selection
                                might lead to overestimations. Most of the above-cited studies have a response rate below
                                20%. Thus, some of the results might not apply to all members of car-sharing. Missing
                                incentivization or granting car-sharing vouchers (which applies to all but one reviewed
                                study) might promote frequent user participation.
                                     With this study, we aim to verify the survey-based results empirically. Instead of sur-
                                veying users, we use actual market developments to investigate the relationship between
                                shared cars and the number of registered private cars. As a result, we are not dependent on
                                users’ causality assessments for any car purchase or their predictions about (omitted) car
                                purchases. Simultaneously, the estimates include any rebound effects since we measure the
                                overall development. This approach is consistent with other impact analyses in the sharing
                                economy (as shown in Section 2.1).

                                3. Materials and Methods
                                     This study empirically explores the impact of car-sharing on noncorporate car own-
                                ership and car markets in 35 large German cities between 2012 and 2017. For these cities,
                                we look at changes in the number of registered cars, title transfers, and registrations of
                                new cars and explain them with a set of explanatory variables, particularly the number
                                of shared cars. In doing so, we identify the citywide association between three different
                                dimensions of car ownership and car-sharing.
                                     The study combines data from multiple publicly available sources. Most of the
                                independent variables, as well as the explained variables (car ownership, purchase, and
                                transfers), come from official records such as the German Federal Statistical Office (Destatis),
                                the Federal Employment Agency (Bundesagentur für Arbeit), and the Federal Motor
                                Vehicle Office (Kraftfahrtbundesamt). Furthermore, the Bundesverband CarSharing e.V.
                                (The Federal Association for Car-sharing) provides data on the number of shared cars.
                                     The objects of study are 35 district-free cities in Germany with more than 200,000 in-
                                habitants, resulting from the combination of different data sources: on the one hand, there
                                are 107 district-free cities in Germany, including the city-states Berlin and Hamburg. These
                                correspond to NUTS 3 regions (or higher) and have an unambiguous geographical refer-
                                ence at high availability and quality of official statistics. On the other hand, the data from
                                the Bundesverband CarSharing are partly limited to 37 cities with more than 200,000 inhab-
                                itants, as we explain in Section 3.1. Thus, after excluding two cities for statistical reasons
                                (Karlsruhe is an outlier regarding the number of shared cars and Aachen is formally a
Sustainability 2021, 13, x FOR PEER REVIEW                                                                                            7 of 17

Sustainability 2021, 13, 7384                                                                                                         7 of 17
                                  from the Bundesverband CarSharing are partly limited to 37 cities with more than 200,000
                                  inhabitants, as we explain in Section 3.1. Thus, after excluding two cities for statistical
                                  reasons (Karlsruhe is an outlier regarding the number of shared cars and Aachen is for-
                                  district-free
                                  mally         city but belongs
                                         a district-free city but in the official
                                                                   belongs  in thestatistics
                                                                                    official to a largerto
                                                                                              statistics region), 35region),
                                                                                                           a larger   cities remain  for
                                                                                                                               35 cities
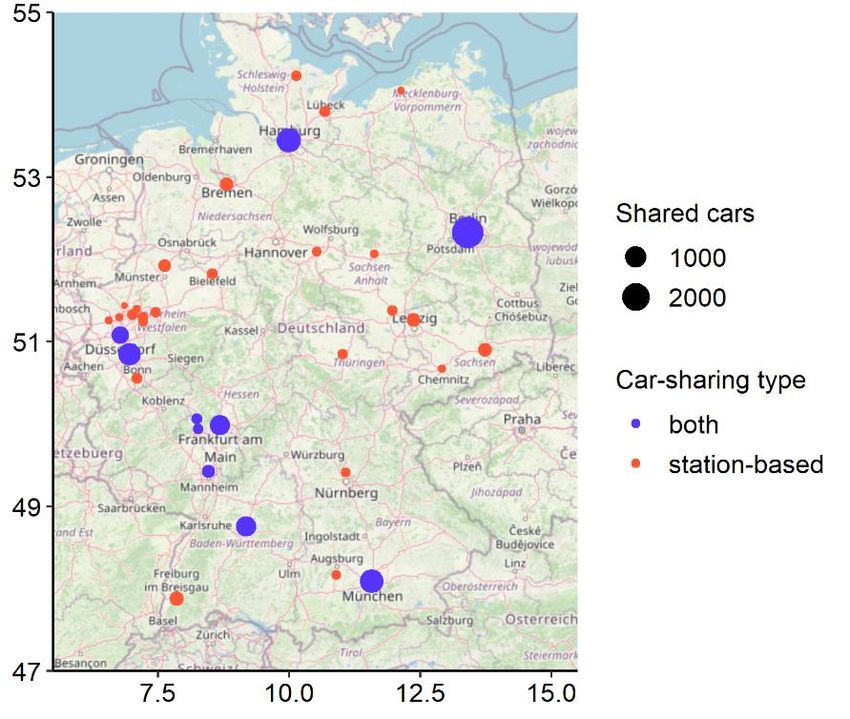
                                  the study.  Figure  2 maps  the  analyzed  cities and   indicates   which types  of car-sharing
                                  remain for the study. Figure 2 maps the analyzed cities and indicates which types of car-        and
                                  how many
                                  sharing  andshared   cars are
                                                how many        available.
                                                             shared  cars are available.

                                  Figure 2.
                                  Figure     Locations of
                                          2. Locations of the
                                                          the analyzed
                                                              analyzedcities,
                                                                         cities,by
                                                                                 bynumber
                                                                                    numberofofshared
                                                                                                 sharedcars
                                                                                                         carsand offered
                                                                                                               and       car-sharing
                                                                                                                   offered           types
                                                                                                                           car-sharing     as
                                                                                                                                       types
                                  of of
                                  as 2015 (background
                                        2015 (backgroundimage
                                                           imagefrom  [36],
                                                                   from     data
                                                                         [36],   from
                                                                               data    [37]).
                                                                                    from  [37]).

                                  3.1. Data Origin of the Dependent Variables (Number of Cars)
                                  3.1. Data Origin of the Dependent Variables (Number of Cars)
                                        The dependent variables and their sources are summarized in Table 1. The authority
                                        The dependent variables and their sources are summarized in Table 1. The authority
                                  defines registrations of new cars as first-time approval and registration of a brand-new
                                  defines registrations of new cars as first-time approval and registration of a brand-new
                                  car with a registration number in Germany [38]. Consequently, new cars have neither
                                  car with a registration number in Germany [38]. Consequently, new cars have neither been
                                  been used abroad nor taken out of service before. In contrast, ownership transfers (used
                                  used abroad nor taken out of service before. In contrast, ownership transfers (used car
                                  car registration) mean that previously registered cars get new owners. The transfer of
                                  registration)   mean that previously registered cars get new owners. The transfer of owner-
                                  ownership can result from, e.g., a gift, legacy, or purchase. We account for gratuitous title
                                  ship  can  result from, e.g.,
                                  transfers by including        a gift, legacy,
                                                            demographic           or purchase.
                                                                                control          Weasaccount
                                                                                         variables             for gratuitous
                                                                                                       indicators              title trans-
                                                                                                                    for inheritances   and
                                  fers
                                  gifts (see next section). By definition, title transfers do not include holders’ movesand
                                       by  including    demographic      control   variables  as indicators   for inheritances         gifts
                                                                                                                                   to other
                                  (see next name
                                  districts,  section). By definition,
                                                    changes,             title transfers
                                                              or handovers                docar
                                                                                 (sales) to  not  include
                                                                                                dealers   holders’ moves to other dis-
                                                                                                        [38].
                                  tricts, name changes, or handovers (sales) to car dealers [38].
                                  Table 1. Overview of the dependent variables.
                                            Table 1. Overview of the dependent variables.
                                              Data                         Source                                 Description
              Data                           Source                                            Description
                                                                                                      Number of cars owned by
                                                                      Number of cars owned by employees       or unemployed per-
                                Federal Motor Vehicle Office
                                        Number of cars
                                                                    Federal Motor Vehicle Office      employees or unemployed
      Number of cars                                                   sons on 1 January each
                                                                    (Kraftfahrtbundesamt, FZ1) year.persons
                                                                                                     Labeledon “cars”
                                                                                                                1 Januaryin the
                                                                                                                            eachequa-
                                                                                                                                 year.
                                (Kraftfahrtbundesamt, FZ1)
                                                                                                 tions.
                                                                                                   Labeled “cars” in the equations.
                                                                        Number of title transfers towards
                                                                                                  Number of employees      or unem-
                                                                                                              title transfers  towards
                                Federal Motor Vehicle Office
Title transfers (used cars)                                                            ployed persons   in a year.or unemployed
                                                                                                      employees
                                             (FZ5)(used cars)       Federal Motor Vehicle Office
                                   Title transfers                               Labeled “used_cars” in thepersons   in a year.
                                                                                                              equations.
                                                                               (FZ5)
                                                                                                      Labeled “used_cars” in the
                                                                      Number of new car registrations by employees or unem-
                                Federal Motor Vehicle Office                                                  equations.
 Registration of new cars                                                              ployed persons in a year.
                                          (FZ5)                                                    Number of new car registrations
                                                                                 Labeled “new_cars” in the equations.
                                                                                                         by employees or unemployed
                                                                    Federal Motor Vehicle Office
                                     Registration of new cars                                                 persons in a year.
                                                                              (FZ5)
                                                                                                          Labeled “new_cars” in the
                                                                                                                 equations.
ainability 2021, 13, x FOR PEER REVIEW                                                                                                                       8 of

        Sustainability 2021, 13, 7384                                                                                                           8 of 17

                                              The dependent variables varied without a clear trend over the observed years,
                                        shown in Figure 3. In the figure, values are normalized to the base year (2012 = 100) a
                                                     The dependent variables varied without a clear trend over the observed years, as
                                        population
                                               shown in (per  capita).
                                                          Figure         The
                                                                  3. In the    flowvalues
                                                                            figure,   variables   of annualtoregistrations
                                                                                            are normalized                     are =
                                                                                                               the base year (2012 subject
                                                                                                                                     100) and to a high
                                        variance     than the
                                              population    (perstock
                                                                 capita).ofThe
                                                                            cars.
                                                                                flowInvariables
                                                                                        2012, 6.6   million
                                                                                                of annual    (private)are
                                                                                                          registrations  cars were
                                                                                                                           subject to registered
                                                                                                                                      a higher      in t
                                              variance   than  the stock  of cars.  In 2012, 6.6 million (private) cars were registered
                                        cities considered, 1.2 million (private) titles were transferred, and 0.2 million (private) ne   in the
                                               cities considered,
                                        cars were     registered.1.2 million (private) titles were transferred, and 0.2 million (private) new
                                               cars were registered.

            Figure 3. Development
 Figure 3. Development      of the of  the number
                                    number        of cars
                                              of cars  perper capita, title
                                                            capita,   title transfers
                                                                             transfersperper
                                                                                          capita, and registrations
                                                                                              capita,               of new cars
                                                                                                       and registrations     ofper
                                                                                                                                newcapita
                                                                                                                                      carsinper capita
            the observed cities (2012 standardized to 100).
 in the observed cities (2012 standardized to 100).
                                                     The statistics explicitly name the number of commercial owners (“gewerbliche Hal-
                                              The
                                               ter”),statistics
                                                      which allows explicitly     namethem
                                                                         us to exclude    the from
                                                                                               number       of commercial
                                                                                                     the total. In this study, weowners
                                                                                                                                     focus on(“gewerbliche
                                                                                                                                                privately       H
                                        ter”), owned
                                                whichcars     for theus
                                                          allows        following  reasons:
                                                                          to exclude    them(i) this
                                                                                                 fromstudy
                                                                                                        thetries  to estimate
                                                                                                             total.   In this the  effectwe
                                                                                                                               study,     of car-sharing
                                                                                                                                               focus on private
                                               on private car ownership, not on company cars, expecting that the impact will be most
                                        owned cars for the following reasons: (i) this study tries to estimate the effect of car-sh
                                               significant among private households; (ii) car-sharing is mainly seen as an offer to private
                                        ing onhouseholds
                                                 private car  andownership,         not on company
                                                                    frequently advertised                  cars,for
                                                                                             as an alternative    expecting     that the used
                                                                                                                     not very frequently    impact     will be mo
                                                                                                                                                  private
                                        significant    among
                                               cars [39];          private
                                                           (iii) the   motives households;      (ii) car-sharing
                                                                                 and organizational     possibilitiesisfor
                                                                                                                         mainly    seen
                                                                                                                           corporate       as an offer
                                                                                                                                        car-sharing    areto priva
                                        households and frequently advertised as an alternative for not very frequently used p
                                               different;   (iv) car   registrations  by companies      distort the  official statistics, inter  alia due
                                               to “one-day-registrations”
                                        vate cars    [39]; (iii) the motives      (“Tageszulassungen”),
                                                                                      and organizational     headquarters     of company
                                                                                                                  possibilities               fleets (e.g.,
                                                                                                                                    for corporate       car-shari
                                               Wolfsburg, where Volkswagen seats, counts more cars than inhabitants), and taxational
                                        are different;     (iv) car registrations by companies distort the official statistics, inter alia d
                                               issues; (v) most reviewed studies address car ownership in a (private) household context;
                                        to “one-day-registrations”
                                               (vi) statistics on private car(“Tageszulassungen”),
                                                                                 ownership cover overall car headquarters
                                                                                                                  ownership quite of      company
                                                                                                                                      well: The Federal fleets (e.
                                        Wolfsburg,       whereOffice
                                               Motor Vehicle        Volkswagen         seats,
                                                                            reported that      counts
                                                                                           of 45.8        more
                                                                                                    million  cars cars   than inhabitants),
                                                                                                                   in Germany                       and taxation
                                                                                                                                 in 2017, 41.0 million
                                               were   held   by  individuals    (90%).  While    private  individuals
                                        issues; (v) most reviewed studies address car ownership in a (private) household account  for  almost   all (95%) conte
                                               used car registrations, businesses dominate new car registrations (64%).
                                        (vi) statistics on private car ownership cover overall car ownership quite well: The Fede
                                        Motor3.2.Vehicle      Office
                                                    Data Origin          reported
                                                                    of the Controls that of 45.8 million cars in Germany in 2017, 41.0 milli
                                        were heldThe   bydataindividuals
                                                                  of the two (90%).     While private
                                                                               main explanatory              individuals
                                                                                                     variables,  the numberaccount
                                                                                                                                of sharedforcarsalmost
                                                                                                                                                  in both all (95
                                        used car    registrations,
                                               free-floating              businesses
                                                               and station-based         dominate
                                                                                      mode,  originatenewfromcar
                                                                                                               the registrations
                                                                                                                    Bundesverband(64%).CarSharing e.V.,
                                              a federal association mainly representing the interests of station-based car-sharing coop-
                                              eratives. The association reports the number of shared cars available in German cities
                                        3.2. Data  Origin of the Controls
                                              (“Städteranking”) regularly every two years by asking all car-sharing companies to report
                                             The
                                              theirdata
                                                    numberof of
                                                              the two
                                                                cars. Wemain     explanatory
                                                                          gathered              variables,
                                                                                    these data for              the number
                                                                                                   the years 2012,   2013, 2015,ofand
                                                                                                                                    shared   cars in bo
                                                                                                                                       2017. For
                                              the first two
                                        free-floating    andyears,  the report includes
                                                              station-based              cities withfrom
                                                                                mode, originate        more the
                                                                                                             thanBundesverband
                                                                                                                    200,000 inhabitants,  while
                                                                                                                                        CarSharing   e.
                                              later reports include smaller cities (>50,000 inhabitants). Due to this switch in the reported
                                        a federal association mainly representing the interests of station-based car-sharing coo
                                              base, there are three analyzable time-series: (i) the set of communities with more than
                                        eratives.  Theinhabitants
                                              200,000     association    reports
                                                                    for all        the(ii)
                                                                            four years; number
                                                                                           the set ofofallshared
                                                                                                           availablecars  available
                                                                                                                     90 cities         in German
                                                                                                                               but for only two     cit
                                        (“Städteranking”) regularly every two years by asking all car-sharing companies to repo
                                        their number of cars. We gathered these data for the years 2012, 2013, 2015, and 2017. F
                                        the first two years, the report includes cities with more than 200,000 inhabitants, wh
                                        later reports include smaller cities (>50,000 inhabitants). Due to this switch in the report
Sustainability 2021, 13, 7384                                                                                                 9 of 17

                                  periods (2015 and 2017); (iii) the entire data set, accepting the imbalance. We chose to apply
                                  the first approach to work with a long-running, balanced panel.
                                        Table 2 provides an overview of the independent variables: The number of shared
                                  cars in both operating modes and control variables expected to influence the number of
                                  cars. The literature mentions demographic and economic factors, as well as the population
                                  density, to influence car ownership [40,41]. Urban factors that are invariant over the
                                  observed time (e.g., highways) are controlled by individual effects. Time-variant factors,
                                  which are the same for all cities (e.g., oil prices, taxes), are controlled by time dummies.

                                          Table 2. Overview of the independent variables.

                 Data                              Source                                         Description
                                        Bundesverband CarSharing e.V.         Number of station-based shared cars on 1 July each
   Shared cars (station-based)
                                             (“Städteranking“)                  year. Labeled “sc_station” in the equations.
                                        Bundesverband CarSharing e.V.         Number of free-floating shared cars on 1 July each
    Shared cars (free-floating)
                                             (“Städteranking“)                   year. Labeled “sc_free” in the equations.
                                                                                  Population density (inhabitants per square
                                     Destatis (12411-0015 and 11111-0002),
        Population density                                                     kilometer) on 31 December each year, calculated
                                                own calculation
                                                                                          from inhabitants and size.
                                                                               Number of employees subject to mandatory social
                                         Federal Employment Agency            insurance contributions relative to population aged
         Employment rate
                                          (“Beschäftigungsquoten”)              between 15 and 65. The reporting date is June 30
                                                                                                  each year.
                                        Federal Employment Agency                 Number of people commuting to another
            Commuters              (“Gemeindedaten [ . . . ] nach Wohn- und     administrative district for work (NUTS 3). The
                                                Arbeitsort“)                         reporting date is 30 June each year.
                                                                              Number of people that moved into the observed city
                                   Destatis/Regionaldatenbank (“Fachserie     as annual total. Due to high refugee influxes in some
         (Domestic) influx
                                                1 Reihe 1.2”)                      years, probably not affecting short-run car
                                                                                 registrations, we only use the domestic influx.
                                         Destatis/Regionaldatenbank              Disposable income of households (including
        Disposable income
                                                (82411-01-03-4)                     non-profit institutions), annual total.
                                         Destatis/Regionaldatenbank
             Marriages                                                                Number of marriages, annual total.
                                        (12611-01-01-4, 12611-01-02-4)
                                         Destatis/Regionaldatenbank
                 Born                                                                   Number of births, annual total.
                                                (12612-01-01-4)
                                         Destatis/Regionaldatenbank
              Deceased                                                                  Number of deaths, annual total.
                                                (12613-01-01-4)

                                       We could not include other developments in the transport sector, such as moped-
                                  sharing, car-pooling, and ride-hailing (e.g., Uber), because of a lack of data. However,
                                  facing legal difficulties and bans, as well as studies showing no or only a weak link, we
                                  do not expect ride-hailing to have a significant impact before 2018 [42–45]. In Germany,
                                  moped-sharing is available for roughly half of the year, which is why we do not expect it
                                  to be a comprehensive substitute to car ownership, but it might be supportive.
                                       Milage delivered by public transport is available but not included in the regression
                                  due to insufficient data quality. Official statisticians pointed out that the informative
                                  value, especially regarding annual changes, might be blurred by improvements in mileage
                                  allocation to the regions served. We searched for completions of sizeable public transport
                                  infrastructure projects or other significant disruptive changes in public transportation but
                                  have not seen any need for further controls.
Sustainability 2021, 13, 7384                                                                                              10 of 17

                                3.3. Empirical Strategy
                                     The first difference estimator is an approach to exclude time-fixed effects from a
                                regression. It means regressing not the absolute levels but the differences of the observed
                                variables between two time periods. The starting point for the basic model is a population
                                model that explains the total number of (noncorporate) cars, here specified by city i:

                                                 carsit = αt + β1 sc_stationit + β2 sc_freeit + x’it γ + ai + uit .            (1)

                                      In Equation (1), carsit represents the number of non-company cars. In line with
                                previous, interview-based studies on the effects of car-sharing on car ownership, we expect
                                that the number of cars in city i at time t depends on the following variables: sc_stationit ,
                                the number of shared cars in station-based mode, and sc_freeit , the number of shared
                                cars operated in a free-floating mode. The term αt is a period-specific intercept, which
                                allows for periodic, aggregate fluctuations in car ownership, for example, the nationwide
                                effects of gasoline price increases or changes in car taxes. The term ai covers unobserved
                                characteristics of the cities that do not (significantly) vary over time, for example, the length
                                of the road network and the number of parking spaces. The vector x’it covers the remaining
                                covariates, as described in Table 2. The error term uit is city- and time-specific.
                                      We obtain the first difference by subtracting from Equation (1) the corresponding
                                equation of the previous period (t − 1). Thereby, the city’s fixed effect ai drops out, as,
                                by assumption, it is not varying over time, and regressions only account for changes in
                                variables over time. The first-difference estimator is a way to suppress problems emerging
                                from omitted variables. We will see that the model most likely suffers from autocorrelation
                                in the error terms (uit ). Thus, fixed effects could deliver biased estimates, making the
                                first-difference estimator the better choice.
                                      We investigate car-sharing’s effects on the markets for cars with a similar approach.
                                However, to interpret the results correctly, we must recognize that the stock of cars results
                                from various additions and disposals. From there on, we take a closer look at two inflows,
                                namely the markets for new and used cars. Changes in the stock of private cars in a city
                                result from the flows adding and removing cars. The following flows increase the number
                                of privately owned cars in a city:
                                1.1   registrations of (privately owned) new cars;
                                1.2   title transfers from companies to private owners within the city;
                                1.3   title transfers due to imports from outside the city;
                                1.4   registrations of cars in the city because of relocation (without changes in ownership).
                                      In contrast, the following flows decrease the number of private cars:
                                2.1   scrapping, suspension, and abandoning of (privately owned) cars;
                                2.2   title transfers from private persons to companies within the city;
                                2.3   title transfers due to out-of-town exports;
                                2.4   suspensions of cars because of relocation (without changes in ownership).
                                      Further, there is one neutral factor for the total number of private cars in a city:
                                3.1   title transfers within the city between private owners.
                                     We will analyze registrations of new cars (1.1) and title transfers (1.2, 1.3, 3.1). Registra-
                                tions of new cars add directly to the stock of registered cars. Thus, if more (noncorporate)
                                new cars are registered, the total number of cars will increase unless at least one opposed
                                flow increases equally (2.1, 2.2., 2.3, and 2.4). We analyze the registrations of new cars
                                in city i at time t (new_carsit ) equivalent to Equation (1) and start with the following
                                population model:

                                              new_carsit = αt + β1 sc_stationit + β2 sc_freeit + x’it γ + ai + uit .           (2)

                                    The variables and procedure (first difference) are equivalent to the explanations for
                                Equation (1).
Sustainability 2021, 13, 7384                                                                                               11 of 17

                                      Private car ownership usually results from a title transfer, and most privately owned
                                cars are former company cars, sometimes only for one day. As previously mentioned,
                                car dealers frequently register new cars for one day to sell them afterward as used cars,
                                thereby allowing for discounts and achieving sales targets. This circumstance renders the
                                measurement of title transfers indispensable to quantify private car purchases. However,
                                measuring title transfers and inferring car ownership can lead to a fallacy: title transfers are
                                three flows (1.2, 1.3, and 3.1), while only two increase the number of privately owned cars
                                (1.2 and 1.3). Thus, an increase in title transfers does not necessarily impact the total number
                                of cars, even when negative flows (2.1, 2.2., 2.3, and 2.4) remain constant. Conversely, the
                                number of registered cars can decrease at constant title transfers if scrapping, resales within
                                the city, or exports increase.
                                      The procedure to estimate the impacts on used cars differs from Equation (2) only on
                                the left-hand side by exchanging new_carsit with used_carsit , which stands for the number
                                of title transfers in city i at time t.
                                      Specific substitutions between the submarkets for shared and new cars might blur
                                fundamental trends regarding the willingness to purchase cars. We control this with a
                                third model, where we use the sum of new car registrations and title transfers as the
                                dependent variable.

                                4. Results
                                4.1. Summary Statistics
                                      There are, on average, 168 station-based shared cars (median: 91) and 209 free-floating
                                cars (median: 0) in the observed 35 cities in 2017. While station-based car-sharing is
                                available in all observed cities, free-floating is only available in 13 of the 35 observed cities in
                                2017: the seven largest cities in the sample (>600,000 inhabitants: Berlin, Hamburg, Munich,
                                Colonia, Frankfurt/Main, Stuttgart, Düsseldorf), two minor cities connected through the
                                free-floating operating area to larger cities (Mainz, Wiesbaden), and four cities with local
                                free-floating initiatives (Essen, Mannheim, Kiel, Halle/Saale). On average, there is one
                                station-based shared car for 3060 inhabitants, ranging between 720 inhabitants (Freiburg)
                                and 130,000 inhabitants (Gelsenkirchen) per shared car. Despite its wide availability, more
                                cars are operated in free-floating than in station-based mode in large cities. In cities with
                                free-floating car-sharing, there is on average one free-floating car per 2332 inhabitants.
                                      The observed cities vary significantly in size, ranging from 208,000 (Rostock) to
                                3.6 million inhabitants (Berlin), with an average of 555,200 inhabitants (median: 325,500) in
                                2017. Therefore, for the following analyses, we divided standardizable variables by the
                                city’s population in means of thousands.
                                      On average, there are 383 private cars per 1000 inhabitants (median: 387) in 2017,
                                with the lowest scores in dense cities (min: 284, Berlin). Annually used and new car
                                registrations range from 1.88 million (2012) to 1.98 million (2016). With this in mind, with
                                1.60 million (2012) to 1.73 million (2016) holder replacements, used cars account for most
                                noncorporate registrations. The number of new registrations has grown (non-steadily) in
                                the examined period.

                                4.2. Number of Private Cars
                                      The results of the first difference model, explaining the number of privately owned cars,
                                can be found in Table 3. All three models include the car-sharing variables and time dummies
                                but differ in the number of controls added. The first model in Table 3 does not incorporate any
                                controls (1), the second one includes all controls (2), and the third one only includes significant
                                controls (3). All reported standard errors are heteroscedasticity consistent.
                                      In model one of Table 3, both car-sharing variables correlate strongly and negatively
                                with the number of cars. The effect of station-based car-sharing seems to be twice the size
                                of free-floating car-sharing.
                                      The estimates change when controlling for other effects such as demography and
                                commuters, especially for free-floating car-sharing (models two and three). The estimated
Sustainability 2021, 13, 7384                                                                                                    12 of 17

                                     coefficients for free-floating shared cars in models two and three in Table 1 are not sig-
                                     nificantly different from zero. The coefficients of station-based shared cars become more
                                     significant but reduce in size, indicating that one station-based shared car replaces close to
                                     nine private cars. Models two and three in Table 3 add significant controls to the model,
                                     which interact with the number of free-floating shared cars. Density and influx relate to
                                     fewer cars, while commuters relate to more noncorporate cars.

                                Table 3. First difference models explaining the number of noncorporate cars.

   Dependent Variable: Cars                         (1)                                       (2)                   (3)
   shared cars (station-based)                  −11.910 **                               −8.960 ***             −8.826 ***
                                                 (4.871)                                   (2.457)               (2.153)
    shared cars (free-floating)                 −5.725 ***                                  0.109                −0.096
                                                 (1.638)                                   (0.878)               (0.835)
               density                                                                   −0.100 ***             −0.098 ***
                                                                                           (0.011)               (0.010)
            employment                                                                      0.040
                                                                                           (0.225)
             commuters                                                                   0.300 ***               0.310 ***
                                                                                           (0.095)                (0.089)
                influx                                                                   −0.096 **               −0.099 **
                                                                                           (0.047)                (0.043)
        disposable income                                                                 −0.0002
                                                                                          (0.0004)
            density t − 1                                                                   0.003
                                                                                           (0.004)
          commuter t − 1                                                                 0.164 ***               0.153 ***
                                                                                           (0.043)                (0.037)
         Period Dummies                            Yes                                       Yes                    Yes
             Intercept                             Yes                                       Yes                    Yes
           Observations                             105                                      105                    105
               R2                                  0.496                                    0.799                  0.798
             Adj. R2                               0.476                                    0.775                  0.781
 Autocorrelation in differenced
                                                Yes p   < 0.01                           No p      = 0.11       No p    = 0.11
       errors (α = 5%)
  Autocorrelation in original
                                                Yes p   < 0.01                           Yes p     < 0.01       Yes p   < 0.01
       errors (α = 5%)
                                                     Note: * p < 0.1; ** p < 0.05; *** p < 0.01.

                                           The fixed-effects estimator (within estimator) is more efficient than the first difference
                                     estimator when the unobservable errors are uncorrelated. Nevertheless, if the unobservable
                                     errors are correlated, the estimates can be biased ([46] pp. 321–326). We approximate
                                     correlation in the errors by testing if the differenced errors are autocorrelated. The bottom
                                     of Table 3 informs about autocorrelation in the differenced and original errors. In Model 1,
                                     both errors are autocorrelated, indicating that the model’s results might not be reliable,
                                     for example, due to omitted variables. In Models 2 and 3, differenced errors are not
                                     autocorrelated, while original errors are. This indicates that using the first difference
                                     estimator is legitimate, while estimates from a fixed-effects transformation might lead to
                                     wrong conclusions.
                                           Summing up, the findings suggest that an increase in station-based shared cars corre-
                                     lates with a decrease in private car ownership. In contrast, free-floating cars do not seem to
                                     relate to private car ownership empirically. There is neither a comovement of private cars
                                     and shared cars nor a reduction in private cars with more free-floating shared cars.

                                     4.3. Registrations of New and Used Cars
                                          Table 4 presents estimates of the effects of car-sharing on the number of new car
                                     registrations and title transfers. Equivalently to Table 1, Models 1, 4, and 7 solely include the
Sustainability 2021, 13, 7384                                                                                                                                               13 of 17

                                             number of shared cars and dummies. Models 2, 5, and 8 include all controls; models three,
                                             six, and nine only those that remain significant after an iterative removal of insignificant
                                             controls. Again, we report heteroskedasticity-consistent standard errors.

                  Table 4. First difference models explaining the number of new and used car registrations (title transfers).

                                                                                            Dependent Variable:
                                        New Car Registrations                                     Title Transfers                                 Both (New + Used)
                                  (1)             (2)              (3)              (4)                 (5)             (6)              (7)              (8)              (9)
      shared cars
                           −1.590 ***          −1.324 **        −1.462 ***        −0.744              1.166            0.916           −2.334           −0.158           −0.084
    (station-based)
                                (0.545)         (0.536)          (0.502)          (1.779)             (1.949)         (2.181)          (1.710)          (1.905)          (1.759)
       shared cars
                                0.204            0.229            0.201          −2.125 **            −1.017          −1.297          −1.920 **         −0.788           −0.899
     (free-floating)
                                (0.224)         (0.261)          (0.255)          (0.834)            (0.965)          (1.069)          (0.974)          (1.188)          (1.114)
         density                                −0.001                                              −0.010 **        −0.014 ***                        −0.011 **        −0.011 **
                                                (0.002)                                              (0.004)          (0.005)                           (0.005)          (0.005)
      employment                                −0.008                                              −0.319 *                                           −0.327 *         −0.336 *
                                                (0.053)                                              (0.164)                                            (0.199)          (0.194)
      commuters                                0.041 **         0.038 **                             0.090 *                                           0.131 **         0.127 **
                                                (0.018)         (0.018)                              (0.047)                                            (0.055)          (0.053)
         influx                                −0.027 *         −0.026 *                              0.033                                              0.005
                                                (0.015)         (0.014)                              (0.035)                                            (0.044)
   disposable income                           −0.00000                                             −0.0001                                            −0.0001
                                               (0.0001)                                             (0.0003)                                           (0.0003)
       marriages                                −0.233                                                0.029                                             −0.204
                                                (0.232)                                              (0.429)                                            (0.529)
          born                                 0.298 **          0.290 **                           1.366 ***        1.535 ***                         1.664 ***        1.675 ***
                                                (0.140)          (0.140)                             (0.367)          (0.368)                           (0.424)          (0.427)
        deceased                                 0.062                                              1.056 **         0.899 **                          1.118 **         1.079 **
                                                (0.176)                                              (0.420)          (0.449)                           (0.501)          (0.511)
   Period Dummies                Yes              Yes              Yes              Yes                Yes              Yes              Yes              Yes              Yes
        Intercept                Yes              Yes              Yes              Yes                Yes              Yes              Yes              Yes              Yes
     Observations                105              105              105              105                105              105              105              105              105
           R2                   0.703            0.738            0.734            0.587              0.687            0.664            0.267            0.443            0.442
      Adjusted R2               0.691            0.704            0.715            0.570              0.646            0.639            0.238            0.370            0.389
   Autocorrelation in
   differenced errors      Yes p    = 0.02     Yes p   = 0.03   Yes p   = 0.02   No p    = 0.12     No p    = 0.59   No p    = 0.91   No p    = 0.79   No p    = 0.06   No p    = 0.07

        (α = 5%)
   Autocorrelation in
     original errors       Yes p    = 0.02     Yes p   = 0.02   Yes p   = 0.02   Yes p   < 0.01     Yes p   < 0.01   Yes p   < 0.01   Yes p   < 0.01   Yes p   < 0.01   Yes p   < 0.01

        (α = 5%)
                                                                 Note: * p < 0.1; ** p < 0.05; *** p < 0.01.

                                                  Models 1 to 3 in Table 4 suggest that station-based shared cars correlate negatively
                                             with new car registrations. The effect sizes range between −1.3 and −1.6, suggesting that
                                             one additional, station-based shared car relates to roughly 1.5 fewer noncorporate new car
                                             registrations. The estimate is significant for all four models, with p < 0.05 for Model 2 and
                                             p < 0.01 for Models 1 and 3. The coefficients for free-floating cars are slightly larger than
                                             zero but statistically not significant. Notably, there is autocorrelation in the differenced
                                             errors, indicating that the results might be biased.
                                                  The results for used cars (title transfers) are inconclusive (Models 4–6, Table 4). All
                                             but one of the coefficients do not differ significantly from zero and tend to reverse signs
                                             compared to the results for new cars. That is, the coefficients for station-based shared cars
                                             are positive, and those for free-floating cars are negative.
                                                  The combined number of registrations (Models 7–9, Table 4) is the sum of new car
                                             registrations and title transfers. The coefficients indicate a negative relationship between all
                                             types of shared cars and car registrations, but the effects are minor and do not significantly
                                             differ from zero.

                                             5. Discussion and Conclusions
                                                 Car sharing has become a widely available mobility service in recent years. At the
                                             same time, car-sharing is often seen as a building block for a more sustainable tomorrow.
Sustainability 2021, 13, 7384                                                                                            14 of 17

                                This study investigates the relationship of station-based and free-floating car-sharing to
                                noncorporate car ownership in 35 German cities. We contribute to the research on the
                                sustainability of car-sharing and empirical impact investigations of the sharing economy.
                                      Most studies on car-sharing rely on single surveys, which raised concerns concerning
                                their generalizability [6]. Furthermore, particularly the literature on free-floating car-sharing
                                obtains inconsistent results regarding its contribution to reducing car ownership [25,30]. At
                                the same time, the literature on the impact of other sharing businesses gives an excellent
                                example of how empirical explorations can corroborate survey-based findings [8,12,13].
                                This analysis connects both literature streams, adding a new perspective on the impact of
                                the sharing economy and overcoming some problems of survey-based research.
                                      This study has two sets of findings on two dimensions: First, we differentiate between
                                impacts on the stock (of cars) and impacts on the markets (for used and new cars). Second,
                                we differentiate between two operating modes of car-sharing, which are either free-floating
                                or station-based.
                                      The results presented in Section 4.2 suggest that the number of station-based shared
                                cars correlates negatively with the stock of noncorporate cars. We find that one station-
                                based shared car replaces almost nine private cars. The effect is smaller than most survey-
                                based studies suggest. We explain this difference by the fact that an empirical assessment
                                does not suffer from selection and recall biases and includes rebound effects. Unsurpris-
                                ingly, our findings confirm relatively conservative results of studies that control for such
                                influences, for example, by panel surveys [3,6].
                                      Further, the results from Section 4.2 suggest that free-floating car-sharing does not
                                lead to a reduction in car ownership. The variable interacts with controls, indicating
                                that free-floating car-sharing occurs under circumstances where private car ownership
                                is in the retreat, namely large cities. Then, other effects such as density increases and
                                influx are the true drivers of car ownership reductions. As for the case of station-based
                                car-sharing, our empirical results reflect findings from survey-based results that try to
                                minimize biases [6,25]. That is, this study suggests that free-floating car-sharing does not
                                significantly affect car ownership.
                                      The results presented in Section 4.3, that is, the impact of car-sharing on the desire for
                                private cars, are not large enough to explain ownership reductions and do not significantly
                                differ from zero. Two reasons are feasible: Either car-sharing does not influence the
                                willingness to purchase cars, or it does, but rebound effects dampen the measurable impact.
                                These rebound effects could, for example, be rooted in discounts by car dealers or shorter
                                car holding periods.
                                      Future research could further clarify the impact of car-sharing on the flows that
                                increase and decrease the total number of privately owned cars in a city. A holistic approach
                                would be helpful to explain the developments in the stock of cars comprehensively. Since
                                we know that station-based car-sharing reduces ownership, our findings suggest that some
                                other flows might be affected, too (i.e., scrapping, sales, or departures). In contrast to our
                                findings, other publications report that free-floating car-sharing decreases sales of new
                                cars; many members report a willingness to postpone or forego car purchases [2,3,27,35].
                                However, panel surveys show that car-sharing does not deter planned car purchases and
                                the actual reductions are smaller than those expected [6,25]. Thus, again, our findings match
                                conservative results from studies that differentiate between planned and actual reductions.
                                      Turning to the environmental impact of car-sharing, measuring ownership reductions
                                constitutes only a first step. Even if car-sharing induces ownership decreases, the envi-
                                ronmental impact is still negative if carless households increase their mileage more than
                                former car-owners reduce it [32]. Contrariwise, it is hard to imagine how car-sharing might
                                overall decrease mileage when it does not lead to a reduction in privately owned cars. In
                                the first step, car-sharing adds cars to the car fleet and makes car driving easily accessible.
                                Consequently, its environmental impact depends on the user’s reaction. Our analyses show
                                that station-based car-sharing induces quite pronounced ownership adaptions; environ-
You can also read